. 2022 Dec 6;121(23):4644-4655.
doi: 10.1016/j.bpj.2022.10.024. Epub 2022 Oct 20.

Single-molecule dynamics of surface lipoproteins in bacteroides indicate similarities and cooperativity

Affiliations

Single-molecule dynamics of surface lipoproteins in bacteroides indicate similarities and cooperativity

Laurent Geffroy et al. Biophys J. .

Abstract

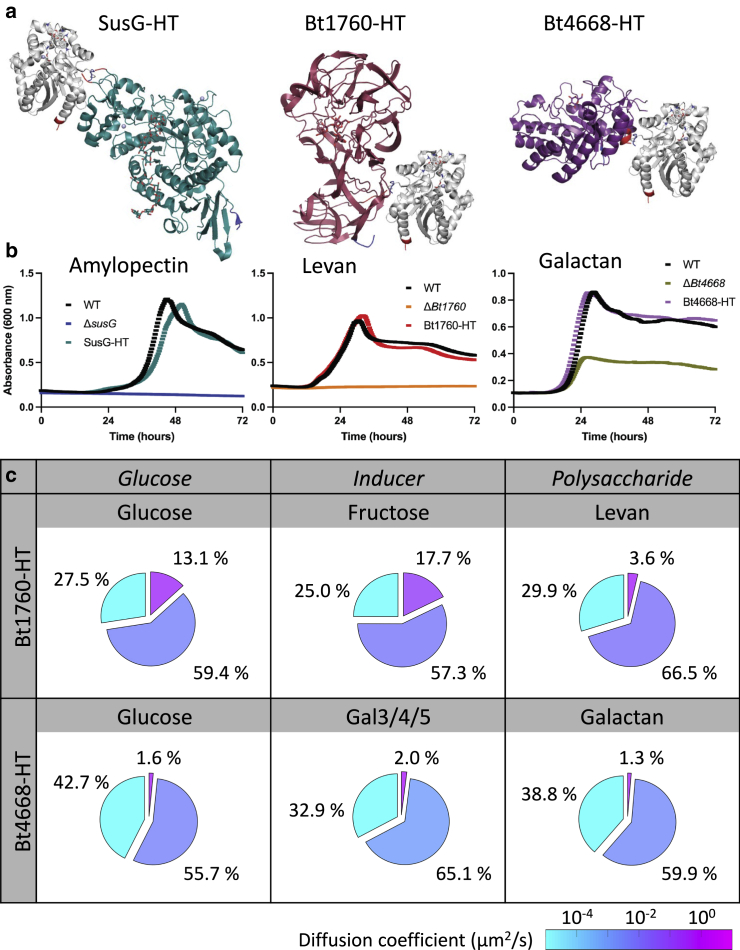
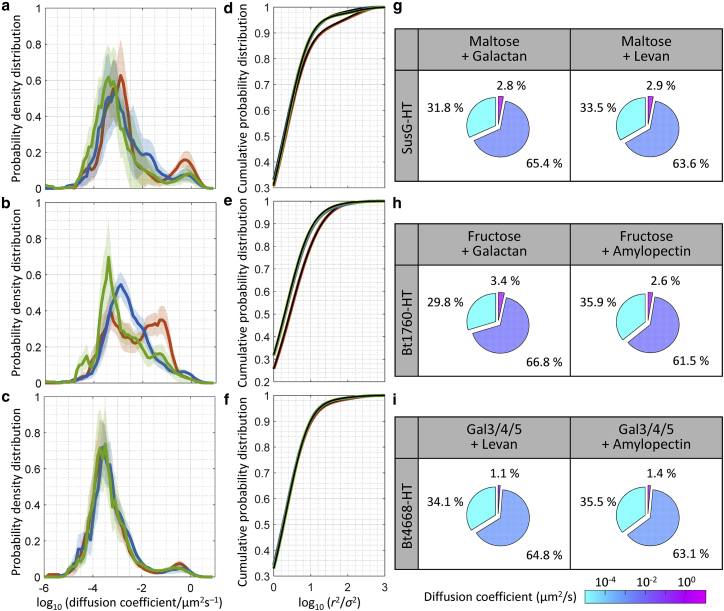
The gut microbiota comprises hundreds of species with a composition shaped by the available glycans. The well-studied starch utilization system (Sus) is a prototype for glycan uptake in the human gut bacterium Bacteroides thetaiotaomicron (Bt). Each Sus-like system includes outer-membrane proteins, which translocate glycan into the periplasm, and one or more cell-surface glycoside hydrolases, which break down a specific (cognate) polymer substrate. Although the molecular mechanisms of the Sus system are known, how the Sus and Sus-like proteins cooperate remains elusive. Previously, we used single-molecule and super-resolution fluorescence microscopy to show that SusG is mobile on the outer membrane and slows down in the presence of starch. Here, we compare the dynamics of three glycoside hydrolases: SusG, Bt4668, and Bt1760, which target starch, galactan, and levan, respectively. We characterized the diffusion of each surface hydrolase in the presence of its cognate glycan and found that all three enzymes are mostly immobile in the presence of the polysaccharide, consistent with carbohydrate binding. Moreover, experiments in glucose versus oligosaccharides suggest that the enzyme dynamics depend on their expression level. Furthermore, we characterized enzyme diffusion in a mixture of glycans and found that noncognate polysaccharides modify the dynamics of SusG and Bt1760 but not Bt4668. We investigated these systems with polysaccharide mixtures and genetic knockouts and found that noncognate polysaccharides modify hydrolase dynamics through some combination of nonspecific protein interactions and downregulation of the hydrolase. Overall, these experiments extend our understanding of how Sus-like lipoprotein dynamics can be modified by changing carbohydrate conditions and the expression level of the enzyme.


Conflict of interest statement

Declaration of interests The authors declare no competing interests.

Figures

Figure 1
Figure 1
Single-molecule tracking of SusG-HT in living B. thetaiotaomicron (Bt) cells. (a) The native copy of a glycoside hydrolase (SusG, Bt4668, or Bt1760) is genetically fused to a HaloTag (HT) protein and labeled exogenously with PA-JF549. (b) Phase-contrast image of a Bt cell and representative fluorescence images at successive time points. The single-molecule localization fits (pink circles) and corresponding trajectories (pink lines) are overlaid. (c) Representative phase-contrast images of a Bt cell grown in 0.25% glucose, maltose, and amylopectin, respectively. The trajectories (solid lines) of representative SusG-HT molecules in each cell are overlaid. Each trajectory is color coded according to its apparent diffusion coefficient (color scale). (d) Probability density distribution of the apparent diffusion coefficients for the SusG-HT trajectories collected in cells grown in 0.25% glucose (green), maltose (orange), and amylopectin (blue), respectively. The solid lines and shaded areas represent the mean and the standard deviation of replicate experiments, respectively. (e) Cumulative probability distributions (CPDs) of squared displacements, r2 (each trajectory in (d) is a sequence of such displacements) collected in SusG-HT cells grown in 0.25% glucose (green), maltose (orange), and amylopectin (blue), respectively, plotted for the 40-ms time lag. The black curves show the fit of each CPD to a three-state simple diffusion model (Supporting Materials and Methods Eq. 2). The squared displacement values are normalized by the corresponding squared localization uncertainty, σ2. (fh) Fits of CPD curves as in (e) as a function of time lag indicate three diffusive states for each growth condition: immobile (cyan), slow diffusion (blue-purple), and fast diffusion (pink). The percentage (weight fraction) and diffusion coefficient (color scale) of SusG-HT in each diffusion state is indicated for trajectories collected in cells grown in 0.25% (f) glucose, (g) maltose, and (h) amylopectin. Apparent diffusion coefficient values are color coded according to the color scale in (c). To see this figure in color, go online.
Figure 2
Figure 2
SusG-HT, Bt1760-HT, and Bt4668. (a) Predicted positioning of the HaloTag (HT) protein in a fusion to SusG with bound maltoheptaose (PDB: 3K8L) (21), Bt1760 with bound levotetraose (PDB: 6R3U) (40), and Bt4668 with bound galactose (PDB: 6GPA) (38) (teal, red, and purple, respectively). Rhodococcus HaloTag with bound tetramethyl rhodamine ligand (PDB: 6U32) (42) is positioned where it was cloned into each protein (gray). In all proteins, the N-terminus is blue and the C-terminus is red, except in SusG, where the site of HaloTag incorporation is red. (b) Bt expressing SusG-HT, Bt1760-HT, and Bt4668-HT grow on 0.5% amylopectin, levan, and galactan, respectively. The corresponding gene deletion strains are also shown to demonstrate that deletion of the genes of interest completely abrogates growth on the cognate glycan. (c) Bt1760-HT and Bt4668-HT dynamics in their cognate carbohydrates. The CPDs of the squared displacements for Bt1760-HT and Bt4668-HT trajectories collected in Bt cells grown in their respective cognate carbohydrates (as indicated) were fit to a three-state log-normal model (Supporting Materials and Methods Eq. 2) to differentiate between three diffusive states for each growth condition: immobile (cyan), slow diffusion (blue-purple), and fast diffusion (pink). The percentage (weight fraction) and diffusion coefficient (color scale) of the glycoside hydrolase in each diffusion state is indicated for trajectories collected in cells grown in 0.25% (w/v) of the indicated carbohydrate. Apparent diffusion coefficient values are color coded according to the color scale. To see this figure in color, go online.
Figure 3
Figure 3
Working model of SusG-HT, Bt1760-HT, and Bt4668-HT glycoside hydrolase dynamics in their cognate carbohydrates. (a) In glucose, the glycoside hydrolase transitions from a freely diffusing (F) state to an immobile (I) state where it interacts transiently with one or few outer-membrane proteins. (b) In the presence of the inducer, the glycoside hydrolase interacts with many outer-membrane proteins due to the high level of expression of the PUL. These cooperative protein interactions stabilize the complexed glycoside hydrolase (by ΔEC) and subtly increase the activation barrier (ΔEA) compared with glucose, thus reducing the transition rate between I and F. (c) The polysaccharide provides an extra stabilization of the complexed glycoside hydrolase (ΔEP), dramatically shifting the equilibrium toward the I state. To see this figure in color, go online.
Figure 4
Figure 4
SusG-HT, Bt1760-HT and Bt4668-HT dynamics in the presence of a noncognate carbohydrate. (ac) Probability density distribution of the apparent diffusion coefficients and (df) cumulative probability distributions of squared displacements, r2, plotted for the 40-ms time lag, for (a, d) SusG-HT in maltose (0.25%, orange), maltose and galactan (0.25% each, blue), maltose and levan (0.25% each, green); (b, e) Bt1760-HT in fructose (0.25%, orange), fructose and galactan (0.25% each, blue), fructose and amylopectin (0.25% each, green); (c, f) Bt4668-HT in Gal3/4/5 (0.25%, orange), Gal3/4/5 and levan (0.25% each, blue), Gal3/4/5 and amylopectin (0.25% each, green). The solid lines and shaded areas in (ac) represent the mean and the standard deviation of replicate experiments, respectively. The black curves in (d–f) show the fit of each CPD to a three-state simple diffusion model (Supporting Materials and Methods Eq. 2). Corresponding percentage (weight fraction) and diffusion coefficient (color scale) of (g) SusG-HT, (h) Bt1760-HT, and (i) Bt4668-HT in each diffusion state. To see this figure in color, go online.
Figure 5
Figure 5
SusG-HT dynamics in the presence of a noncognate polysaccharide in Bt cells knocked out for the corresponding PUL. (ac) Probability density distribution of the apparent diffusion coefficients and (df) cumulative probability distribution of squared displacements, r2, plotted for the 40-ms time lag, for (a, c) SusG-HT Δfructan in maltose (0.25%, orange), maltose and levan (0.25% each, green); (b, d) SusG-HT Δgalactan in maltose (0.25%, orange), maltose and galactan (0.25% each, purple). The solid lines and shaded areas in (a–c) represent the mean and the standard deviation of replicate experiments, respectively. The black curves in (d–f) show the fit of each CPD to a three-state simple diffusion model (Supporting Materials and Methods Eq. 2). Corresponding percentage (weight fraction) and diffusion coefficient (color scale) of (e) SusG-HT Δfructan and (h) SusG-HT Δgalactan in each diffusion state. To see this figure in color, go online.
Figure 6
Figure 6
Relative transcription levels of the sus, fructan, and galactan glycoside hydrolases by qRT-PCR. Transcription level fold change for SusG (blue), Bt4668 (orange), and Bt1760 (yellow) for Bt cells grown in (a) maltose and galactan (0.25% each), maltose and levan (0.25% each), measured relative to levels in maltose (0.25%); (b) fructose and galactan (0.25% each), fructose and amylopectin (0.25% each), measured relative to levels in fructose (0.25%); (c) Gal3/4/5 and levan (0.25% each), Gal3/4/5 and amylopectin (0.25% each), measured relative to levels in Gal3/4/5 (0.25%). To see this figure in color, go online.

References

    1. Buffie C.G., Pamer E.G. Microbiota-mediated colonization resistance against intestinal pathogens. Nat. Rev. Immunol. 2013;13:790–801. - PMC - PubMed
    1. Shreiner A.B., Kao J.Y., Young V.B. The gut microbiome in health and in disease. Curr. Opin. Gastroenterol. 2015;31:69–75. - PMC - PubMed
    1. Ndeh D., Gilbert H.J. Biochemistry of complex glycan depolymerisation by the human gut microbiota. FEMS Microbiol. Rev. 2018;42:146–164. - PubMed
    1. Makki K., Deehan E.C., et al. Bäckhed F. The impact of dietary fiber on gut microbiota in host health and disease. Cell Host Microbe. 2018;23:705–715. - PubMed
    1. Huttenhower C., Gevers D., et al. White O. Structure, function and diversity of the healthy human microbiome. Nature. 2012;486:207–214. - PMC - PubMed

LinkOut - more resources