. 2022 Dec;9(34):e2203693.
doi: 10.1002/advs.202203693. Epub 2022 Oct 20.

Ultra-Fast Portable and Wearable Sensing Design for Continuous and Wide-Spectrum Molecular Analysis and Diagnostics

Affiliations

Ultra-Fast Portable and Wearable Sensing Design for Continuous and Wide-Spectrum Molecular Analysis and Diagnostics

Arnab Maity et al. Adv Sci (Weinh). 2022 Dec.

Abstract

The design and characterization of spatiotemporal nano-/micro-structural arrangement that enable real-time and wide-spectrum molecular analysis is reported and demonestrated in new horizons of biomedical applications, such as wearable-spectrometry, ultra-fast and onsite biopsy-decision-making for intraoperative surgical oncology, chiral-drug identification, etc. The spatiotemporal sesning arrangement is achieved by scalable, binder-free, functionalized hybrid spin-sensitive (<↑| or <↓|) graphene-ink printed sensing layers on free-standing films made of porous, fibrous, and naturally helical cellulose networks in hierarchically stacked geometrical configuration (HSGC). The HSGC operates according to a time-space-resolved architecture that modulate the mass-transfer rate for separation, eluation and detection of each individual compound within a mixture of the like, hereby providing a mass spectrogram. The HSGC could be used for a wide range of applictions, including fast and real-time spectrogram generator of volatile organic compounds during liquid-biopsy, without the need of any immunochemistry-staining and complex power-hungry cryogenic machines; and wearable spectrometry that provide spectral signature of molecular profiles emiited from skin in the course of various dietry conditions.

Keywords: breast cancer; chiral molecules; hierarchical electronics; molecular analysis; sensors; spectromerty; volatile organic compound; wearable devices.


Conflict of interest statement

The authors declare no conflict of interest.

Figures
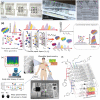
Figure 1
Figure 1
Nature‐inspired HSGC spectrometry. a,b) HSGC planar and folded structure printed with FDrGO sensor pixel array (4 × 5 matrix) between silver nanowire‐based multijunction printed electrodes on porous paper substrate inspired from butterfly wings (c), see also Figure S1a,b, (Supporting Information); d) Schematic model of HSGC‐based layered exposure to show Spatio‐temporal splitting and its comparison with direct exposure to sensor (shown in dotted inset). e) Biomedical application of HSGC structure simultaneous structural/chiral recognition, real time rapid biopsy of a cancerous tumor, wearable spectrometry on human skin. A photograph of flexible circuit embedded with a microprocessor‐based computing unit is also shown in the inset; f) circuit schematic for communicating (inter‐integrated controller (I2C) protocol) all printed pixels from printed layers. The typical ligands are mentioned near each pixel (see a detailed list of ligands in Table S1 Supporting Information).
Figure 2
Figure 2
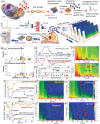
Characterization of GO, DrGO, and FDrGO structures. a–d), Typical SEM image of microstructures for GO, DrGO, thiol‐DrGO, and amine‐DrGO respectively. e–l) Raman spectroscopy, FTIR, FET, and I‐V characteristics for GO, DrGO, and various FDrGO samples with calculated ID/IG ratio as noted in the figure. Cytotoxic assessment of m) untreated human lung epithelial cells (BEAS‐2B, ATCC, and CRL‐9609) to treat with n,o) typical amine (Diethalolamine) and p,q) thiol (2‐amino‐4‐chloro‐benzene thiol) terminated FDrGO samples for 10–100 µg mL−1 respectively. r) The live cell% after 24 h treatment is compared with untreated cells.
Figure 3
Figure 3
Prismatic gas dispersion properties of HSGC. a–c) HSGC‐derived chromatographic separation of a typical VOC mixture, methanol:ethanol: isopropanol (M:E:I = 1:1:1), at layers 1, 2, and 3 respectively. d) Using layer 2 HSGC (optimized), the M:E:I mix sensing results for molar ratios i) 1:1:2, ii) 1:2:1, and iii) 2:1:1; the respective polar plot is shown on the right. The red arrow signifies the direction of movement from one VOC balloon to others as the measurement time (converted here to angle = t × 10.28) progresses. e,f) Deep learning‐based architecture to predict the chromatogram from typical mix VOCs MVOC1 to MVOC12 using 50 hidden deep learning layers. g) HSGC as the chiral stationary phase. h) Typical sensing result of pure, racemic, and enantiomeric mixtures using mercapto benzoic acid as ligand. i,j) Schematic of the image constructed from layer 2 of the input image patterns generated from combinations of all ligands (FDrGO) for the enantiomeric mixture (2:1 and 1:2), respectively. k) the predicted separation result, and confusion matrix of each ratio is shown with ≈94% accuracy.
Figure 4
Figure 4
Hybrid Graphene chromatography for rapid cancer diagnosis. a) Schematic model of VOC‐based biomarker (see the mechanism in the inset) analyses for diagnosing breast cancer and comparison of operating time of HSGC device with the cryo‐section procedure during cancer surgery and GC–MS operation. b) The standard GC and c) HSGC‐derived chromatogram of cancerous and healthy breast tissue samples using a typical amine‐DrGO (DrGO‐diethanolamine) sensor. d) The calculated fitted results for estimating retention times to discriminate between cancerous and normal cells with 180° phase difference in retention time (from HSGC sensing result). e) Time‐frequency spectrographic representation of i) healthy breast tissue and ii) malignant tumor. f–k) Effect of sensor ligand chemistry to modulate the spectrum type for healthy and cancerous breast tissues.
Figure 5
Figure 5
a) Schematic and b,c) photograph of wearable spectrometry from skin implanted HSGC device and trap. d) Real time chromatogram display directly from skin measurements, e) Chromatogram of skin extract obtained from HSGC geometry to monitor dietary influences, and f) related retention times and heights showing maximum abundance. g) GC‐MS heat map results, and h–m) HSGC extracted chromatogram to monitor dietary influences (gluten (1), caffeine (2), dairy (3), fatty meal (4), cigarette smoke(5), and sugary product(6) (see details also in Table S5 and Figure S15, Supporting Information).

References

    1. Richards D., Morren J. A., Pioro E. P., J. Neurol. Sci. 2020, 417, 117054. - PubMed
    1. Jensen A. R., Mainz J., Overgaard J., Acta Oncol. 2002, 41, 147. - PubMed
    1. Nguyen V. Q., Jiang D., Hoffman S. N., Guntaka S., Mays J. L., Wang A., Gomes J., Sorrentino D., Inflammatory Bowel Dis. 2017, 23,1825. - PubMed
    1. Mohammed K. I., Zaidan A. A., Zaidan B. B., Albahri O. S., Alsalem M. A., Albahri A. S., Hadim A., Hashim M., J. Med. Syst. 2019, 43, 223. - PubMed
    1. Yamamoto Y., Harada S., Yamamoto D., Honda W., Arie T., Akita S., Takei K., Sci. Adv. 2016, 2, e1601473. - PMC - PubMed

Publication types

Grants and funding

LinkOut - more resources