. 2022 Dec;7(4):778-794.
doi: 10.1016/j.idm.2022.10.003. Epub 2022 Oct 13.

The role of super-spreaders in modeling of SARS-CoV-2

Affiliations

The role of super-spreaders in modeling of SARS-CoV-2

François Rousse et al. Infect Dis Model. 2022 Dec.

Abstract

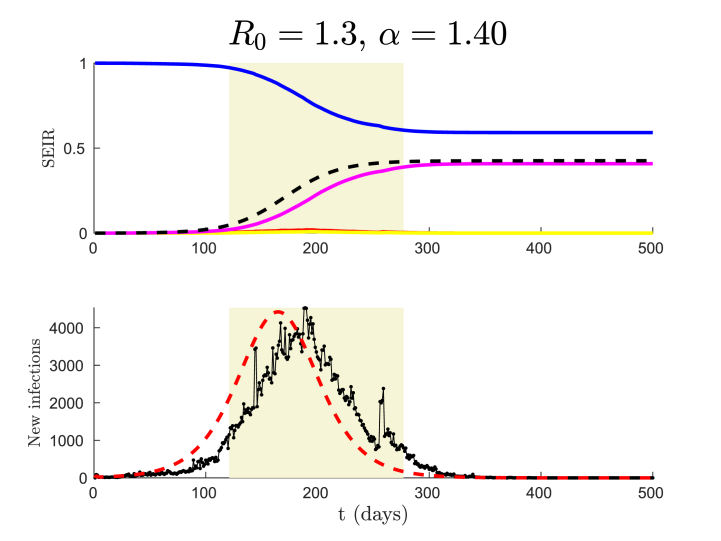
In stochastic modeling of infectious diseases, it has been established that variations in infectivity affect the probability of a major outbreak, but not the shape of the curves during a major outbreak, which is predicted by deterministic models (Diekmann et al., 2012). However, such conclusions are derived under idealized assumptions such as the population size tending to infinity, and the individual degree of infectivity only depending on variations in the infectiousness period. In this paper we show that the same conclusions hold true in a finite population representing a medium size city, where the degree of infectivity is determined by the offspring distribution, which we try to make as realistic as possible for SARS-CoV-2. In particular, we consider distributions with fat tails, to incorporate the existence of super-spreaders. We also provide new theoretical results on convergence of stochastic models which allows to incorporate any offspring distribution with a finite variance.

Keywords: COVID-19; Compartmental models; Offspring distribution for SARS-CoV-2; SEIR; SIR.


Conflict of interest statement

All authors declare no competing interests.

Figures

Fig. 1
Fig. 1
Probability distribution functions of the Generalised Pareto Distribution and the Negative Binomial Distribution for various coefficients used in this study.
Fig. 2
Fig. 2
Result of an epidemic simulation with our AB-model and the classical SEIR, both using R0 = 1.3. In the AB-model we used a Generalised Pareto Distribution with shape parameter α = 1.40. In the upper figure, solid lines display the output of the deterministic SEIR; with blue for Susceptible, red for Exposed, yellow for Infective and pink for Recovered. The dashed black curve displays the Recovered group in one fixed trial using the AB-model. The final values of the solid pink and dashed black curves are the cumulative number of infections, known as the final size of the epidemic and denoted by r(), for the classical SEIR and the AB-model respectively. In the lower figure, the number of daily new infections for one trial of the AB-model is shown in black and for the SEIR model in dashed red. The grey area is considered to capture the “epidemic wave” (for the AB-model), corresponding to values of R between 5% and 95% of r(). The width of this area then defines the “epidemic wave time” Twave.
Fig. 3
Fig. 3
Case (1). The epidemic features are well predicted by the classical SEIR, shown by red solid lines. The histogram in blue shows the results of 1000 simulations with the AB-model. Overbars, like Twave¯, denotes averages, and std denotes the standard deviation.
Fig. 4
Fig. 4
Case (2). A dichotomy appears, either the epidemic becomes self-extinct, or its features are relatively well predicted by the classical SEIR. We differentiate between the two kinds of outcomes by color coding, where blue refers to epidemics going self-extinct and orange refers to epidemics with r() near the deterministic value r.
Fig. 5
Fig. 5
Case (3). Most epidemics become self-extinct after infecting only a fraction of the population (minor outbreak).
Fig. 6
Fig. 6
By truncating we shift the expectation and hence the R0-value. However, we observe the same dichotomy as described in the previous section.
Fig. 7
Fig. 7
Comparisons of the different AB-models with the same parameters.

References

    1. Adam D.C., Wu P., Wong J.Y., Lau E.H., Tsang T.K., Cauchemez S., Leung G.M., Cowling B.J. Clustering and superspreading potential of SARS-CoV-2 infections in Hong Kong. Nature Medicine. 2020;26(11):1714–1719. - PubMed
    1. Andersson H., Britton T. Vol. 151. Springer Science & Business Media; 2012. (Stochastic epidemic models and their statistical analysis).
    1. Armbruster B., Beck E. Elementary proof of convergence to the mean-field model for the sir process. Journal of Mathematical Biology. 2017;75(2):327–339. - PubMed
    1. Bi Q., Wu Y., Mei S., Ye C., Zou X., Zhang Z., Liu X., Wei L., Truelove S.A., Zhang T., et al. The Lancet Infectious Diseases; 2020. Epidemiology and transmission of covid-19 in 391 cases and 1286 of their close contacts in shenzhen, China: A retrospective cohort study. - PMC - PubMed
    1. Blumberg S., Lloyd-Smith J.O. Inference of R0 and transmission heterogeneity from the size distribution of stuttering chains. PLoS Computational Biology. 2013;9(5) - PMC - PubMed

LinkOut - more resources