

Population dynamics of the Manyara monkey (Cercopithecus mitis manyaraensis) and vervet monkey (Chlorocebus pygerythrus) in Lake Manyara National Park, Tanzania
- PMID: 36267696
- PMCID: PMC9562685
- DOI: 10.5194/pb-9-33-2022
Population dynamics of the Manyara monkey (Cercopithecus mitis manyaraensis) and vervet monkey (Chlorocebus pygerythrus) in Lake Manyara National Park, Tanzania
Abstract
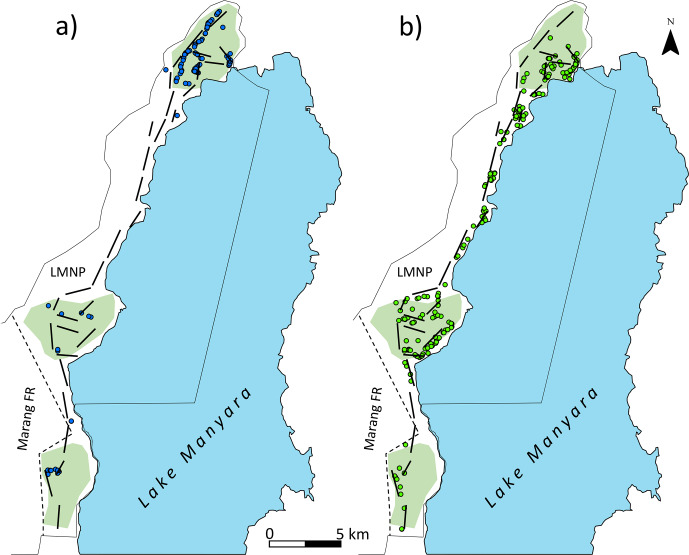
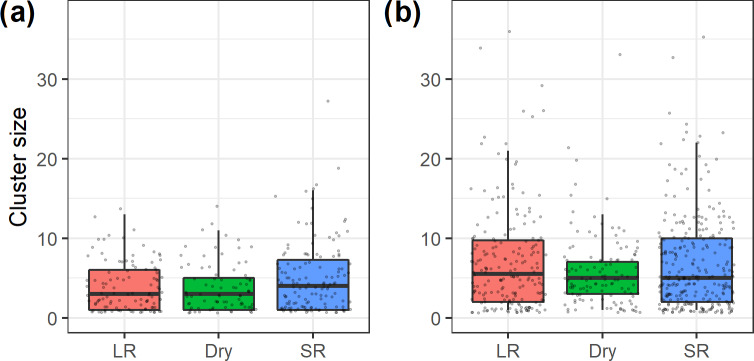
Estimating population densities and their trends over time is essential for understanding primate ecology and for guiding conservation efforts. From 2011 through to 2019, we counted two guenon species during seasonal road transect surveys in Lake Manyara National Park: the Tanzania-endemic Manyara monkey Cercopithecus mitis manyaraensis (International Union for Conservation of Nature and Natural Resources, IUCN, Red List category of "endangered") and the vervet monkey Chlorocebus pygerythrus (Red List category of "least concern"). To account for imperfect detectability, we analysed the data in a line distance sampling framework, fitted species-specific detection functions, and subsequently estimated seasonal densities. To test for seasonal differences and yearly trends in the species-specific density estimates, we fitted generalized additive models. Seasonal point density estimates fluctuated considerably during the 9 years (2011-2019) of our study, ranging from 3 to 29 individuals km for Manyara monkeys and from 19 to 83 individuals km for vervet monkeys. Densities of both taxa did not differ seasonally, and we did not detect marked directional population trends. Our study illustrates the utility and limitations of line distance sampling for long-term primate monitoring. Beyond informing primate ecology and management, our results highlight the conservation importance of Lake Manyara National Park for primate conservation.
Copyright: © 2022 Christian Kiffner et al.
Conflict of interest statement
At least one of the (co-)authors is a member of the editorial board of . The peer-review process was guided by an independent editor, and the authors also have no other competing interests to declare.
Figures


References
-
- Beaver JT, Harper CA, KisselJr RE, Muller LI, Basinger PS, Goode MJ, Van Manen FT, Winton W, Kennedy ML. Aerial vertical-looking infrared imagery to evaluate bias of distance sampling techniques for white-tailed deer. Wildl Soc Bull. 2014;38:419–427. doi: 10.1002/wsb.410. - DOI
-
- Bourlière F. Primate communities: Their structure and role in tropical ecosystems. Int J Primatol. 1985;6:1–26. doi: 10.1007/BF02693694. - DOI
-
- Buckland ST, Anderson DR, Burnham KP, Laake JL, Borchers DL. Introduction to Distance Sampling. Estimating Abundance of Biological Populations. Oxford University Press; Oxford, UK: 2001.
-
- Butynski TM. Comparative ecology of blue monkeys (Cercopithecus mitis) in high- and low-density subpopulations. Ecol Monogr. 1990;60:1–26. doi: 10.2307/1943024. - DOI
LinkOut - more resources
Full Text Sources