. 2022 Sep;10(18):1021.
doi: 10.21037/atm-22-4546.

The cuproptosis-related gene signature serves as a potential prognostic predictor for ovarian cancer using bioinformatics analysis

Affiliations

The cuproptosis-related gene signature serves as a potential prognostic predictor for ovarian cancer using bioinformatics analysis

Xin Sun et al. Ann Transl Med. 2022 Sep.

Abstract

Background: Studies have shown that copper is involved in the tumorigenesis and development of ovarian cancer. In this work, we aimed to build a prognostic classification system associated with cuproptosis to predict ovarian cancer prognosis.

Methods: Information of ovarian cancer samples were acquired from The Cancer Genome Atlas (TCGA)-ovarian cancer and GSE26193 dataset. Cuproptosis-related genes were screened from previous research. ConsensusClusterPlus was applied to determine molecular subtypes, which were evaluated by tumor immune microenvironment analysis, TIDE algorithm, and functional enrichment analysis. Furthermore, limma analysis and univariate Cox analysis were used to construct a cuproptosis-related prognostic signature for ovarian cancer. Univariate and multivariate Cox regression analyses were used to analyze the independence of clinical factors and model.

Results: A total of 15 genes related to cuproptosis were identified, and 2 clusters (C1 and C2) were determined. C1 had a better survival outcome, less advanced stage, enhanced immune infiltration, was more sensitive to immunotherapy, and showed enrichment in tricarboxylic acid (TCA)-related pathways. An 8 cuproptosis-associated gene signature was constructed, and the signature was verified in the GSE26193 dataset. A higher risk score of the cuproptosis-related gene signature was significantly correlated with worse overall survival (OS) (P<0.0001), which was validated in GSE26193 dataset successfully. Cox survival analysis showed that risk score was an independent predictor [hazard ratio (HR) =2.66, P<0.001]. Functional enrichment and tumor immune microenvironment analyses showed that high-risk patients tended to have immunologically sensitive tumors.

Conclusions: The cuproptosis-related gene signature may serve as a potential prognostic predictor for ovarian cancer patients and may offer novel treatment strategies for ovarian cancer.

Keywords: Ovarian cancer; clusters; cuproptosis; prognosis; signature.


Conflict of interest statement

Conflicts of Interest: All authors have completed the ICMJE uniform disclosure form (available at https://atm.amegroups.com/article/view/10.21037/atm-22-4546/coif). The authors have no conflicts of interest to declare.

Figures
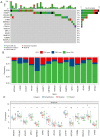
Figure 1
Figure 1
Mutation analysis of genes associated with cuproptosis. (A) Mutation frequency of genes in TCGA-ovarian cancer samples. (B) Copy number variations of genes. (C) Gene expression in the amplification group, deletion group, and diploid group. *P<0.05; **P<0.01; ***P<0.001; ****P<0.0001. TMB, tumor mutation burden; CNV, copy number variation; TCGA, The Cancer Genome Atlas; ns, no significance.
Figure 2
Figure 2
Identification of clusters. (A) Heatmap of clustering when k=2. (B) Cumulative distribution function curve. (C) Cumulative distribution function delta area. (D) KM survival curve between cluster 1 and cluster 2 in TCGA-ovarian cancer dataset. (E) KM survival curve between cluster 1 and cluster 2 in the GSE26193 dataset. CDF, cumulative distribution function; TCGA, The Cancer Genome Atlas; KM, Kaplan-Meier.
Figure 3
Figure 3
The distributions of clinical features, stage, grade, age, and status in the 2 clusters. *P<0.05.
Figure 4
Figure 4
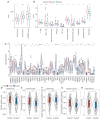
Analysis of the tumor immune microenvironment. (A) The differences in stromal score, immune score, and ESTIMATE score between the 2 clusters. (B) The differences in the scores of 10 kinds of immune cells between the 2 clusters. (C) The expression levels of immune checkpoint genes between the 2 clusters. (D-G) Score differences of the Toll-like receptor signaling pathway, natural killer cell-mediated cytotoxicity, antigen processing and presentation, and the B cell receptor signaling pathway between the 2 clusters. (H) CYT score differences between the 2 clusters. *P<0.05; **P<0.01; ***P<0.001; ****P<0.0001. ns, no significance; ESTIMATE, Estimation of Stromal and Immune cells in Malignant Tumors using Expression data; NK, natural killer; CYT, cytolytic activity.
Figure 5
Figure 5
Functional enrichment analysis. (A) GSEA showed that many cancer-related pathways were activated in C1. (B) TCA-related pathway scores presented differences between the 2 clusters. (C) Score differences of pathways involved in cell growth and death between the 2 clusters. **P<0.01; ***P<0.001; ****P<0.0001. TCGA, The Cancer Genome Atlas; ns, no significance; GSEA, gene set enrichment analysis; TCA, tricarboxylic acid; ECM, extracellular matrix.
Figure 6
Figure 6
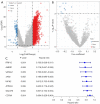
Identification of hub genes associated with cuproptosis. (A) Volcano plot of differentially expressed genes between the 2 clusters. (B) Volcano plot of 8 potential candidate genes. (C) Forest plot of 8 genes based on univariate Cox regression. FDR, false discovery rate.
Figure 7
Figure 7
Validation of the risk score. (A) ROC curve of the risk score in TCGA-ovarian cancer dataset. (B) KM survival curve between the high group and low group in TCGA-ovarian cancer dataset. (C) ROC curve of the risk score in the GSE26193 dataset. (D) KM survival curve between the high group and low group in the GSE26193 dataset. AUC, area under the curve; CI, confidence interval; TCGA, The Cancer Genome Atlas; ROC, receiver operating characteristic; KM, Kaplan-Meier.
Figure 8
Figure 8
The distributions of clinical features, stage, grade, age, and status in the high group and low group. ***P<0.001; ****P<0.0001. ns, no significance.
Figure 9
Figure 9
Independent prognostic ability of the risk score. (A) Univariate Cox survival analysis. (B) Multivariate Cox survival analysis. CI, confidence interval; HR, hazard ratio.
Figure 10
Figure 10
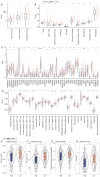
Analysis of the tumor immune microenvironment. (A) The differences in stromal score, immune score, and ESTIMATE score between the high group and low group. (B) The differences in scores of 10 kinds of immune cells between the high group and low group. (C) The expression levels of immune checkpoint genes between the high group and low group. (D) The differences in scores of 28 kinds of immune cells between the high group and low group. (E-G) Score differences of the Toll-like receptor signaling pathway, natural killer cell mediated cytotoxicity, and antigen processing and presentation between the high group and low group. (H) CYT score differences between the high group and low group. *P<0.05; **P<0.01; ***P<0.001; ****P<0.0001. ns, no significance; ESTIMATE, Estimation of Stromal and Immune cells in Malignant Tumors using Expression data; CYT, cytolytic activity; NK, natural killer.
Figure 11
Figure 11
TCA pathway analysis of the risk score. (A) TCA-related pathway scores had significantly differences between the 2 groups. (B) Heatmap analysis indicated that the high group had higher TCA pathway scores. (C) TCA score was positively correlated with risk score. ****P<0.0001. ns, no significance; TCA, tricarboxylic acid; GSVA, gene set variation analysis.

References

    1. Sung H, Ferlay J, Siegel RL, et al. Global Cancer Statistics 2020: GLOBOCAN Estimates of Incidence and Mortality Worldwide for 36 Cancers in 185 Countries. CA Cancer J Clin 2021;71:209-49. 10.3322/caac.21660 - DOI - PubMed
    1. Chen W, Zheng R, Baade PD, et al. Cancer statistics in China, 2015. CA Cancer J Clin 2016;66:115-32. 10.3322/caac.21338 - DOI - PubMed
    1. Moss HA, Berchuck A, Neely ML, et al. Estimating Cost-effectiveness of a Multimodal Ovarian Cancer Screening Program in the United States: Secondary Analysis of the UK Collaborative Trial of Ovarian Cancer Screening (UKCTOCS). JAMA Oncol 2018;4:190-5. 10.1001/jamaoncol.2017.4211 - DOI - PMC - PubMed
    1. Kajiyama H, Shibata K, Mizuno M, et al. Long-term survival of young women receiving fertility-sparing surgery for ovarian cancer in comparison with those undergoing radical surgery. Br J Cancer 2011;105:1288-94. 10.1038/bjc.2011.394 - DOI - PMC - PubMed
    1. Arredondo M, Núñez MT. Iron and copper metabolism. Mol Aspects Med 2005;26:313-27. 10.1016/j.mam.2005.07.010 - DOI - PubMed