. 2022 Sep 14;2(9):100162.
doi: 10.1016/j.xgen.2022.100162. Epub 2022 Jul 26.

Identification of risk genes for Alzheimer's disease by gene embedding

Affiliations

Identification of risk genes for Alzheimer's disease by gene embedding

Yashwanth Lagisetty et al. Cell Genom. .

Abstract

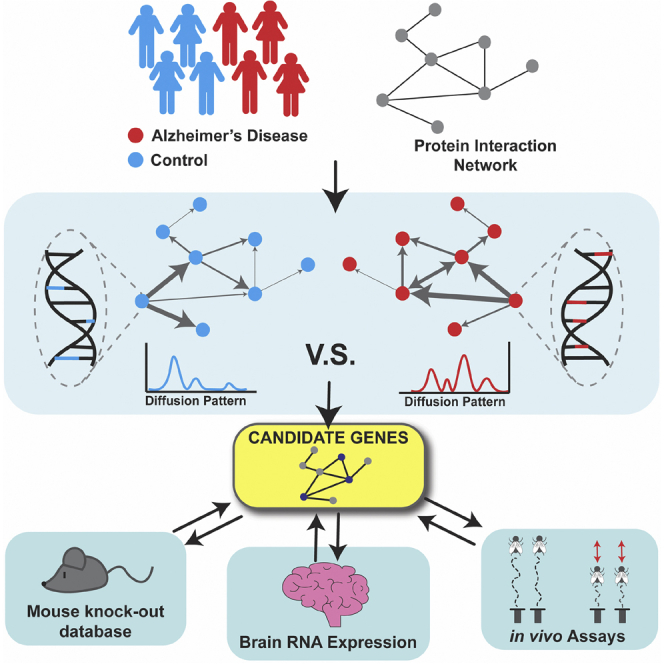
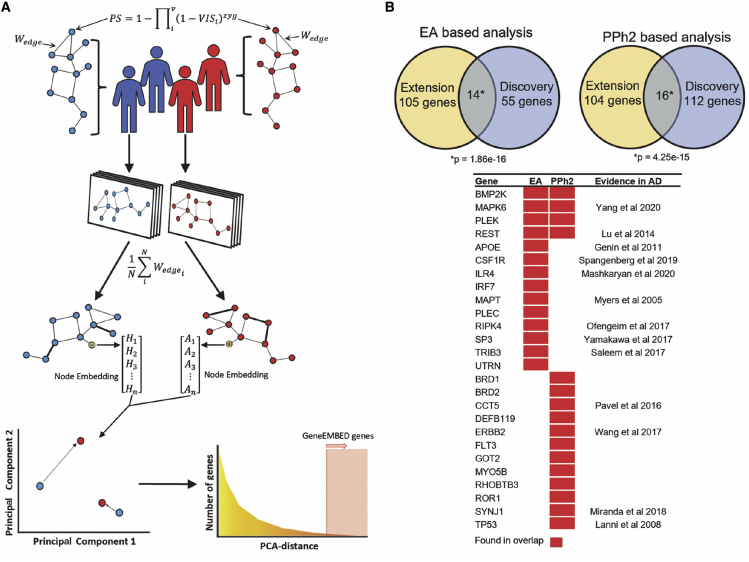
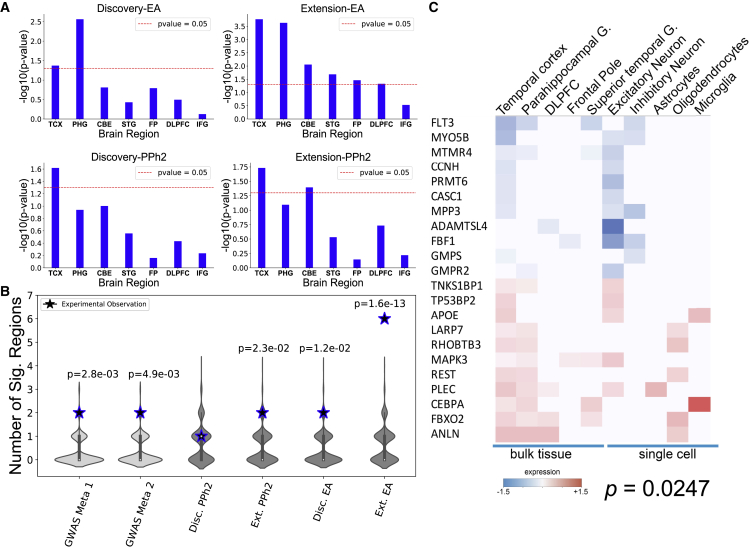
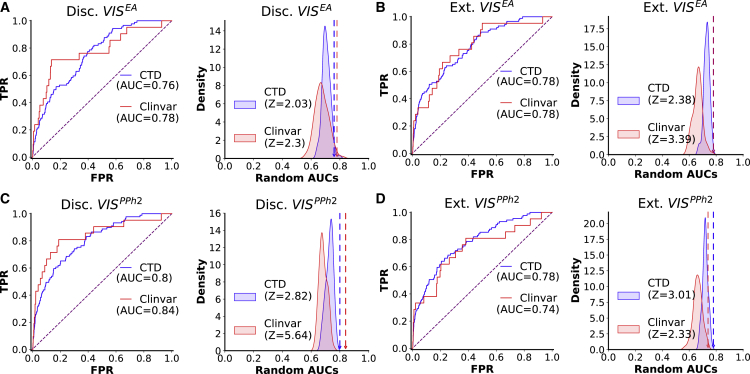
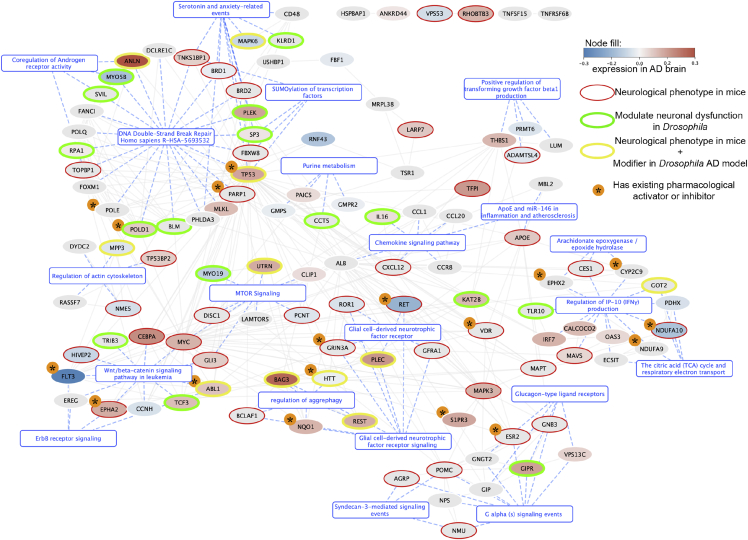
Most disease-gene association methods do not account for gene-gene interactions, even though these play a crucial role in complex, polygenic diseases like Alzheimer's disease (AD). To discover new genes whose interactions may contribute to pathology, we introduce GeneEMBED. This approach compares the functional perturbations induced in gene interaction network neighborhoods by coding variants from disease versus healthy subjects. In two independent AD cohorts of 5,169 exomes and 969 genomes, GeneEMBED identified novel candidates. These genes were differentially expressed in post mortem AD brains and modulated neurological phenotypes in mice. Four that were differentially overexpressed and modified neurodegeneration in vivo are PLEC, UTRN, TP53, and POLD1. Notably, TP53 and POLD1 are involved in DNA break repair and inhibited by approved drugs. While these data show proof of concept in AD, GeneEMBED is a general approach that should be broadly applicable to identify genes relevant to risk mechanisms and therapy of other complex diseases.


Conflict of interest statement

DECLARATION OF INTERESTS The authors declare no competing interests.

Figures

None
Graphical abstract
Figure 1
Figure 1
Overview of GeneEMBED and AD candidate genes (A) GeneEMBED: for an individual, genes are first assigned a perturbation score (PS) consolidating information from all the gene’s variants appearing in the individual. The gene PS estimates the total loss of function probability given various combinations of variant level loss-of-function probabilities. Edge weights for an individual’s network are calculated by the sum of the PS of the connected genes. Edge weights are then averaged over to construct one case specific and one control specific graph. Node embedding is performed on the genes in the two networks. Finally, embeddings are projected in a PCA space to measure distances between nodes in case and control networks. (B) GeneEMBED using EA identified 69 candidate genes in Discovery and 119 in Extension with 14 overlapping genes, significant by one-tailed hypergeometric test. In PPh2 analyses, 128 candidate genes were found in Discovery and 120 in Extension with 16 overlapping genes, significant by one-tailed hypergeometric test. A large portion of overlapping genes have been previously implicated in AD biology.
Figure 2
Figure 2
GeneEMBED candidates are differentially expressed in AD brain tissue (A) One-tailed hypergeometric enrichment of GeneEMBED candidates against differentially expressed genes from seven brain regions: cerebellum (CBE), temporal cortex (TCX), frontal pole (FP), inferior frontal gyrus (IFG), parahippocampal gyrus (PHG), superior temporal cortex (STG), and dorsolateral prefrontal cortex (DLPFC). (B) Comparison of RNA-sequencing-based enrichment between known AD gene sets and GeneEMBED candidates. Stars indicate the number of brain regions with significant enrichment in each gene set by permutation testing. Violin plot shows the distribution of expected number of enriched brain regions when using random gene sets. (C) Among the 143 high-confidence genes, a significant number (22; one-tailed Fisher’s exact test; p = 0.0247) showed differential expression in both bulk tissue from various brain regions and in single-cell sequencing of neuronal cell types.
Figure 3
Figure 3
GeneEMBED candidates are significantly related to curated sets of AD genes (A) Receiver operator characteristic curves are shown for Disc. VISEA for network diffusion to CTD and ClinVar AD gene sets. To determine significance of observed area under the curve (AUC), a permutation testing strategy is used wherein random gene sets of the same size are generated 100 times and analyzed through nDiffusion to create a random distribution of AUCs. Reported Z-scores are calculated relative to these backgrounds. y axis of the ROC plots are true positive rates (TPRs), and x axis is false-positive rate (FPR). Similarly, y axis of the Z score distribution is probability density, and x axis is the AUROC score of random gene sets. (B–D) Analogous plots are shown for (B) Ext VISEA, (C) Disc VISPPh2, and (D) Ext VISPPh2.
Figure 4
Figure 4
Interaction network among 143 high-confidence genes Network is built using STRING edges. Nodes are colored based on their differential log2 fold change expression in AD brains. Red rings around genes indicate that they were reported in MGI to have abnormal neurological phenotype when knocked out. Green rings indicate that the gene was observed to modify AD phenotype in in vivo experiments on AD Drosophila models. Yellow rings indicate genes that were observed to both modify AD phenotype in Drosophila models and have reported abnormal neurological phenotype in knockout (KO) mouse models in MGI. Genes with asterisk next to them are those that have pre-existing FDA-approved pharmacological activator or inhibitors, indicating potential targets for drug-repurposing studies.

References

    1. Knopman D.S., Amieva H., Petersen R.C., Chételat G., Holtzman D.M., Hyman B.T., Nixon R.A., Jones D.T. Alzheimer disease. Nat. Rev. Dis. Primers. 2021;7:33. - PMC - PubMed
    1. Hebert L.E., Weuve J., Scherr P.A., Evans D.A. Alzheimer disease in the United States (2010-2050) estimated using the 2010 census. Neurology. 2013;80:1778–1783. - PMC - PubMed
    1. Gatz M., Pedersen N.L., Berg S., Johansson B., Johansson K., Mortimer J.A., Posner S.F., Viitanen M., Winblad B., Ahlbom A. Heritability for Alzheimer’s disease: the study of dementia in Swedish twins. J. Gerontol. A Biol. Sci. Med. Sci. 1997;52:M117–M125. - PubMed
    1. Guerreiro R., Escott-Price V., Darwent L., Parkkinen L., Ansorge O., Hernandez D.G., Nalls M.A., Clark L., Honig L., Marder K., et al. Genome-wide analysis of genetic correlation in dementia with Lewy bodies, Parkinson’s and Alzheimer’s diseases. Neurobiol. Aging. 2016;38:214.e7–214.e10. - PMC - PubMed
    1. Kunkle B.W., Grenier-Boley B., Sims R., Bis J.C., Damotte V., Naj A.C., Boland A., Vronskaya M., van der Lee S.J., Amlie-Wolf A., et al. Genetic meta-analysis of diagnosed Alzheimer’s disease identifies new risk loci and implicates Aβ, tau, immunity and lipid processing. Nat. Genet. 2019;51:414–430. - PMC - PubMed