. 2022 Nov 22;146(21):1610-1626.
doi: 10.1161/CIRCULATIONAHA.121.057329. Epub 2022 Oct 21.

Defective Desmosomal Adhesion Causes Arrhythmogenic Cardiomyopathy by Involving an Integrin-αVβ6/TGF-β Signaling Cascade

Affiliations

Defective Desmosomal Adhesion Causes Arrhythmogenic Cardiomyopathy by Involving an Integrin-αVβ6/TGF-β Signaling Cascade

Camilla Schinner et al. Circulation. .

Abstract

Background: Arrhythmogenic cardiomyopathy (ACM) is characterized by progressive loss of cardiomyocytes with fibrofatty tissue replacement, systolic dysfunction, and life-threatening arrhythmias. A substantial proportion of ACM is caused by mutations in genes of the desmosomal cell-cell adhesion complex, but the underlying mechanisms are not well understood. In the current study, we investigated the relevance of defective desmosomal adhesion for ACM development and progression.

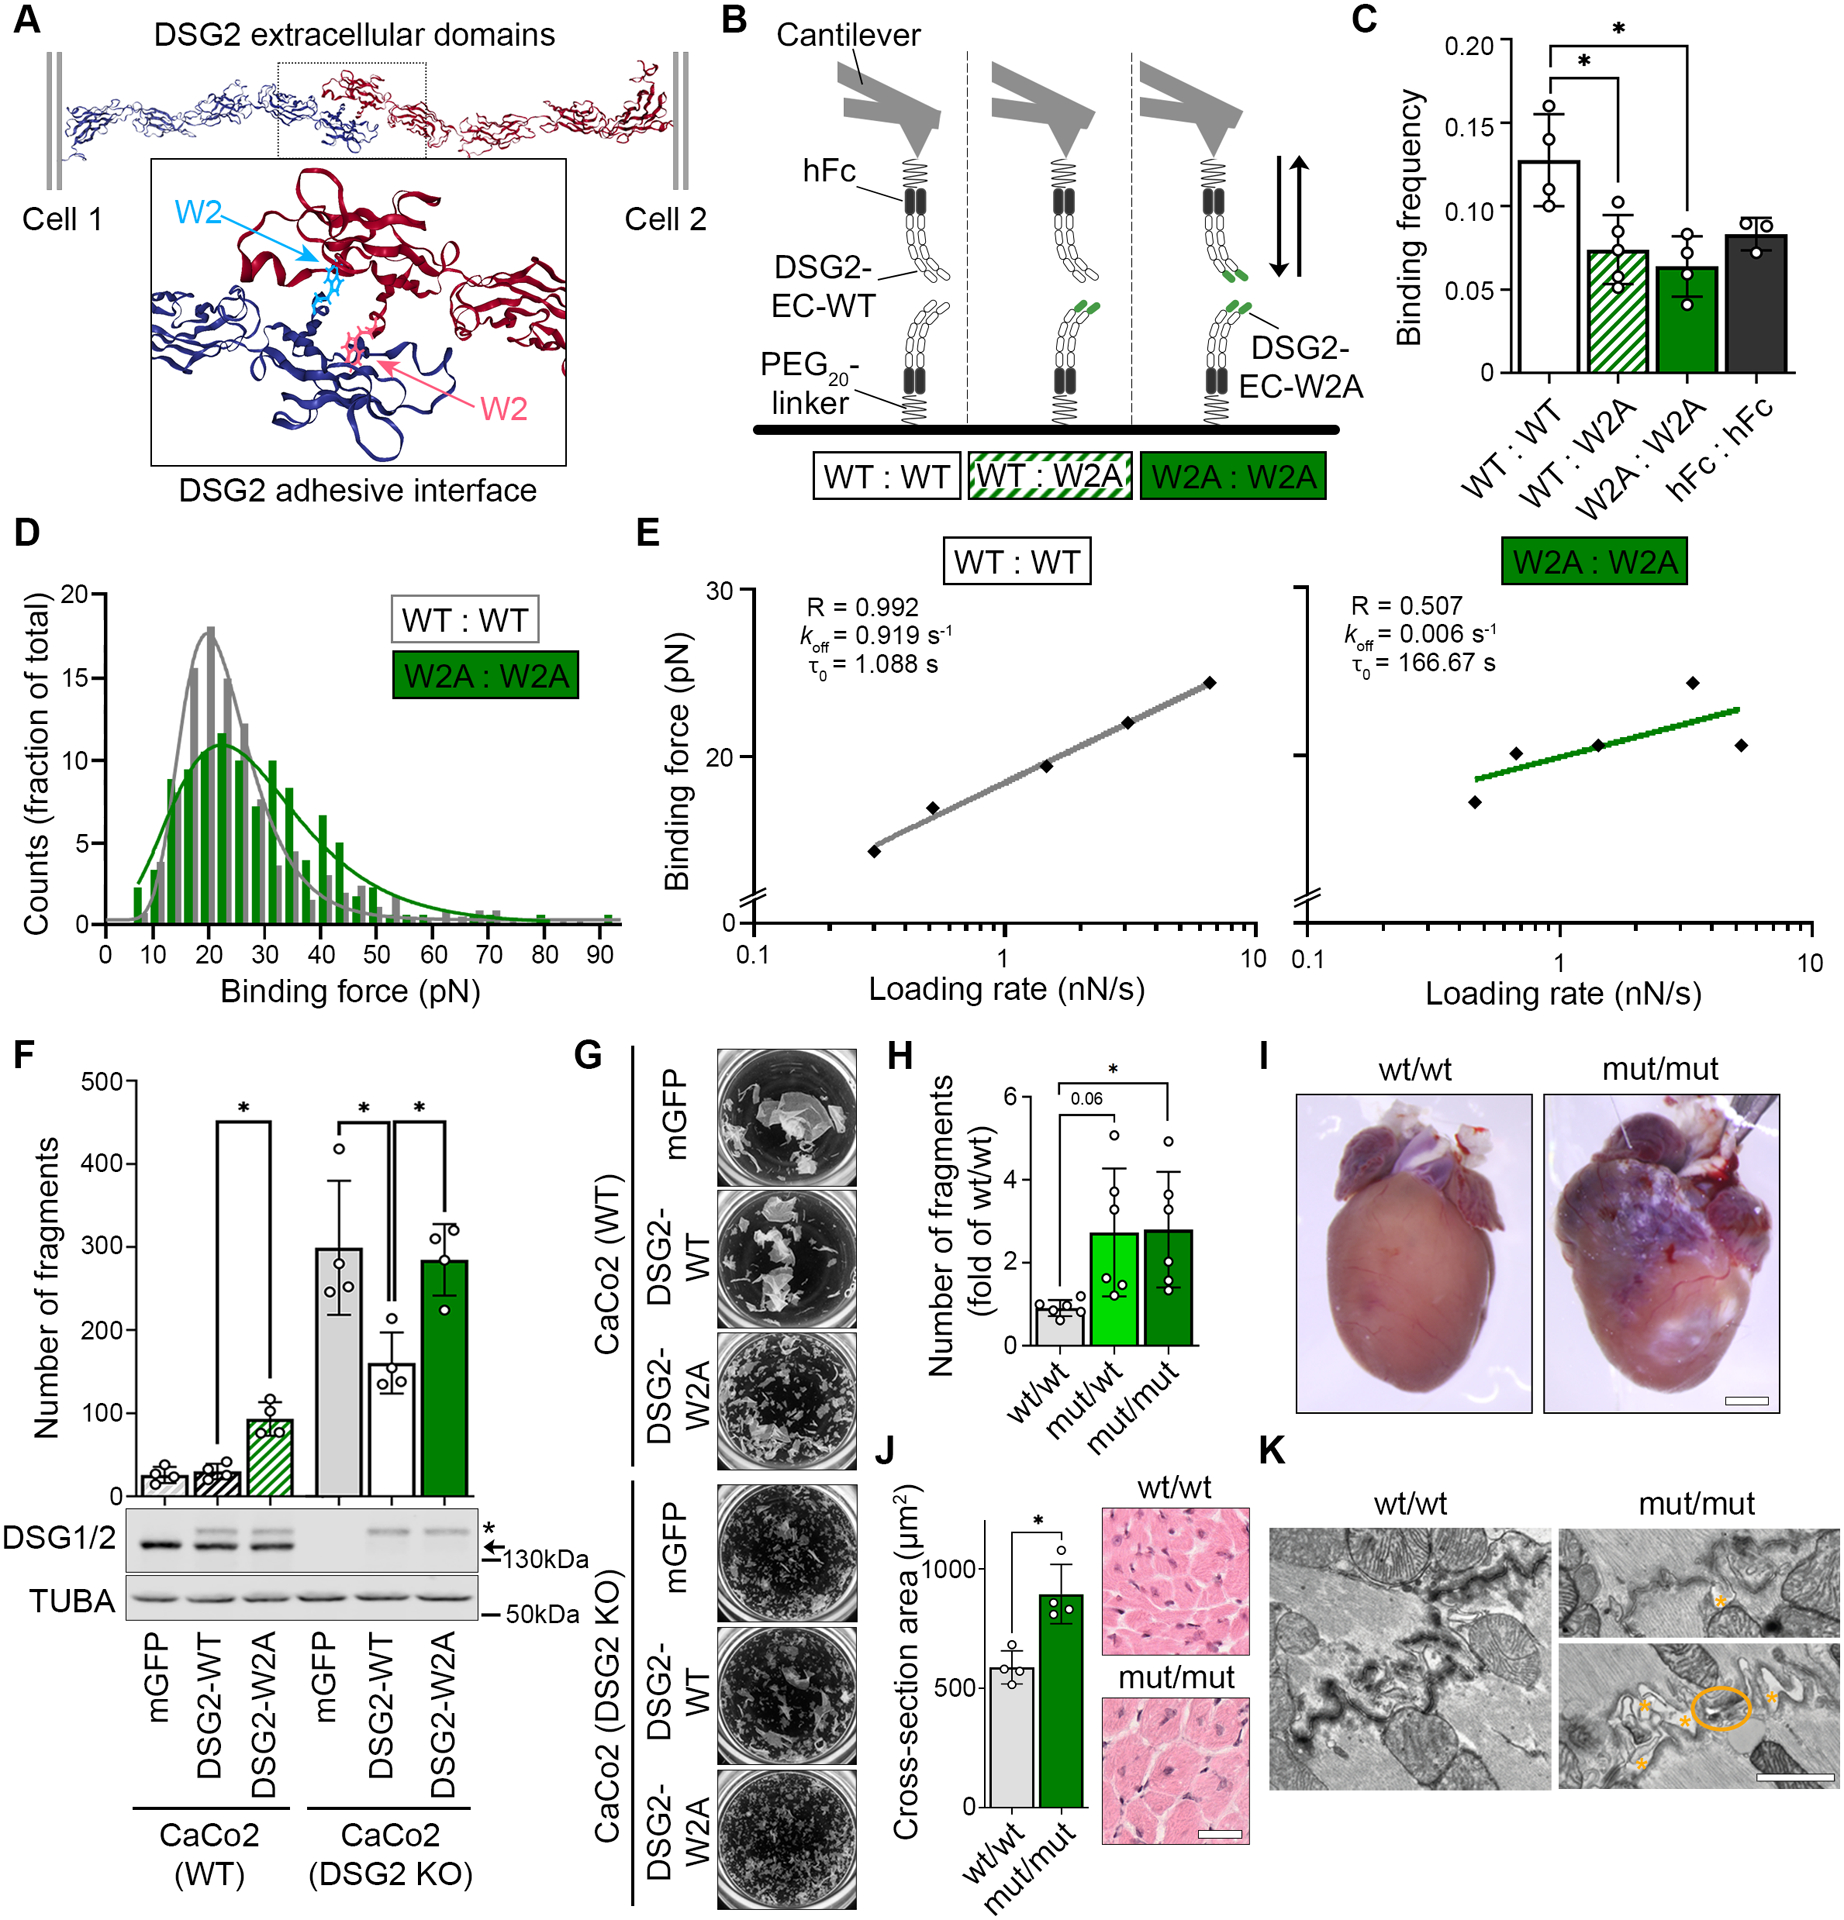
Methods: We mutated the binding site of DSG2 (desmoglein-2), a crucial desmosomal adhesion molecule in cardiomyocytes. This DSG2-W2A mutation abrogates the tryptophan swap, a central interaction mechanism of DSG2 on the basis of structural data. Impaired adhesive function of DSG2-W2A was confirmed by cell-cell dissociation assays and force spectroscopy measurements by atomic force microscopy. The DSG2-W2A knock-in mouse model was analyzed by echocardiography, ECG, and histologic and biomolecular techniques including RNA sequencing and transmission electron and superresolution microscopy. The results were compared with ACM patient samples, and their relevance was confirmed in vivo and in cardiac slice cultures by inhibitor studies applying the small molecule EMD527040 or an inhibitory integrin-αVβ6 antibody.

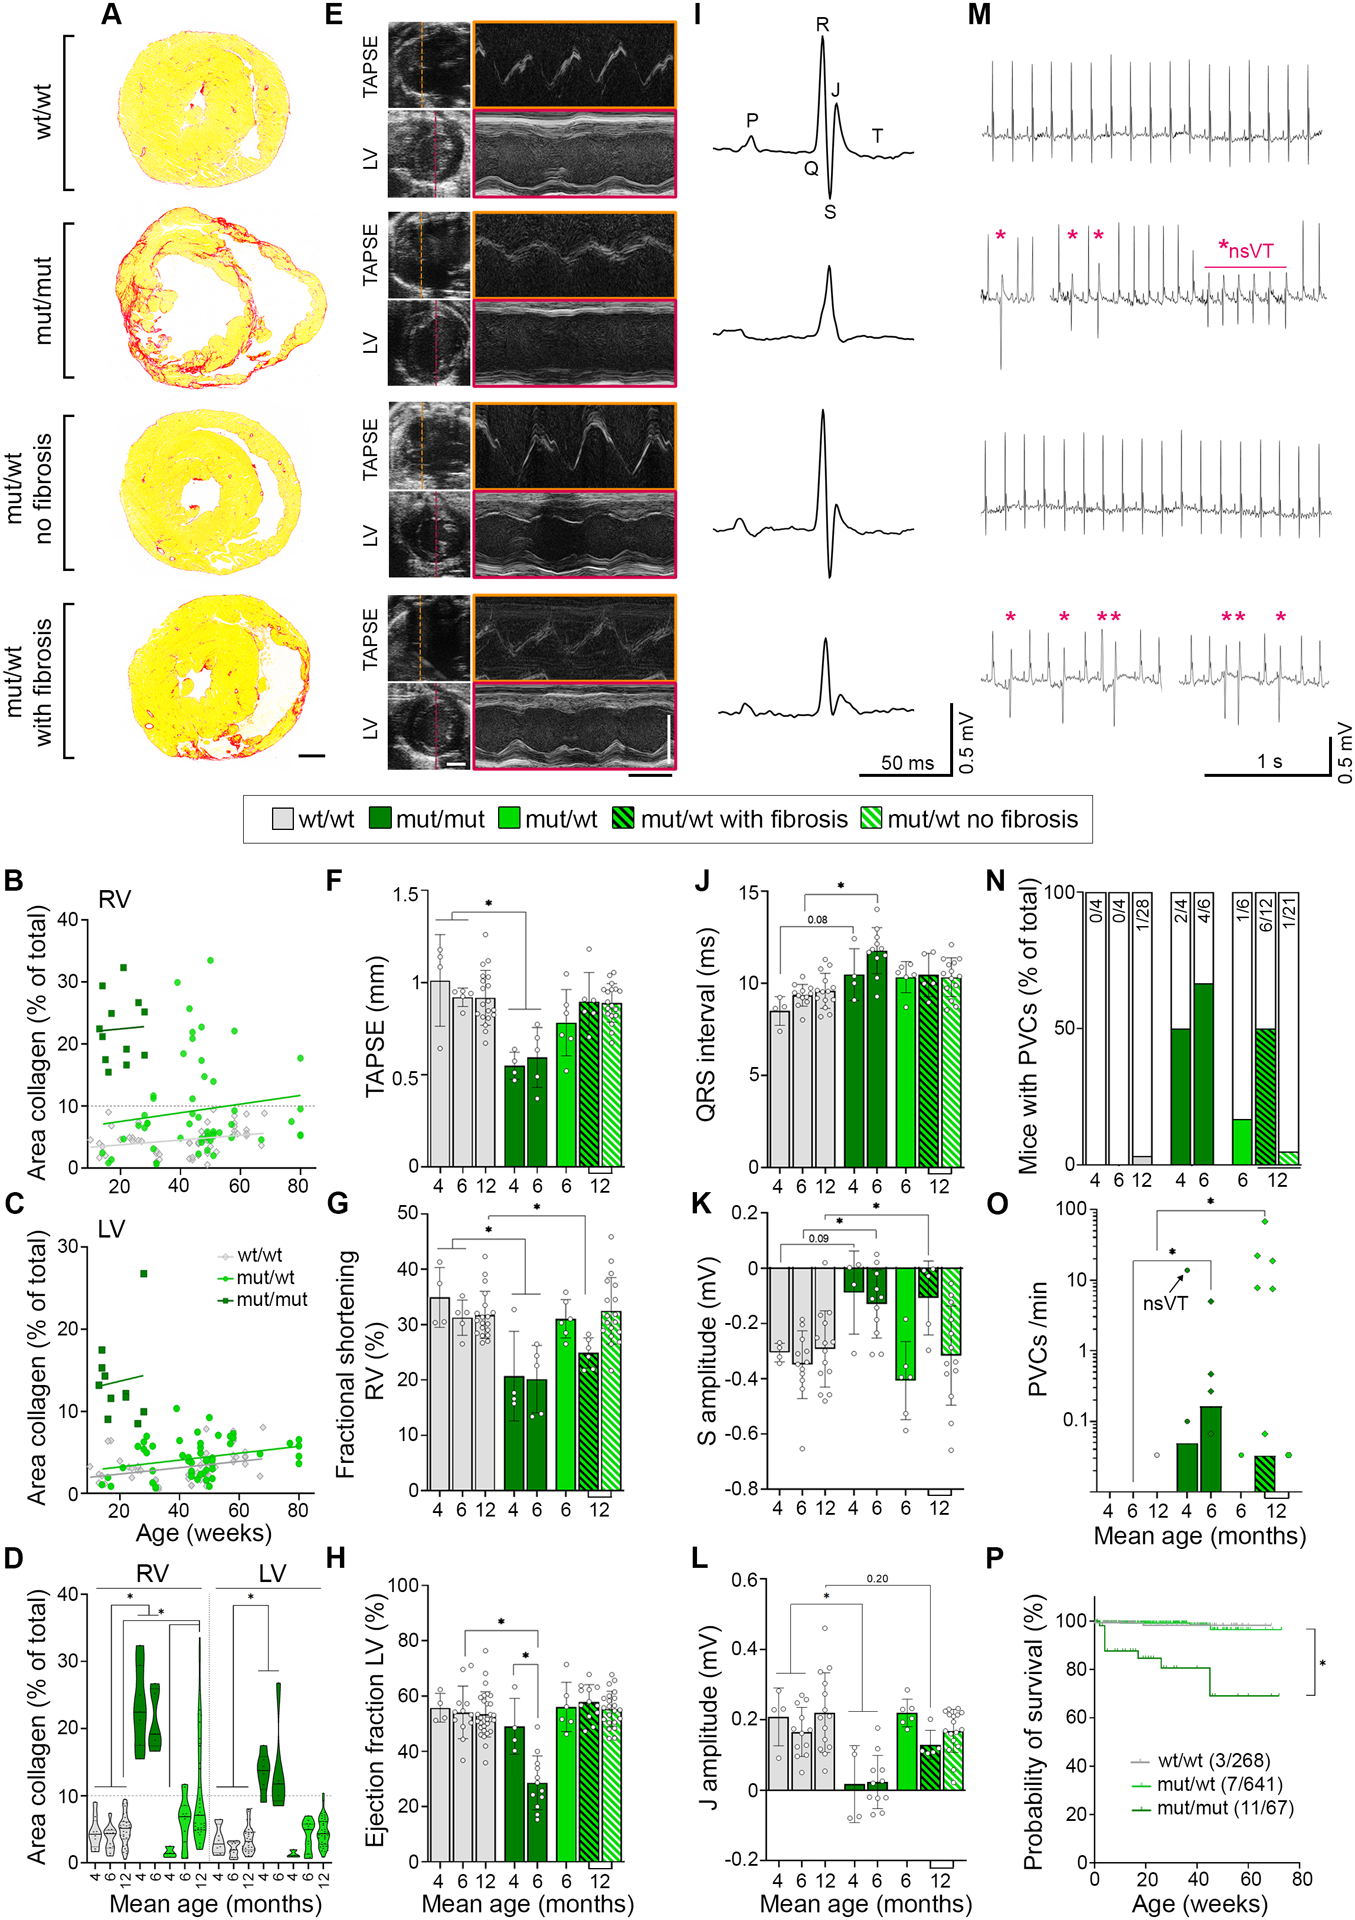
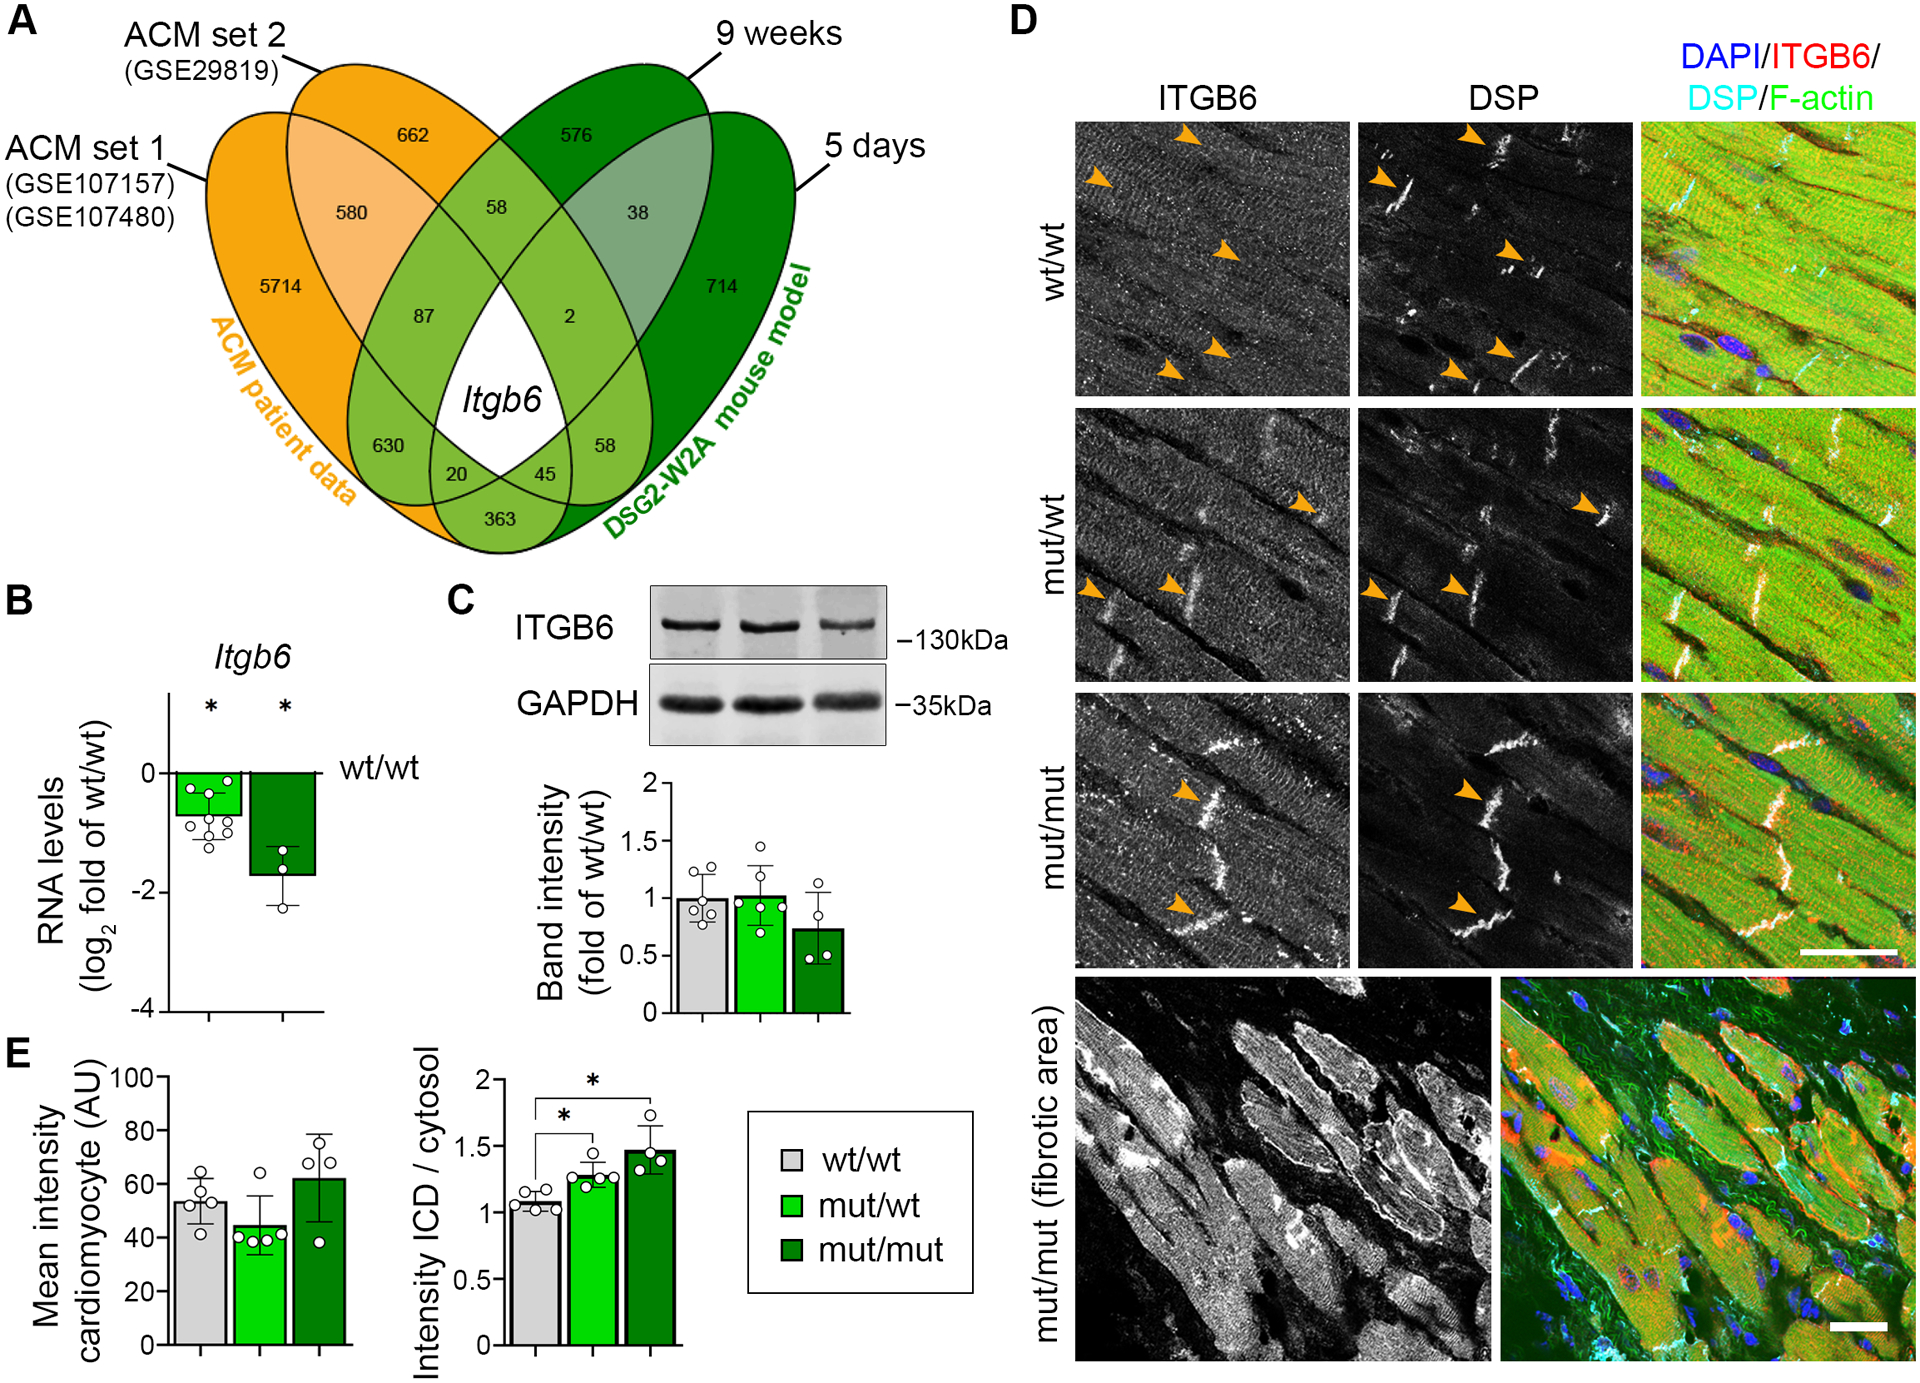
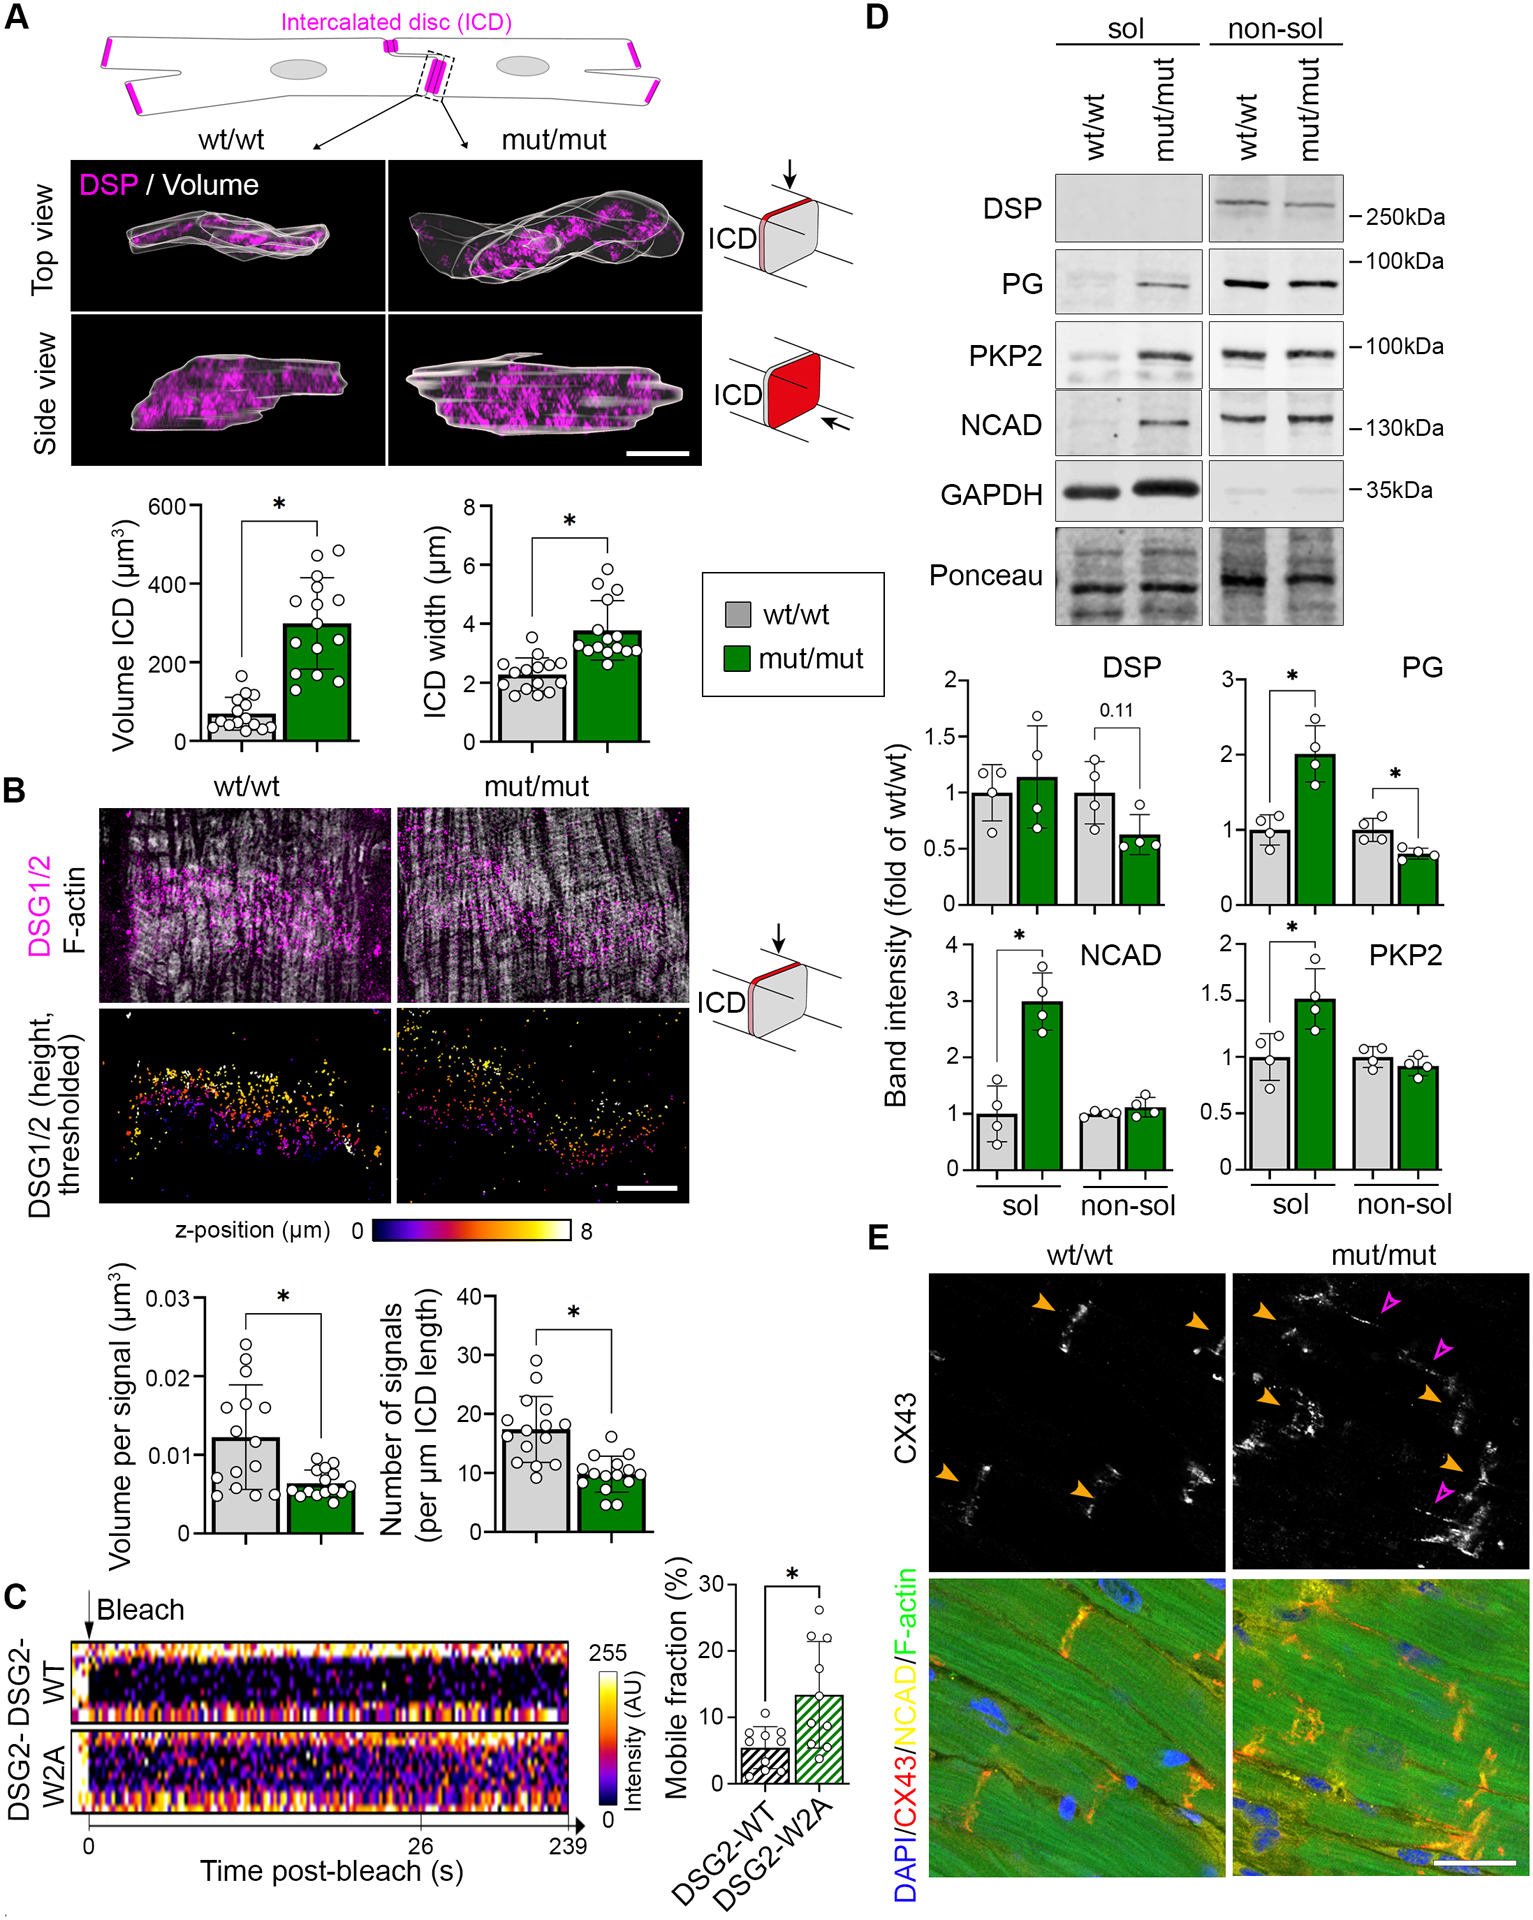
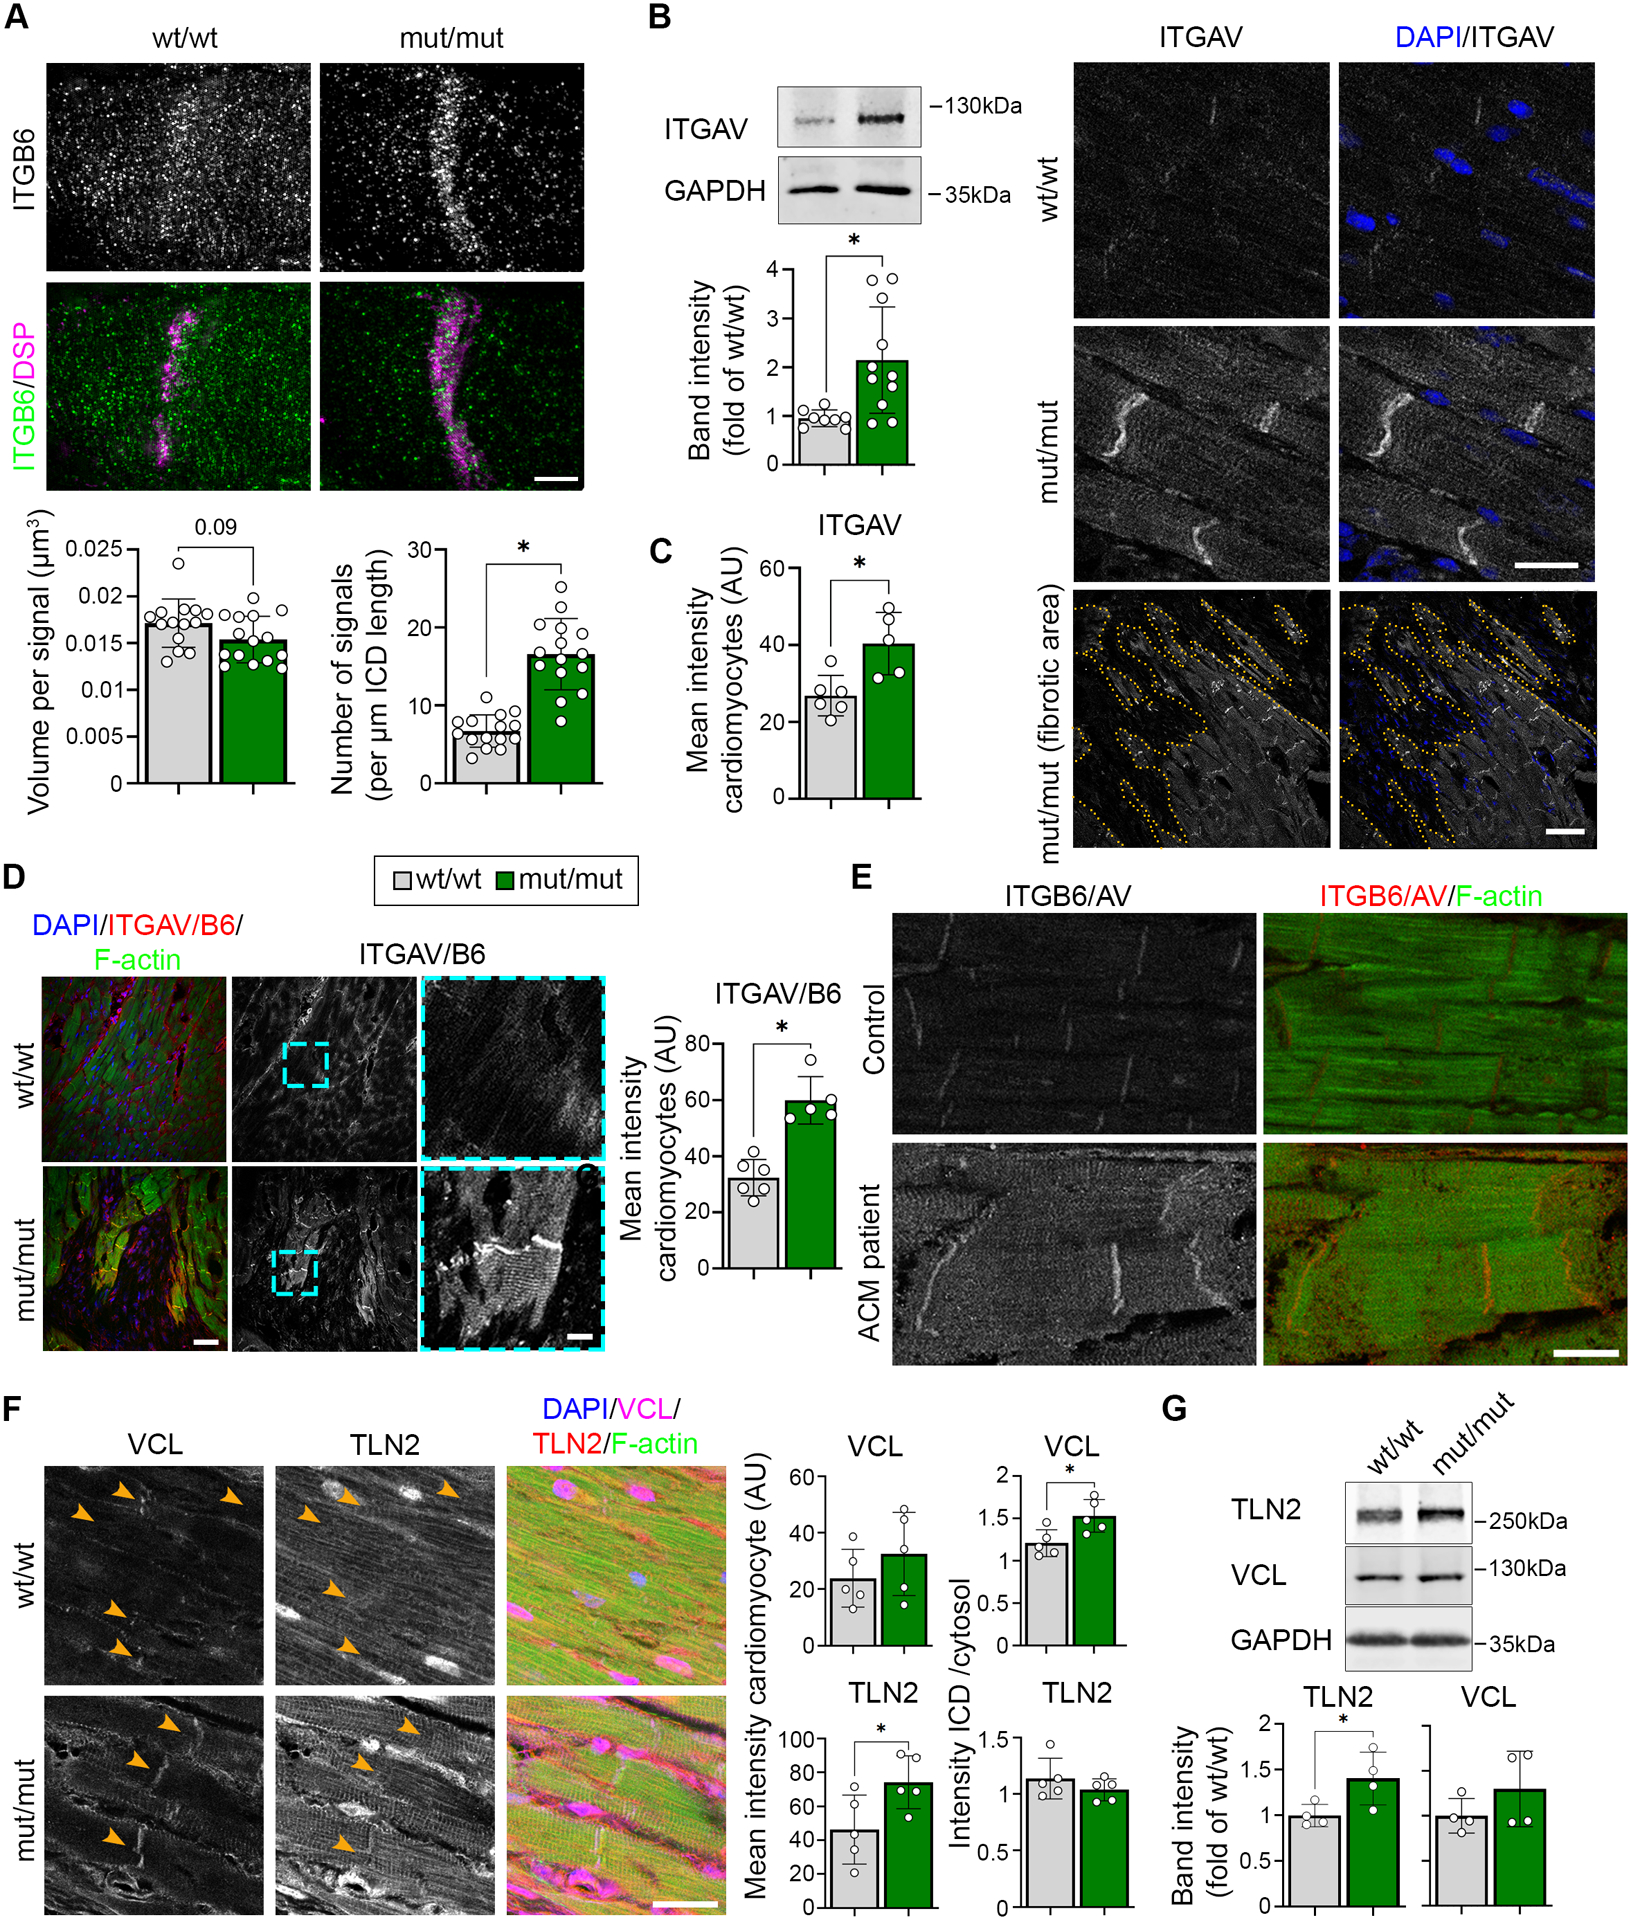
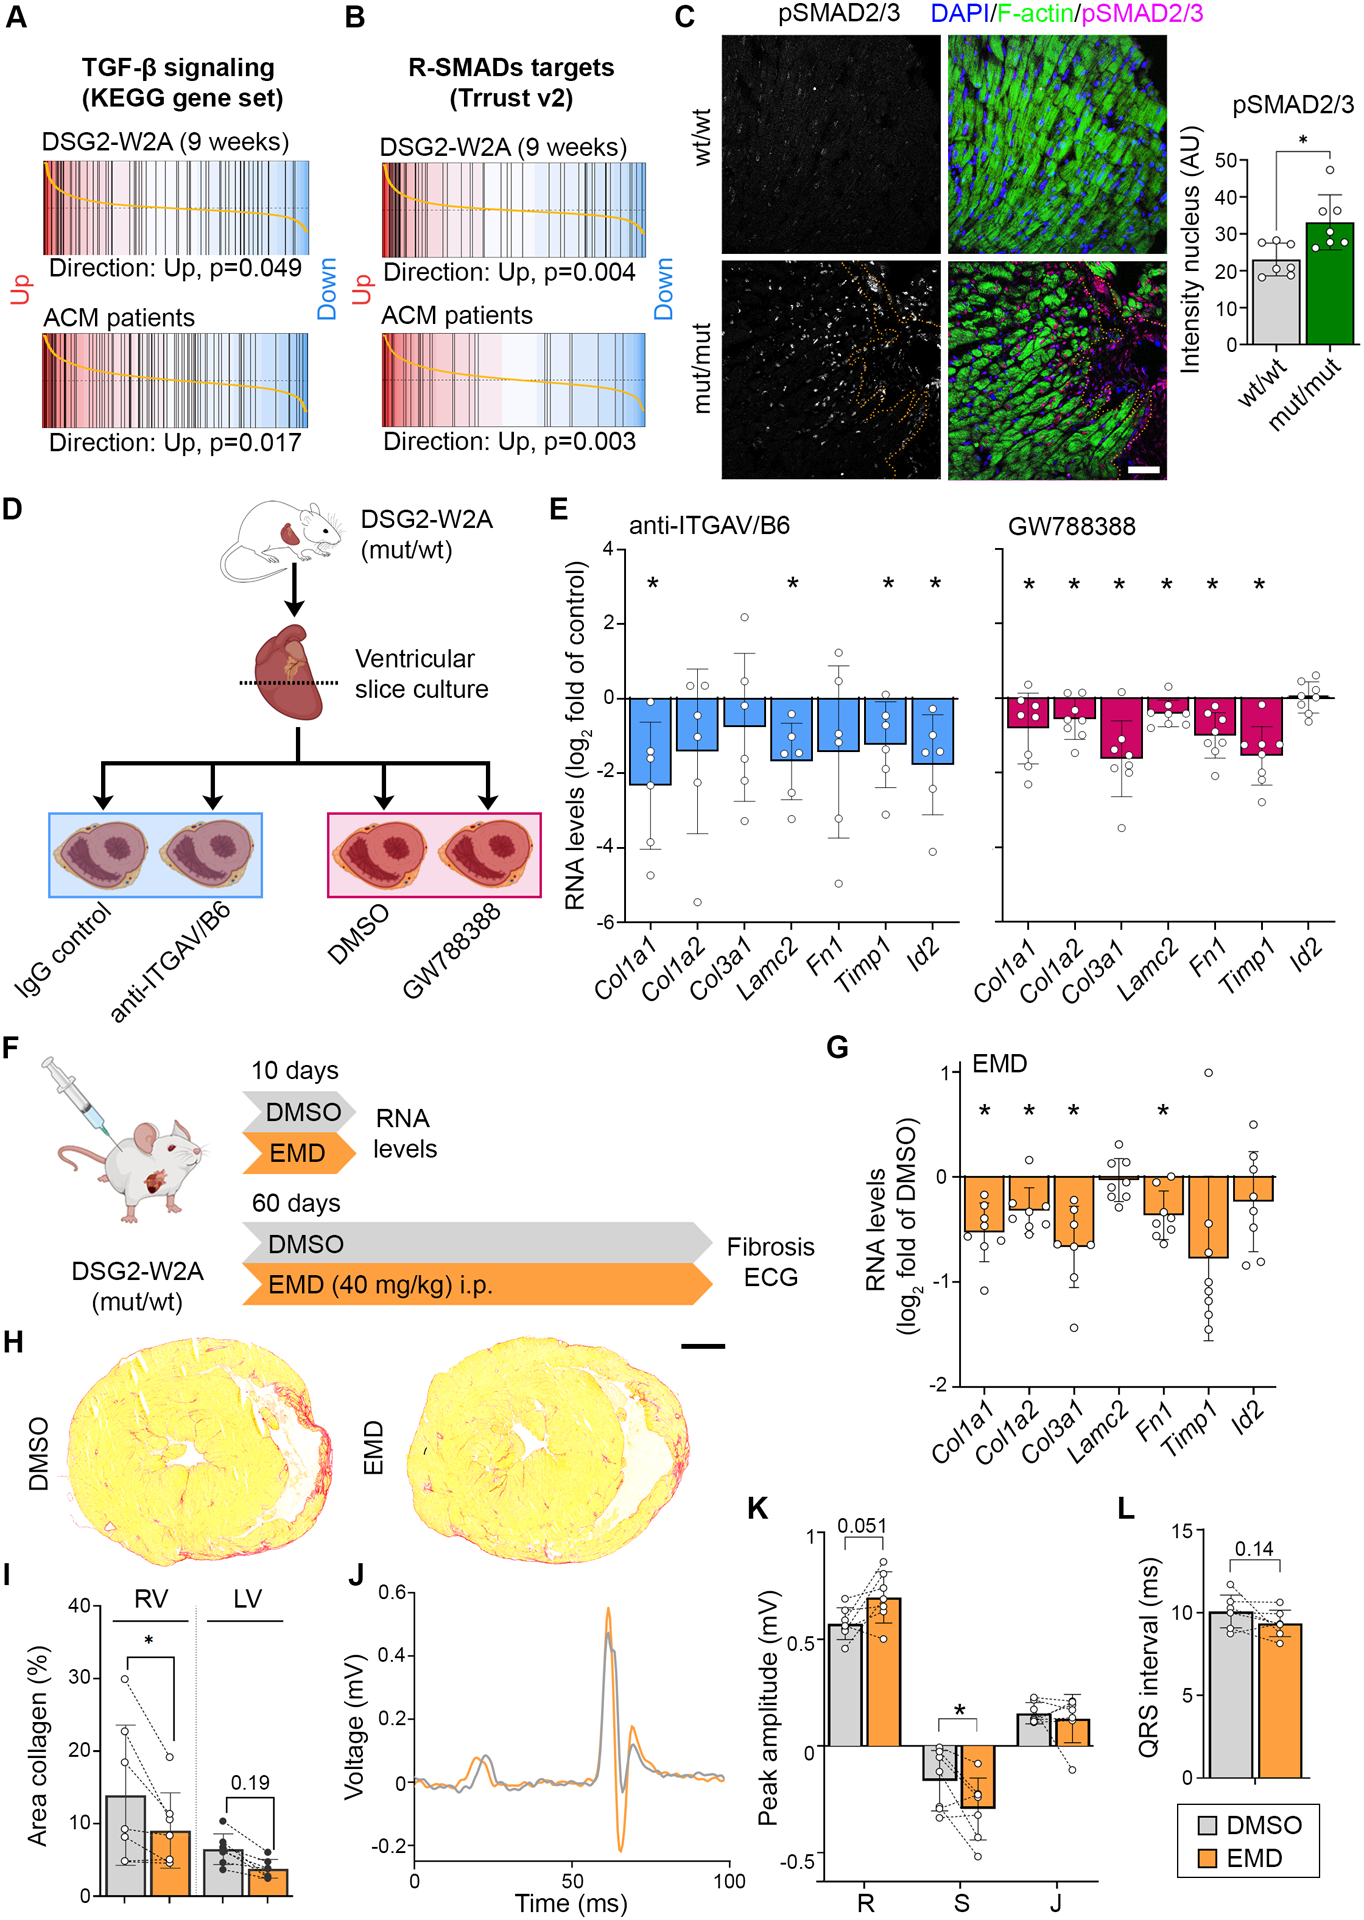
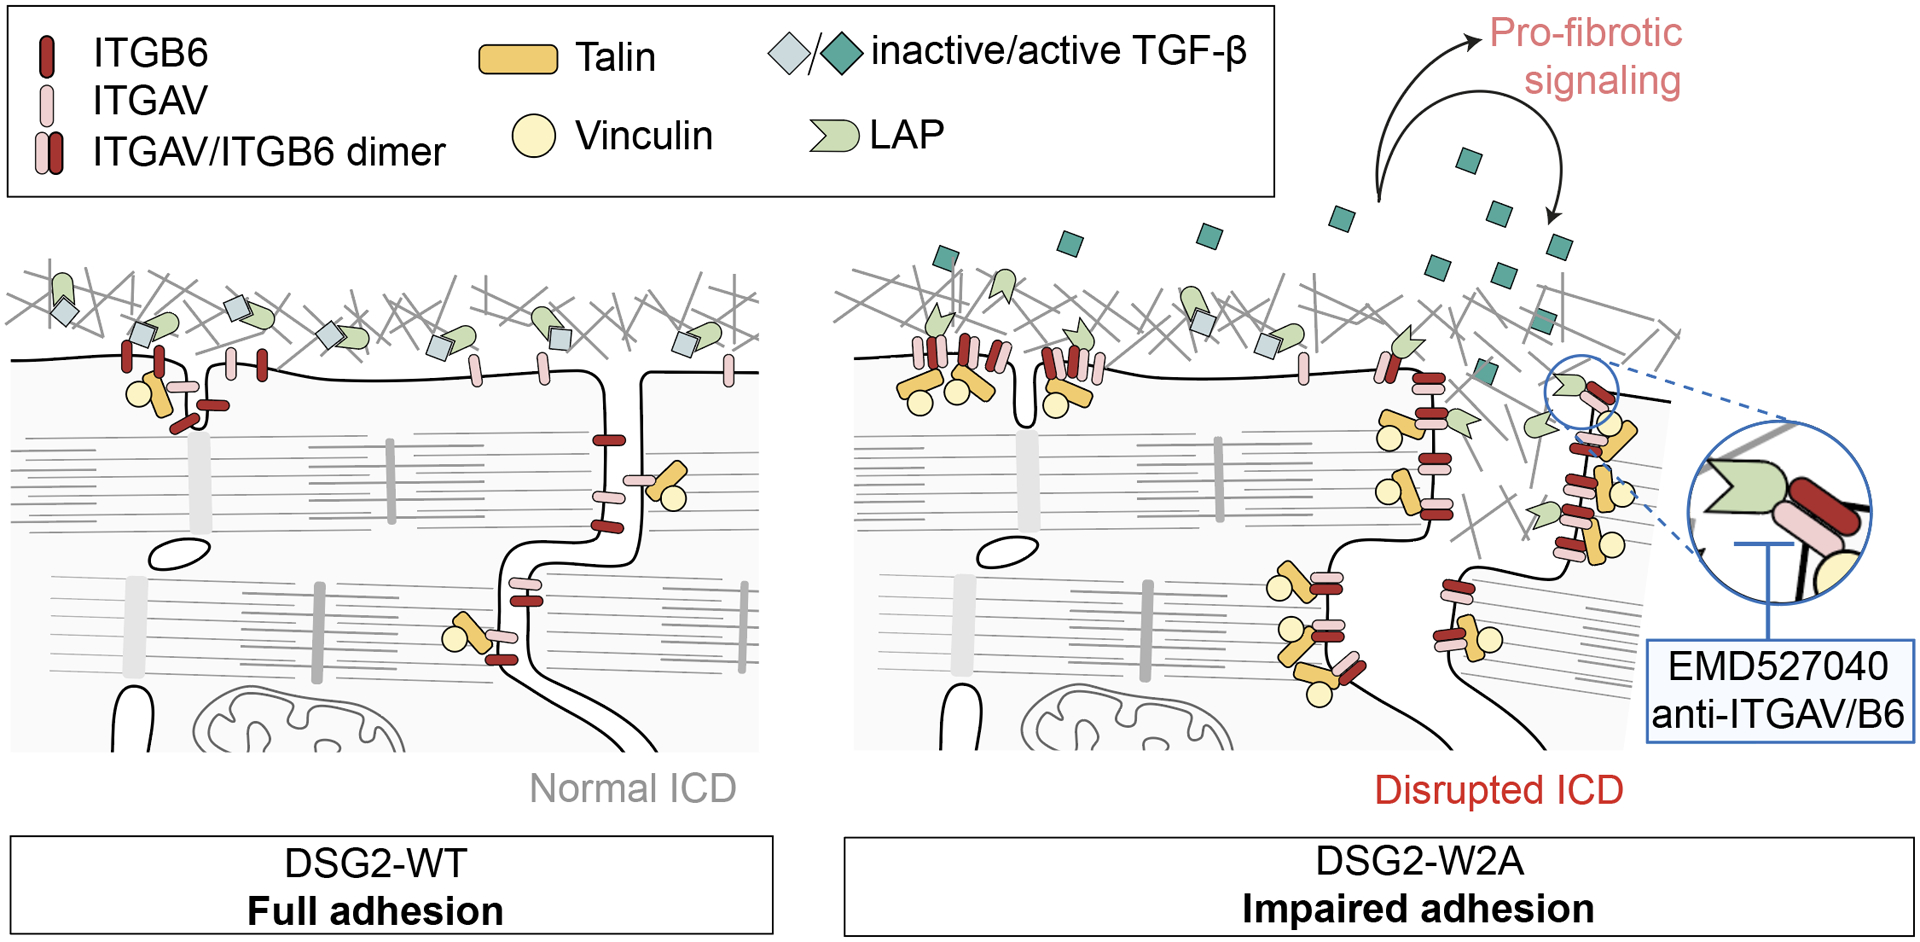
Results: The DSG2-W2A mutation impaired binding on molecular level and compromised intercellular adhesive function. Mice bearing this mutation develop a severe cardiac phenotype recalling the characteristics of ACM, including cardiac fibrosis, impaired systolic function, and arrhythmia. A comparison of the transcriptome of mutant mice with ACM patient data suggested deregulated integrin-αVβ6 and subsequent transforming growth factor-β signaling as driver of cardiac fibrosis. Blocking integrin-αVβ6 led to reduced expression of profibrotic markers and reduced fibrosis formation in mutant animals in vivo.

Conclusions: We show that disruption of desmosomal adhesion is sufficient to induce a phenotype that fulfils the clinical criteria to establish the diagnosis of ACM, confirming the dysfunctional adhesion hypothesis. Deregulation of integrin-αVβ6 and transforming growth factor-β signaling was identified as a central step toward fibrosis. A pilot in vivo drug test revealed this pathway as a promising target to ameliorate fibrosis. This highlights the value of this model to discern mechanisms of cardiac fibrosis and to identify and test novel treatment options for ACM.

Keywords: cardiomyopathies; desmosomes; fibrosis; integrins; intercalated disc; transforming growth factors.


Figures

Figure 1.
Figure 1.. Desmoglein-2 adhesion is mediated via tryptophan swap at position 2.
(A) Predicted interaction model of desmoglein-2 (DSG2) extracellular domains via exchange of tryptophan residue at position 2 into a hydrophobic pocket of the opposing molecule. Cartoon 3D presentation of PDB entry 5ERD, tryptophan-2 is highlighted by ball and stick presentation. (B) Schematic of single molecule force spectroscopy experiments. Recombinant extracellular domains (EC) of DSG2-WT or DSG2-W2A protein were coupled to a mica surface and AFM cantilever via a human Fc-tag (hFc) and a PEG20-linker and probed as indicated. (C) Binding frequency of DSG2-W2A/DSG2-WT heterotypic and homotypic interactions at a pulling speed of 2 μm/s are shown. hFc served as control for unspecific binding. *P< 0.05, one-way ANOVA, Dunnett’s post hoc test. Each independent coating procedure with minimum 625 force curves is taken as biological replicate. (D) Histogram of binding forces distribution with peak fit at a pulling speed of 2 μm/s corresponding to data in C. (E) Determination of the bond half lifetime via Bell’s equation of mean loading rates and binding forces analysed from data of pulling speeds at 0.5, 1, 2, 5, and 7.5 μm/s. Average of values from four independent coating procedures with minimum 625 force curves each. R = R squared, koff = off rate constant, τ0 = bond half lifetime under zero force. (F) Dissociation assays to determine cell-cell adhesion were performed in CaCo2 cells (WT or DSG2 KO background) expressing DSG2-WT-mGFP or DSG2-W2A-mGFP constructs. mGFP empty vector served as control. *P< 0.05, one-way ANOVA, Sidak’s post hoc test. Corresponding Western blot analysis confirmed effective expression of DSG2 constructs (*) vs. the endogenous protein (arrow) in CaCo2 cells. α-tubulin (TUBA) served as loading control. (G) displays representative images of monolayer fragmentation from experiments in F. (H) Dissociation assays in immortalized keratinocytes isolated from neonatal murine skin of the respective genotype. *P< 0.05 or as indicated, Welch’s ANOVA, Dunnett’s post hoc test. (I) Macroscopic cardiac phenotype of DSG2-W2A mut/mut mice at the age of 15 weeks. (J) Cardiac hypertrophy was analysed as mean cross-sectional area of cardiomyocytes in haematoxylin/eosin stained sections. Scale bar: 30 μm. *P< 0.05, unpaired Student’s t-test. (K) Representative images of ICDs acquired by TEM, 3 mice per genotype. Orange asterisks mark intercellular widening, orange circle marks a ruptured junction. Scale bar: 1 μm.
Figure 2.
Figure 2.. DSG2-W2A mutant mice develop characteristics of ACM.
(A) Cardiac fibrosis detected by picrosirius red collagen staining with representative images of sections from 6-months old DSG2-W2A mut/mut and 12-months old wt/wt and mut/wt animals. Scale bar = 1 mm. (B - D) Corresponding analysis of the area of collagen in the right (RV) and left ventricle (LV). Continuous lines indicate the simple linear regression between age and area of collagen. Hearts with more than 10% of collagen in the RV (grey dotted line) were defined as “with fibrosis”. Each dot represents one animal. *P< 0.05, mixed effects analysis with LV and RV matched per animal, Sidak’s post hoc test. Lines indicate median and quartile values. (E) Representative echocardiography images for measurements of the tricuspid annular plane systolic excursion (TAPSE) and LV function in 6-months old mut/mut and 12-months old wt/wt and mut/wt animals. Left side: 2D images from apical four chamber view for TAPSE and parasternal short axis view for LV. M-mode tracings on the right were performed along the line indicated on the left. Scale bars: white 2 mm; black 100 ms. Corresponding analysis of (F) TAPSE, *P< 0.05, Kruskal-Wallis test with Dunn’s post hoc test, (G) fractional shortening of the RV, *P< 0.05, Kruskal-Wallis test with Dunn’s post hoc test, and (H) ejection fraction of the LV, *P< 0.05, one-way ANOVA, Sidak’s post hoc test. (I) Electrocardiogram (ECG) recoded in lead II with representative curves from 6-months old mut/mut and 12-months old wt/wt and mut/wt animals. Definition of respective peaks is indicated in the wt/wt curve. Scale bars: vertical 0.5 mV; horizontal 50 ms. Corresponding analysis of (J) QRS interval, *P< 0.05 or as indicated, Kruskal-Wallis test with Dunn’s post hoc test, (K) amplitude of the S peak, *P< 0.05 or as indicated, one-way ANOVA, Sidak’s post hoc test, and (L) amplitude of the J peak (early repolarization), *P< 0.05 or as indicated, Kruskal-Wallis test with Dunn’s post hoc test. (M) Ventricular arrythmia detected by ECG during 30 min of baseline measurements with example curves from 6-months old mut/mut and 12-months old wt/wt and mut/wt animals. Asterisks mark premature ventricular contractions (PVC), *nsVT indicates a non-sustained ventricular tachycardia detected in one mut/mut animal. Scale bars: vertical 0.5 mV; horizontal 1 s. Corresponding analysis of (N) percentage of mice presenting with PVCs. Values in bars indicate corresponding absolute number of mice with PVC (colored bars) compared to total number of mice evaluated (empty bar), and (O) PVC burden depicted as number of PVCs per minute, *P< 0.05, Kruskal-Wallis test with Dunn’s post hoc test. The black arrow indicates the animal presenting with non-sustained ventricular tachycardia. (P) Kaplan-Meier survival plot of DSG2-W2A mice from an analysis period of 3 years. Vertical lines indicate drop-outs due to unrelated elimination (end of experiment, breeding, injuries). Values indicate corresponding absolute number of mice with sudden death compared to total number of mice evaluated. *P< 0.05, Gehan-Breslow-Wilcoxon test. Box with color indications of respective groups in the middle apply to the entire figure.
Figure 3.
Figure 3.. Integrin-β6 is deregulated in DSG2-W2A mutants.
(A) Venn diagram of significantly altered genes from indicated ACM patient data sets (ACM vs. healthy control) and DSG2-W2A mice at the age of 5 days and 9 weeks (mut/mut vs. wt/wt) highlighting integrin-β6 (Itgb6) as only overlapping gene with same direction of expression in all data sets. Numbers indicate the amount of overlapping genes for the respective overlays. (B) RNA expression of Itgb6 analysed via qRT-PCR in adult DSG2-W2A mouse hearts. *P< 0.05, unpaired Student’s t-test vs. wt/wt. Gapdh served as reference gene. (C) Representative Western blot and respective analysis of band intensity of ITGB6 in DSG2-W2A hearts. GAPDH served as loading control. One-way ANOVA, Dunnett’s post hoc test. (D, E) Immunostaining of ITGB6 (red in overlay) in DSG2-W2A hearts with corresponding analysis of staining intensity in cardiomyocytes in total and ratio of staining intensity at the ICD area (orange arrow heads) vs. cardiomyocytes’ cytosolic area. Desmoplakin (DSP, cyan) marks ICDs, DAPI (blue) nuclei and F-actin (green) the sarcomere system. Lower row shows an overview image of a fibrotic area in mut/mut hearts. Scale bars: 25 μm. *P< 0.05, left graph: Kruskal-Wallis test with Dunn’s post hoc test; right graph: one-way ANOVA, Dunnett’s post hoc test. Box with color indications of respective groups apply to the entire figure.
Figure 4.
Figure 4.. Disrupted ICD structure in DSG2-W2A mutant mice.
(A) Representative z-stack reconstruction of segmented ICDs in top and side view acquired with SIM. Overlay of analysed ICD volume is shown in grey. ICDs are marked by DSP (magenta). Scheme on top presents segmented area and pictograms on the right display the respective angle of view. Corresponding analysis of ICD volume and width of ICD between adjacent cardiomyocytes below. Scale bar: 5 μm. *P< 0.05, Mann-Whitney test. Each dot represents the value of one ICD from in total 4 mice per genotype. (B) Representative images of DSG2 (magenta) and filamentary actin (f-actin, white) z-stacks acquired by SIM and presented as maximum intensity projection. Lower row shows color-coded height projection of DSG2 signals in z-stack after signal thresholding as performed for analysis. Related analysis of DSG2 signal volume and number per ICD length is shown below. Pictograms on the right display the respective angle of view. Scale bar: 5 μm. *P< 0.05, unpaired Student’s t-test, with Welch’s correction. Each dot represents the value of one ICD from in total 3 mice per genotype. (C) FRAP analysis of DSG2-WT and DSG2-W2A-mGFP fusion proteins at the cell-cell junction of neonatal cardiomyocytes with representative intensity kymographs of bleached areas on the left. Time point 0 = bleach as indicated by the black arrow. Analysis of the mobile fraction of the indicated mGFP-fusion proteins is shown on the right. *P< 0.05, unpaired Student’s t-test, with Welch’s correction. Each dot represents the mean value of one heart from in total 3 isolations. (D) Representative triton-X-100 assay immunoblot with separation of a soluble (sol), non-cytoskeletal bound protein fraction from a non-soluble (non-sol), cytoskeletal-anchored fraction and corresponding analysis shown below. Plakoglobin (PG), plakophilin-2 (PKP2) and N-cadherin (NCAD) were analysed. Intensity of proteins was normalized to the total amount of protein detected by ponceau staining. GAPDH and desmoplakin (DSP) served as separation control. *P< 0.05 or as indicated, unpaired Student’s t-test (PG, NCAD, PKP2) or Mann-Whitney test (DSP). Each dot represents the result from one mouse. (E) Immunostaining of connexin-43 (CX43) (red in overlay) in DSG2-W2A hearts. N-cadherin (NCAD, yellow) marks ICDs, DAPI (blue) nuclei and F-actin (green) the sarcomere system. Orange arrows mark ICD, pink arrows highlight lateralization of CX43 staining. Scale bars: 25 μm. Images representative for 5 mice per genotype. Box with color indications of respective groups apply to the entire figure.
Figure 5.
Figure 5.. Increased activation of ITGB6/AV at ICDs of DSG2-W2A mutant mice.
(A) Representative ICD reconstruction from z-stacks of ITGB6 (green) and DSP (magenta) immunostaining acquired by SIM and presented as maximum intensity projection. Related analysis of ITGB6 signal volume and number per ICD length is shown below. Scale bar: 5 μm. *P< 0.05 or as indicated, unpaired Student’s t-test with Welch’s correction (left graph) and Mann-Whitney test (right graph). Each dot represents the value of one ICD from in total 4 mice per genotype. (B) Representative western blot and analysis of band intensity of Integrin-αV (ITGAV) in DSG2-W2A hearts. GAPDH served as loading control. *P< 0.05, unpaired Student’s t-test with Welch’s correction. (C) Immunostaining of ITGAV in DSG2-W2A hearts on the right with respective analysis on the left. DAPI (blue) marks nuclei. Lower row shows an overview image of a fibrotic area in mut/mut hearts. Dotted orange line marks the edge of fibrotic area. Scale bars: upper rows: 20 μm, lower row: 50 μm. *P< 0.05, unpaired Student’s t-test. (D) Immunostaining of ITGAV/B6 heterodimer in DSG2-W2A mutant hearts with respective analysis of staining intensity on the right. Cyan rectangle marks zoomed area on the right. Scale bars: overview 50 μm; insert 10 μm. *P< 0.05, unpaired Student’s t-test. (E) Representative immunostaining images of ITGAV/B6 heterodimer staining (red) in an ACM patient (DSP-E952X, heterozygous) and healthy control sample. F-actin (green) stains the sarcomere system. For the ACM patient, 4 different tissue samples were analysed and compared to 2 tissue samples from 2 healthy controls. Scale bar: 20 μm. (F) Immunostaining of vinculin (VCL, magenta) and talin-2 (TLN2, red) in DSG2-W2A hearts on the right with respective analysis of the mean staining intensity in cardiomyocytes and ratio of the staining intensity at the ICD vs. cytosolic area on the left. DAPI (blue) marks nuclei. F-actin (green) stains the sarcomere system. Scale bar: 25 μm, *P< 0.05, unpaired Student’s t-test. (G) Representative western blot and analysis of band intensity of VCL and TLN2 in DSG2-W2A hearts. GAPDH served as loading control. *P< 0.05, unpaired Student’s t-test for TLN2, Mann-Whitney test for VCL. Box with color indications of respective groups apply to the entire figure.
Figure 6.
Figure 6.. Elevated TGF-β signaling in DSG2-W2A hearts as result of ITGAV/B6 activity.
Barcode plots of gene set enrichment analysis of (A) the KEGG_TGF_BETA_SIGNALING_PATHWAY data set (systematic name: M2642), or (B) genes directly regulated by receptor-regulated SMADs (R-SMADs, includes SMAD1/2/3/5/9) as published in the TRRUST data base in 9-weeks-old DSG2-W2A (mut/mut vs wt/wt) or ACM patient data set 1 (ACM vs. healthy control, GEO: GSE107157/GSE107480). Indicated p-values are calculate by function cameraPR of the R package limma. (C) Immunostainings of phosphorylated SMAD2/3 (magenta, S465/S467 or S423/S425, respectively) in sections of DSG2-W2A hearts and related analysis of nuclear staining intensity. Nuclei are stained with DAPI (blue), cardiomyocytes are marked with f-actin (green). Dotted orange line marks edge of fibrotic area. Scale bar: 50 μm. *P< 0.05, unpaired Student’s t-test. (D) Schematic of experimental set-up for ITGAV/B6 blocking experiments in cardiac slice culture with related results in E. Icons are derived from BioRender. (E) qRT-PCR analysis of expression of genes downstream of TGF-β signaling in cardiac slices cultures treated with inhibiting anti-ITGAV/B6 (1:15) or 10 μmol/l GW788388, an inhibitor of TGF-β receptor I, for 24 hours. *P< 0.05, paired Student’s t-test vs. indicated control condition. (F) Schematic of experimental set-up for in vivo ITGAV/B6 blocking experiments by injection of 40 mg/kg EMD527040 (EMD) i.p. daily. DMSO was applied as vehicle control. Icons are derived from BioRender. (G) qRT-PCR expression analysis of genes downstream of TGF-β signaling in hearts of mice treated with EMD or respective amount of DMSO for 10 days. *P< 0.05, unpaired Student’s t-test vs. DMSO. (H, I) Cardiac fibrosis detected by picrosirius red collagen staining with representative images and corresponding analysis of the area of collagen in the right (RV) and left ventricle (LV). Lines indicate littermates. Each dot represents one animal. *P< 0.05 or as indicated, grouped two-way RM ANOVA with LV/RV and experimental pairs matched, Sidak’s post hoc test. Scale bar: 1 mm. (JL) ECG recoded in lead II with representative curves shown in J. Corresponding analysis of R, S, and J peak amplitude and QRS interval, *P< 0.05 or as indicated, Paired student’s t-test. Lines indicate littermates. Each dot represents one animal.
Figure 7.
Figure 7.. Schematic conclusion of data.
DSG2-W2A mutation with loss of desmosomal adhesion leads to impaired ICD structure with deregulation of ITGB6 and enhanced heterodimerization with ITGAV. The dimer efficiently binds to the extracellular matrix and activates TGF-β by removal of the latency-associated peptide (LAP). Active TGF-β can then induce pro-fibrotic downstream signaling via SMAD molecules. In our experiments, this cascade was blocked by different approaches to inhibit ITGAV/B6.

References

    1. Corrado D, Link MS, Calkins H. Arrhythmogenic Right Ventricular Cardiomyopathy. N Engl J Med. 2017;376:1489–1490. doi: 10.1056/NEJMc1701400 - DOI - PubMed
    1. Austin KM, Trembley MA, Chandler SF, Sanders SP, Saffitz JE, Abrams DJ, Pu WT. Molecular mechanisms of arrhythmogenic cardiomyopathy. Nat Rev Cardiol. 2019;16:519–537. doi: 10.1038/s41569-019-0200-7 - DOI - PMC - PubMed
    1. Delva E, Tucker DK, Kowalczyk AP. The desmosome. Cold Spring Harb Perspect Biol. 2009;1:a002543. doi: 10.1101/cshperspect.a002543 - DOI - PMC - PubMed
    1. Delmar M, McKenna WJ. The cardiac desmosome and arrhythmogenic cardiomyopathies: from gene to disease. Circ Res. 2010;107:700–714. doi: 10.1161/CIRCRESAHA.110.223412 - DOI - PubMed
    1. Basso C, Czarnowska E, Della Barbera M, Bauce B, Beffagna G, Wlodarska EK, Pilichou K, Ramondo A, Lorenzon A, Wozniek O, et al. Ultrastructural evidence of intercalated disc remodelling in arrhythmogenic right ventricular cardiomyopathy: an electron microscopy investigation on endomyocardial biopsies. Eur Heart J. 2006;27:1847–1854. doi: 10.1093/eurheartj/ehl095 - DOI - PubMed

Publication types

MeSH terms