. 2023 Jan 2;222(1):e202203089.
doi: 10.1083/jcb.202203089. Epub 2022 Oct 21.

APC/CCdc20-mediated degradation of Clb4 prompts astral microtubule stabilization at anaphase onset

Affiliations

APC/CCdc20-mediated degradation of Clb4 prompts astral microtubule stabilization at anaphase onset

Federico Zucca et al. J Cell Biol. .

Abstract

Key for accurate chromosome partitioning to the offspring is the ability of mitotic spindle microtubules to respond to different molecular signals and remodel their dynamics accordingly. Spindle microtubules are conventionally divided into three classes: kinetochore, interpolar, and astral microtubules (kMTs, iMTs, and aMTs, respectively). Among all, aMT regulation remains elusive. Here, we show that aMT dynamics are tightly regulated. aMTs remain unstable up to metaphase and are stabilized at anaphase onset. This switch in aMT dynamics, important for proper spindle orientation, specifically requires the degradation of the mitotic cyclin Clb4 by the Anaphase Promoting Complex bound to its activator subunit Cdc20 (APC/CCdc20). These data highlight a unique role for mitotic cyclin Clb4 in controlling aMT regulating factors, of which Kip2 is a prime candidate, provide a framework to understand aMT regulation in vertebrates, and uncover mechanistic principles of how the APC/CCdc20 choreographs the timing of late mitotic events by sequentially impacting on the three classes of spindle microtubules.


Figures

None
Graphical abstract
Figure 1.
Figure 1.
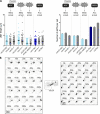
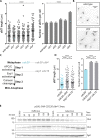
aMT dynamics change at the metaphase-to-anaphase transition. (A) Schematic and simplified representation of late mitotic events in S. cerevisiae. Chromosome segregation begins with the activation of the APC/CCdc20 complex that unleashes the separase Esp1, which in turn cleaves cohesin. Cohesin cleavage is considered the point of non-return for mitotic exit, hence APC/CCdc20 activity is finely regulated and supervised by the DNA damage and spindle assembly checkpoints. Esp1—as a component of the FEAR network—is also required for the initial and partial release of the CDK-counteracting phosphatase Cdc14. One task of FEAR-released Cdc14 is to promote spindle elongation, a duty it shares with the Polo-like kinase Cdc5. Cdc5 and Cdc14 also co-operate to activate MEN, a signaling cascade with the essential function of fully activating the phosphatase. MEN-activated Cdc14 drives CDK inactivation by activating, among others, the APC/CCdh1 and reverts CDK-mediated phosphorylation events, thereby triggering mitotic exit. (B and C) Wild-type (Ry1) cells were analyzed in a synchronous cell cycle. (B) At the indicated time points, the percentage of cells with metaphase (light blue circles) or anaphase (dark blue circles) spindles was determined (n = 100 cells), and aMT length and number were measured (for aMT length, n = 100 aMTs; for aMT number, n = 100 cells). (C) aMT length and number were measured in metaphase (T60 minutes) or anaphase (T100 minutes) cells. We found a mean of 1.2 µm and 1.7 aMT/cell in metaphase cells and of 1.6 µm and 3.2 aMT/cell in anaphase cells. **** = P < 0.0001; asterisks denote significant differences according to two-tailed unpaired t test. Note: Here and throughout the manuscript, aMT length is shown in dot plots while aMT number is shown in bar charts. Each data point in the dot plot represents one single aMT. The median is displayed as a solid line. Error bars in both graphs represent the SEM. (D) Representative images and corresponding diagrams of mitotic spindles in metaphase (light blue) and anaphase (dark blue) cells are shown; scale bar = 5 µm. In the diagram, aMTs are indicated in black, nuclear microtubules (iMTs and kMTs) in gray, and the two SPBs in pink.
Figure 2.
Figure 2.
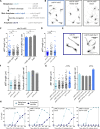
aMTs are stabilized in anaphase. (A) Schematic representation of the experimental setup pertinent to this figure (mutants used and mitotic phase of their terminal arrest). (B and C) cdc20-AID (Ry4853) and cdc15-as1 (Ry1112) cells were analyzed at their terminal arrest (T180 minutes). (B) The graphs show aMT length and number of the indicated genotypes (for aMT length, n = 100 aMTs; for aMT number, n = 100 cells). The arrests uniformed the average aMT length between metaphase and anaphase cells (2.3 µm in cdc20 cells and 2.1 µm in cdc15 cells), while the number remained significantly higher in cdc15 mutants (from a mean of 3.1 to 4.9 aMT/cell in cdc20 and cdc15 cells, respectively). **** = P < 0.0001; asterisks denote significant differences according to ordinary One-Way ANOVA and Tukey’s multiple comparisons test. (C) Representative images of the terminal phenotype are shown. Scale bar = 2 µm. (D and E) cdc20-AID (Ry7732) and cdc15-as1 (Ry9741) cells harboring a TUB1-GFP fusion were arrested in G1 and released into restrictive conditions. When the majority of the cells reached their terminal arrest (T180 minutes), cells were transferred to a CellASIC ONIX plate for live imaging. Individual aMTs were probed. (D) Still images of a representative cell are shown for both strains (scale bar = 1 µm). Graphs of two representative aMTs (1 and 2) per cell are shown. Black and gray arrows indicate the occurrence of catastrophe and rescue events, respectively. (E) Bar charts represent the calculated catastrophe and rescue rates (n = 33 aMTs in cdc20-AID cells and n = 21 aMTs in cdc15-as1 cells were measured). * = P < 0.05; ** = P < 0.01; asterisks denote significant differences according to two-tailed unpaired t test. aMTs of cdc15 cells resulted less dynamic—as assessed by the decrease of both catastrophe (from 0.0044 to 0.0026 event/s) and rescue rates (from 0.004 to 0.0028 event/s)—than aMTs of cdc20 cells. Error bars in graphs represent SEM.
Figure S1.
Figure S1.
Analysis of aMTs in different mitotic phases. (A) cdc20-AID (Ry7873), cdc20-1 (Ry586), cdc23-1 (Ry454), cdc13-1 (Ry17), pGAL-MAD2 (Ry10946), cdc14-1 (Ry1574), cdc5-as1 (Ry2446), and cdc15-as1 (Ry1112) cells were synchronized in G1 and released into restrictive conditions. Cells were analyzed at their terminal arrest (T180 minutes). The graphs show the aMT length and number of the indicated mutant strains (for aMT length, n = 100 aMTs; for aMT number, n = 100 cells). Error bars in graphs equal SEM. (B) Time-lapse images of two representative aMTs of cdc20-AID (Ry7732) cells harboring a TUB1-GFP fusion are shown (T180 minutes; scale bar = 2 µm). Black and gray arrows indicate the occurrence of catastrophe and rescue events, respectively.
Figure 3.
Figure 3.
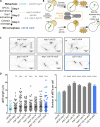
aMT stabilization relies on a specific anaphase signature. (A) Schematic representation of the experimental setup pertinent to this figure. (B and C) cdc20-AID (Ry4853), cdc14-1 cdc5-as1 (Ry1602), and cdc15-as1 (Ry1112) cells were analyzed at their terminal arrest (T180 minutes). (B) The graphs show aMT length and number of the indicated genotypes (for aMT length, n = 100 aMTs; for aMT number, n = 100 cells). aMTs of cdc14 cdc5 cells were longer and more numerous than the ones of cdc20 mutants (from a mean of 2.6 µm and 2.6 aMT/cell in cdc20 cells to a mean of 4 µm and 4.6 aMT/cell in cdc14 cdc5 cells) and similar in number but much longer than the ones of cdc15 cells (from a mean of 2.1 to 4 µm in cdc15 and cdc14 cdc5 cells, respectively). **** = P < 0.0001; asterisks denote significant differences according to ordinary One-Way ANOVA and Tukey’s multiple comparisons test. (C) A representative image of cdc14 cdc5 cells is shown. (D and E) cdc20-AID (Ry7732), cdc15-as1 (Ry9741), and cdc14-1 cdc5-as1 (Ry3256) cells expressing TUB1-GFP fusion protein were arrested in G1 and synchronously released into restrictive conditions. When the arrest was complete (T180 minutes), cells were moved to a CellASIC ONIX plate for live imaging. (D) Time-lapse images of a representative cell are shown for the cdc14-1 cdc5-as1 strain (scale bar = 1 µm). Graphs of two aMTs (1 and 2) are shown. The occurrence of catastrophe and rescue events is indicated in the graphs with black and gray arrows, respectively. (E) The bar charts show the catastrophe and rescue rates of the indicated mutant strains. aMTs of cdc14 cdc5 are characterized by a low-catastrophe rate (0.003 events/s, compared to 0.004 and 0.0026 in cdc20 and cdc15 cells, respectively), associated with a high-rescue rate (0.0044 events/s, compared to 0.004 and 0.0028 in cdc20 and cdc15 cells, respectively). n = 33 aMTs in cdc20-AID cells, n = 33 aMTs in cdc14-1 cdc5-as1 cells, and n = 21 aMTs in cdc15-as1. * = P < 0.05; asterisks denote significant differences according to ordinary One-Way ANOVA and Tukey’s multiple comparisons test. Error bars in graphs represent SEM.
Figure S2.
Figure S2.
The aMT phenotype of cdc14-1 cdc5-as1 cells is independent from activation of the spindle assembly checkpoint, the DNA damage response, and the spindle positioning checkpoint SPoC, and it is not a consequence of the spindle elongation defect or the inactivation of Cdc14 and Cdc5. (A) Schematic representation of the experimental setup pertinent to this figure. (B and C) cdc14-1 cdc5-as1 (Ry1602), cdc14-1 cdc5-as1 mad2∆ rad9∆ (Ry3771), and cdc14-1 cdc5-as1 bub2∆ (Ry3346) cells released from a G1 block into restrictive conditions were scored at their terminal arrest (T180 minutes). (B) Representative images of the indicated strains are shown (scale bar = 5 µm). (C) The graphs show aMT length and number (for aMT length, n = 100 aMTs; for aMT number, n = 100 cells). None of the strains resulted statistically different according to ordinary One-Way ANOVA and Tukey’s multiple comparisons test. (D and E) cdc15-as1 (Ry1112), cdc15-as1 kar9∆ dyn1-AID (Ry7620), and cdc14-1 cdc5-as1 (Ry1602) cells were treated and analyzed as in B and C. (D) aMT length is shown for the indicated strains. ** = P < 0.01; **** = P < 0.0001; asterisks denote significant differences according to ordinary One-Way ANOVA and Tukey’s multiple comparisons test. (E) Representative images of cdc15-as1 and cdc15-as1 kar9∆ dyn1-AID mutant cells are shown (scale bar = 5 µm). (F) cdc20-AID (Ry4853), cdc20-AID cdc14-1 (Ry4934), and cdc20-AID cdc5-as1 (Ry4936) cells were treated and analyzed as in B and C. None of the strains were statistically different according to ordinary One-Way ANOVA and Tukey’s multiple comparisons test. (G and H) pMET-CDC20 (Ry1223), pMET-CDC20 cdc14-1 (Ry3204) pMET-CDC20 cdc5-as1 (Ry3209), pMET-CDC20 cdc14-1 cdc5-as1 (Ry3201), and cdc14-1 cdc5-as1 (Ry1602) cells were arrested in G1 with the α-factor pheromone (5 µg/ml) in synthetic complete media lacking methionine and synchronously released into YEPD supplemented with methionine—to repress the expression of CDC20—at 37°C in the presence of CMK (5 µM) to inactivate the cdc14-1 and cdc5-as1 alleles, respectively. (G) aMT length and number were scored 3.5 h after the release. **** = P < 0.0001; asterisks denote significant differences according to ordinary One-Way ANOVA and Tukey’s multiple comparisons test. Error bars in graphs represent SEM. (H) Samples were taken at the indicated time points to determine the percentage of cells with metaphase-like (light blue) and anaphase-like (dark blue) spindles (n = 100 cells).
Figure 4.
Figure 4.
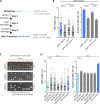
APC/CCdc20 activation stabilizes aMTs. (A) Schematic representation of the three-steps signaling cascade defining the metaphase to anaphase transition: (1) activation of the APC/CCdc20; (2) activation of the separase/Esp1, mediated by the APC/CCdc20-dependent degradation of securin/Pds1; and (3) Esp1-mediated cleavage of the Scc1 subunit of the cohesin complex. (B) Schematic representation of the experimental setup pertinent to this figure. (C–E) cdc20-AID (Ry4853), esp1-1 (Ry9490), pGAL-SCC1nc (Ry8210), and cdc14-1 cdc5-as1 (Ry1602) cells were synchronized in G1 and released in restrictive conditions. Note: In cdc20 mutants, the APC/CCdc20 is inactive, all its substrates are present, separase is inactive, and cohesin is bound to chromatin; in esp1 mutant cells, the APC/CCdc20 is active and all its substrates are removed, including Pds1, but separase remains inactive and cohesin is still bound to chromatin; in scc1nc mutants, not only all the APC/CCdc20 substrates are removed, but also all separase substrates are properly cleaved, with the only exception of cohesin, which remains intact and bound to chromatin; and, finally, in cdc14 cdc5 cells, all the steps of the cascade are completed. (C) Representative images of esp1-1 and pGAL-SCC1nc cells with short bipolar spindles are shown (T140 minute; scale bar = 5 µm). (D) Samples were taken at the indicated time points to determine the percentage of cells with short bipolar spindles (n = 100 cells). (E) aMT length and number were scored T140 minutes after the release, the time point before spindle collapse in esp1-1 and pGAL-SCC1nc cells (for aMT length, n = 100 aMTs; for aMT number, n = 100 cells). aMTs of both esp1 and scc1nc cells were slightly more numerous and longer than aMTs of cdc20 cells (from 2.3 µm and 2.4 aMT/cell in cdc20 cells to 2.9 µm and 2.8 aMT/cell, and 3 µm and 3.2 aMT/cell in esp1 and scc1nc cells, respectively). **** = P < 0.0001; asterisks denote significant differences according to ordinary One-Way ANOVA and Tukey’s multiple comparisons test; the arrow indicates the time point when the analysis was carried out. Error bars in graphs represent SEM.
Figure 5.
Figure 5.
APC/CCdc20 activation is sufficient to stabilize aMTs at anaphase onset. (A) Schematic representation of the experimental setup pertinent to this figure. (B) Schematic representation of the pathways explaining spindle collapse in esp1-1 cells. Spindle collapse/disassembly is triggered by CDK inactivation. In yeast, CDK inactivation requires the activity of the MEN, a Ras-like GTPase signaling pathway localized on the SPB. MEN activation requires SPB movement into the bud, where the inactive cascade meets its activator, asymmetrically localized there. For this step, wild-type cells relies on spindle elongation. (C and D) On the contrary, esp1-1 cells may activate the MEN through a Dyn1-dependent pulling of the spindle, hence nucleus, into the bud before cohesin cleavage. esp-1 (Ry9490), esp1-1 dyn1∆ (Ry9516), esp1-1 cdc15-as1 (Ry9512), esp1-1 cdc5-as1 (Ry9134), esp1-1 cdc14-1 (Ry9131), esp1-1 cdc14-1 cdc5-as1 (Ry9128), and cdc14-1 cdc5-as1 (Ry1602) cells of the indicated phenotype were synchronized in G1 and released into restrictive conditions. Cells were scored at their terminal arrest. (C) Representative images of the indicated mutants at their terminal arrest are shown (scale bar = 5 µm). (D) For the mutants of interest, aMT length is shown in dot plots while aMT number is shown in bar charts (for aMT length, n = 100 aMTs; for aMT number, n = 100 cells). aMTs of esp1 mutants were significantly longer and more numerous than aMTs of cdc20 cells, resembling the ones of cdc5 cdc14 cells (with an average length of 4, 4.2, 4, 4.5, and 4.2 µm, and an average number of 3.8, 4.4, 4.1, 4.7, and 4.3 aMT/cell in esp1 cdc15, esp1 cdc5, esp1 cdc14 esp1, cdc5 cdc14, and esp1 dyn1 cells, respectively; compared to cdc20 and cdc14 cdc5 cells that showed an average aMT length of 2.6 and 4 µm, and an average number of 3.2 aMT/cell and 4.3 aMT/cell, respectively). ** = P < 0.01; *** = P < 0.001; **** = P < 0.0001; asterisks denote significant differences according to ordinary One-Way ANOVA and Tukey’s multiple comparisons test. Error bars in graphs equal SEM.
Figure S3.
Figure S3.
Preventing MEN activation or nuclear movement into the bud stops spindle collapse in esp1-1 cells. cdc20-AID (Ry7873), esp1-1 (Ry9490), esp1-1 dyn1∆ (Ry9516), esp1-1 cdc15-as1 (Ry9512), esp1-1 cdc5-as1 (Ry9134), esp1-1 cdc14-1 (Ry9131), esp1-1 cdc14-1 cdc5-as1 (Ry9128), and cdc14-1 cdc5-as1 (Ry1602) cells were arrested in G1 and released into restrictive conditions for the alleles used. Samples were taken at the indicated time points to determine the percentage of cells with short bipolar spindles (n = 100 cells).
Figure S4.
Figure S4.
The individual removal of Pds1 and the majority of known or putative APC/CCdc20 substrates does not alter aMT dynamics. (A) Schematic representation of the experimental setup pertinent to this figure. (B) cdc14-1 cdc5-as1 (Ry1602), pMET-CDC20 cdc14-1 cdc5-as1 (Ry3201), pds1∆ cdc14-1 cdc5-as1 (Ry2143), and pMET-CDC20 pds1∆ cdc14-1 cdc5-as1 (Ry8969) cells were arrested in G1 with α-factor (5 µg/ml) in synthetic complete media lacking methionine and released into YEPD media lacking the pheromone and supplemented with methionine and CMK (5 µM) to repress the expression of CDC20 and to inactivate the cdc5-as1 allele, respectively. The culture was incubated at 37°C to inactivate the cdc14-1 allele. aMT length and number were analyzed at the terminal arrest (∼3.5 h after the release; for aMT length, n = 100 aMTs; for aMT number, n = 100 cells). **** = P < 0.0001; asterisks denote significant differences according to ordinary One-Way ANOVA and Tukey’s multiple comparisons test. (C) cdc20-AID and clb2∆ synthetic lethality as evidenced by tetrad dissection. -LEU means synthetic complete media lacking leucine; only cells with the clb2Δ allele can grow. G418 means YEPD added with Geneticin; only cells carrying the cdc20-AID allele can grow. (D) cdc20-AID (Ry7873), cdc20-AID kip1∆ (Ry9294), cdc20-AID acm1∆ (Ry10025), cdc20-AID dbf4-1 (Ry9877), cdc20-AID alk2∆ (Ry9880), cdc20-AID alk2∆ alk1∆ (Ry9883), cdc20-AID clb3∆ (Ry10738), and cdc14-1 cdc5-as1 (Ry1602) cells were arrested in G1 and released in YEPD into restrictive conditions. cdc20-AID dbf4-1 cells were treated as the other strains, but incubated at 37°C when the majority of the cells reached metaphase (∼2 h after the release). aMT length and number were scored at the terminal arrest. ** = P < 0.01; **** = P < 0.0001; asterisks denote significant differences according to ordinary One-Way ANOVA and Tukey’s multiple comparisons test against the control strain cdc20-AID. Error bars in graphs equal SEM.
Figure 6.
Figure 6.
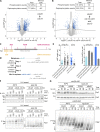
Systematic analysis of putative APC/CCdc20 substrates involved in anaphase aMT stabilization unveils the key role of B-Cyclin Clb4. (A and B) Wild-type (Ry1), clb1∆ (Ry5976), clb2∆ (Ry20), clb3∆ (Ry10927), clb4∆ (Ry10924), and clb5∆ (Ry445) cells were arrested in S-phase and analyzed at their terminal phenotype. (A) The graphs show aMT length and number of the indicated genotypes (for aMT length, n = 100 aMTs; for aMT number, n = 100 cells). Among the different clb mutants, only clb4 cells showed longer and more numerous aMTs than wild-type cells (from 1.6 µm and 2.1 aMT/cell in wild-type cells to 2.6 µm and 3.2 aMT/cell in clb4 cells). **** = P < 0.0001; asterisks denote significant differences according to ordinary One-Way ANOVA and Tukey’s multiple comparisons test). (B) Representative images of wild-type and clb4∆ arrested in S-phase are shown (scale bar = 5 µm). (C) Schematic representation of the experimental setup pertinent to panel D. (D) cdc20-AID (Ry7873), cdc20-AID clb4∆ (Ry10741), and esp1-1 cdc15-as1 (Ry9512) cells were released from a G1 block into restrictive conditions and analyzed at their terminal arrest (T180 minutes). Graphs for aMT length and number are shown. Similarly to the ones of esp1 cdc15 cells, aMTs of cdc20 clb4 cells resulted more stable than the aMTs of cdc20 cells (from 2.4 µm and 3.2 aMT/cell in cdc20 cells to 3.9 µm and 4.5 aMT/cell in cdc20 clb4 cells and 3.5 µm and 4.4 aMT/cell in esp1 cdc15 cells; **** = P < 0.0001; asterisks denote significant differences according to ordinary One-Way ANOVA and Tukey’s multiple comparisons test). Error bars in graphs equal SEM. (E) pGAL-3HA-CDC20 CLB4-13myc (Ry10889) cells were arrested in S-phase with HU (10 mg/ml) in YEP media supplemented with Raffinose. Upon reaching the arrest (around 180 min from HU addition), the culture was split in two. One half was maintained in the same conditions, whereas 2% galactose was added to the other half to induce the expression of Cdc20. Clb2 and Clb4 protein levels were probed by Western blot analyses at the indicated timepoints. Pgk1 protein was used as an internal loading control in immunoblots. Size markers on the sides of the gel blots indicate relative molecular mass. Source data are available for this figure: SourceData F6.
Figure 7.
Figure 7.
B-Cyclin Clb4 is degraded at anaphase onset. (A) Schematic representation of the experimental setup pertinent to this figure. (B) Wild-type (Ry10891) cells expressing Clb4-13myc were arrested in G1 and synchronously released into fresh YEP media with glucose. At the indicated time points, the percentage of cells containing metaphase (light blue circles) and anaphase (dark blue circles) spindles was determined (n = 100 cells), and protein samples were taken to follow Clb4, Pds1, and Clb2 protein levels. (C) cdc20-AID (Ry10967), cdc14-1 cdc5-as1 (Ry10973), and cdc15-as1 (Ry10970) cells expressing Clb4-13myc were synchronized in G1 with α-factor (5 µg/ml) and synchronously released into restrictive conditions. At the indicated time points, the percentage of cells containing metaphase (light blue circles) and anaphase (dark blue circles) spindles was determined (n = 100 cells) and protein samples were taken to probe Clb2 and Clb4 protein levels by Western blot analyses. Pgk1 was used as a loading control. Size markers on the sides of the gel blots indicate relative molecular mass. Source data are available for this figure: SourceData F7.
Figure S5.
Figure S5.
The phospho-proteomic analyses unveiled numerous residues that may be involved in anaphase aMT stabilization and recapitulated the de-phosphorylation kinetic of different known CDK substrates. (A–C) As a proof of concept that our phospho-proteomic analysis is a good proxy for cell cycle progression, we hand-picked and scored the phosphorylation status of residues in three CDK substrates, namely Fin1 (A), Ase1 (B), and Orc6 (C), whose kinetics of de-phosphorylation differs in anaphase. More precisely, we identified two out of five putative CDK1 residues reported for Fin1 (S36, T68), four out of seven for Ase1 (T55, S64, S198, S803), and three out of four for Orc6 (S106, S116, T146). Consistent with Fin1 being de-phosphorylated in early anaphase, Ase1 in mid-anaphase, and Orc6 at mitotic exit, when we compared the cdc20 and cdc15 datasets, we found that all Fin1 residues, two out of four Ase1 residues, and no Orc6 residues were de-phosphorylated. Moreover, when the cdc14 cdc5 dataset was included in the analysis and compared to the other two datasets individually, the residues whose de-phosphorylation is Cdc14-dependent were appreciated (i.e., Ase1S803, whose phosphorylation status is high in both cdc20 and cdc14 cdc5 cells, but low in cdc15 cells). Above each graph, a schematic representation shows the identified putative CDK-phosphorylated residues covered by our analysis (highlighted in red), and the residues that were not identified in the dataset (highlighted in black). The graphs show the log2 fold change (FC) of each residue generated comparing each mutant with each other. The log2 fold changes of each residue are normalized by the log2 fold changes of the respective proteins to account for changes in protein abundance. (D and E) The log2 fold changes of the phospho-residues obtained with this analysis were plotted against the log2 fold changes of the corresponding proteins. The graph in D is pertinent to the global analysis shown in Fig. 8 A, while the one in E is pertinent to the global analysis shown in Fig. 8 B. (F) The graph shows the phospho-residues that belong to proteins already linked to the regulation of aMT dynamics and their log2 fold changes as calculated above and normalized by the log2 fold change of the protein to account for protein abundance change. Only residues with a log2 fold change of at least 0.4 and a significant P value are shown. The residues that belong to the minimal CDK consensus are shown in red. ** = P < 0.01; *** = P < 0.001; **** = P < 0.0001.
Figure 8.
Figure 8.
Modeling the metaphase-to-anaphase transition by phospho-proteomics unveiled a switch toward de-phosphorylation. (A and B) cdc20-AID (Ry4853), cdc14-1 cdc5-as1 (Ry1602), and cdc15-as1 (Ry1112) cells were arrested in G1 and released into restrictive conditions. Cells were harvested at their terminal arrest (T180 minutes) to extract proteins to process for TMT MS analysis—three biological replicates for cdc20-AID and cdc14-1 cdc5-as1 cells and two biological replicates for cdc15-as1 cells. The volcano plot represents the log2 fold change (FC), and the respective –log10 P values were calculated comparing the values obtained for each phospho-residue in cdc20-AID and cdc15-as1 cells. To identify the phospho-residues that were significantly different between the two mutant cells (blue dots), an FDR of 0.001 (S0 at 0.05) was applied, with an additional cut-off of a log2 fold change <−0.5 or >0.5. (C) Schematic representation of the kinesin protein Kip2; highlighted in red are the Kip2 residues with a CDK1 (S/TP) binding motif, in yellow the one with the GSK3 consensus motif (multiple residues within a continuous S/TxxxS/T pattern; adapted from Drechsler et al. [2015]). Of note, S63 and T275 are the residues mutated in the kip2-2A allele. S28 is a residue dephosphorylated at anaphase onset, identified by our analysis. (D) Schematic representation of the experimental setup pertinent to panel E. (E) cdc20-AID kip2∆ pCEN-KIP2 (Ry10858), cdc20-AID kip2∆ pCEN-KIP2S63AT275A (Ry10861), cdc14-1 cdc5-as1 kip2∆ pCEN-KIP2 (Ry10857), cdc14-1 cdc5-as1 kip2∆ (Ry10844), and cdc14-1 cdc5-as1 (Ry1602) cells were released from a G1 block into restrictive conditions and analyzed at their terminal arrest (T180 minutes). aMT length and number are shown in the graphs (for aMT length, n = 100 aMTs; for aMT number, n = 100 cells). Similarly to cdc14 cdc5 kip2 pCEN-KIP2 cells, cdc20 kip2 pCEN-KIP2-2A showed longer and more numerous aMTs than cdc20 kip2 pCEN-KIP2 cells (from 1.9 µm and 2.1 aMT/cell in cdc20 kip2 pCEN-KIP2 cells to 3.9 µm and 3.6 aMT/cell in cdc20 kip2 pCEN-KIP2-2A and 3 µm and 3.2 aMT/cell in cdc14 cdc5 kip2 pCEN-KIP2 cells). **** = P < 0.0001; asterisks denote significant differences according to ordinary One-Way ANOVA and Tukey’s multiple comparisons test. On the same line, cdc14 cdc5 kip2 cells showed shorter and less aMTs than cdc14 cdc5 cells (from 3.9 µm and 4.5 aMT/cell in cdc14 cdc5 cells, to 1.3 µm and 1.6 aMT/cell in cdc14 cdc5 kip2 cells). **** = P < 0.0001; asterisks denote significant differences according to ordinary One-Way ANOVA and Tukey’s multiple comparisons test. Error bars in graphs represent SEM. (F) clb4∆ pCEN-KIP2 (Ry10963), pGAL-3HA-CLB4 pCEN-KIP2 (Ry10894), clb4∆ pCEN-KIP2S63AT275A (Ry10965), and pGAL-3HA-CLB4 pCEN-KIP2S63AT275A (Ry10896) were arrested in S-phase. At the arrest samples were taken at the indicated times to probe Kip2 and Clb4 levels and mobility. Pgk1 was used as an internal loading control in immunoblots. Size markers on the sides indicate relative molecular mass. (G) cdc20-AID pCEN-KIP2 (Ry10955), cdc20-AID clb4∆ pCEN-KIP2 (Ry10959), cdc20-AID pCEN-KIP2S63AT275A (Ry10957), and cdc20-AID clb4∆ pCEN-KIP2S63AT275A (Ry10961) cells were arrested in G1 and released into restrictive conditions. Samples were taken at the indicated times for Western blot analyses. Kar2 is an internal loading control. Size markers on the sides of the gel blots indicate relative molecular mass. Source data are available for this figure: SourceData F8.
Figure 9.
Figure 9.
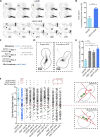
Dynamic aMTs and Cdc5 guide spindle positioning. (A and B) cdc20-AID (Ry7732) and cdc14-1 cdc5-as1 (Ry3256) cells harboring a TUB1-GFP fusion were synchronized in G1 and released into restrictive conditions. Approximately 3 h after the release, cells were moved to a CellASIC ONIX plate for live imaging. (A) Time-lapse images from a representative cell are shown for the cdc20-AID and cdc14-1 cdc5-as1 strains (scale bar = 1 µm). Black arrows indicate the frames when the highlighted aMTs were in close proximity with the cellular cortex. (B) The bar charts show the quantification of the time that each aMT spent in proximity with the cortex. On average, aMTs of cdc14 cdc5 and cdc20 cells remained close to the cortex during 77 and 39% of the analyzed time, respectively (n = 10 aMTs in cdc20-AID cells and n = 15 aMTs in cdc14 cdc5 cells). **** = P < 0.0001; asterisks denote significant differences according to ordinary One-Way ANOVA and Tukey’s multiple comparisons test. (C) Schematic representation of the experimental setup pertinent to panels E and F. (D) Representative images of cells with proper or anomalous aMTs, a distinction based on aMT direction, are shown (scale bar = 2 µm). (E) cdc20-AID (Ry4853), cdc14-1 cdc5-as1 (Ry1602), esp1-1 cdc15-as1 (Ry9512), and cdc20-AID clb4∆ (Ry10741) cells were synchronized in G1 and released into restrictive conditions. Cells were analyzed at their terminal arrest (T180 minutes). The bar charts show the quantification of cells with anomalous aMTs (as shown in D) in the four strains. On average, 22% of cdc20 cells, 58% of cdc14 cdc5, 47% of esp1 cdc15 cells, and 50% of cdc20 clb4 cells showed anomalous aMTs (n = 100 cells). * = P < 0.05; ** = P < 0.01; *** = P < 0.001; asterisks denote significant differences according to two-tailed unpaired t test. (F) cdc20-AID (Ry4853), cdc14-1 cdc5-as1 (Ry1602), esp1-1 cdc15-as1 (Ry9512), cdc20-AID clb4∆ (Ry10741), pMET-CDC20 cdc5-as1 (Ry3209), pMET-CDC20 cdc14-1 cdc5-as1 (Ry3201), pMET-CDC20 cdc14-1 (Ry3204), esp1-1 cdc14-1 (Ry9131), esp1 cdc5-as1 (Ry9134), and esp1-1 cdc14-1 cdc5-as1 (Ry9128) cells were treated as in E. The dot plot shows the bud-neck/spindle angles measured in the cells of the indicated genotype (n = 100 cells). On the right, a schematic representation of the angles generated by the bud-neck and the spindle, an indicator of spindle orientation, is shown. The closer the angle is to 90°, the more the spindle is properly oriented toward the mother-bud axis; vice versa, the more the angle is close to 0°, the more it is misoriented. Each data point in the dot plot represents a single cell. Note that an average angle of 45° means a complete randomization of spindle orientation. * = P < 0.05; **** = P < 0.0001; asterisks denote significant differences according to ordinary One-Way ANOVA and Tukey’s multiple comparisons test, using cdc20-AID cells as control. Error bars in graphs represent SEM.
Figure 10.
Figure 10.
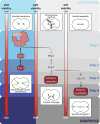
A model for the timely regulation of late mitotic events by the APC/CCdc20 in S. cerevisiae. Proper rearrangement of spindle microtubule dynamics coordinates sister chromatid segregation with late mitotic events. The APC/CCdc20 directs this process by triggering a signaling cascade in which individual steps lead to the regulation of a single class of spindle microtubules. Step 1: The APC/CCdc20 targets for degradation different substrates, including the mitotic cyclin Clb4 and the securin Pds1. Step 2: Clb4 degradation by de-phosphorylating—directly or indirectly—the kinesin-like protein Kip2 promotes aMT stabilization. Instead, Pds1 degradation unleashes the separase Esp1. Step 3: Esp1 cleaves the cohesin subunit Scc1 and activates the Cdk-counteracting phosphatase Cdc14; meanwhile, kMTs retract to the poles. Step 4: Cdc14-mediated de-phosphorylation of different motors and MAPs triggers stabilization of iMTs.

References

    1. Akiyoshi, B., Sarangapani K.K., Powers A.F., Nelson C.R., Reichow S.L., Arellano-santoyo H., Gonen T., Ranish J.A., Asbury C.L., and Biggins S.. 2010. Tension directly stabilizes reconstituted kinetochore- microtubule attachments. Nature. 468:576–579. 10.1038/nature09594 - DOI - PMC - PubMed
    1. Amon, A. 2002. Synchronization procedures. Methods Enzymol. 351:457–467. 10.1016/s0076-6879(02)51864-4 - DOI - PubMed
    1. Asbury, C.L. 2017. Anaphase A: Disassembling microtubules move chromosomes toward spindle Poles. Biology. 6:15. 10.3390/biology6010015 - DOI - PMC - PubMed
    1. Avunie-Masala, R., Movshovich N., Nissenkorn Y., Gerson-Gurwitz A., Fridman V., Koivomagi M., Loog M., Hoyt M.A., Zaritsky A., and Gheber L.. 2011. Phospho-regulation of kinesin-5 during anaphase spindle elongation. J. Cell Sci. 124:873–878. 10.1242/jcs.077396 - DOI - PMC - PubMed
    1. Baskerville, C., Segal M., and Reed S.I.. 2008. The protease activity of yeast separase (Esp1) is required for anaphase spindle elongation independently of its role in cleavage of cohesin. Genetics. 178:2361–2372. 10.1534/genetics.107.085308 - DOI - PMC - PubMed

Publication types