. 2022 Oct 21;17(10):e0276638.
doi: 10.1371/journal.pone.0276638. eCollection 2022.

Effects of a farm-specific fecal microbial transplant (FMT) product on clinical outcomes and fecal microbiome composition in preweaned dairy calves

Affiliations

Effects of a farm-specific fecal microbial transplant (FMT) product on clinical outcomes and fecal microbiome composition in preweaned dairy calves

Giovana S Slanzon et al. PLoS One. .

Abstract

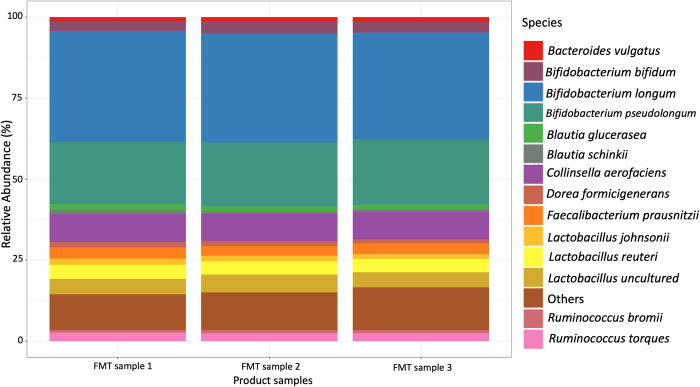
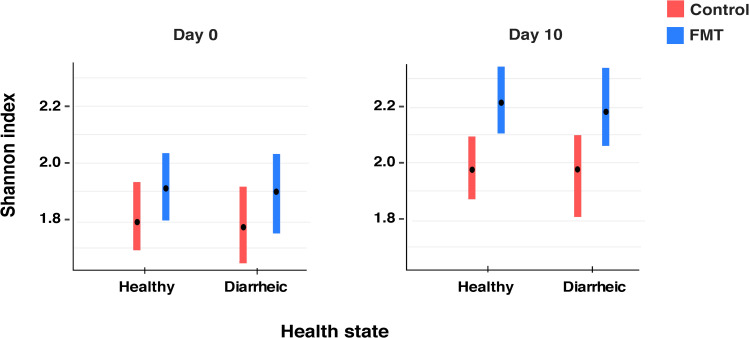
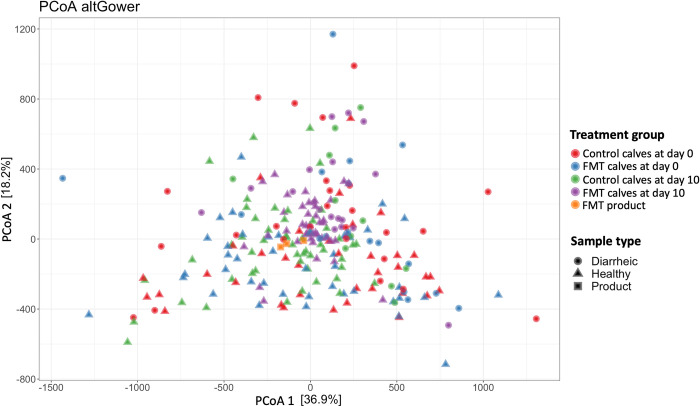
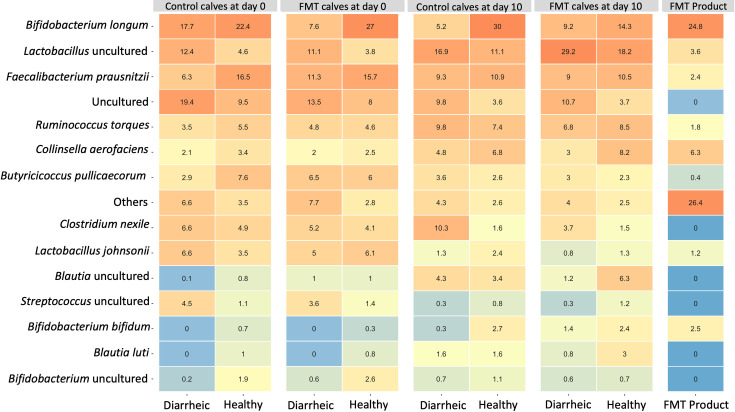
Gastrointestinal disease (GI) is the most common illness in pre-weaned dairy calves. Therefore, effective strategies to manipulate the microbiome of dairy calves under commercial dairy operations are of great importance to improve animal health and reduce antimicrobial usage. The objective of this study was to develop a farm-specific FMT product and to investigate its effects on clinical outcomes and fecal microbial composition of dairy calves. The FMT product was derived from feces from healthy donors (5-24 days of age) raised in the same calf ranch facility as the FMT recipients. Healthy and diarrheic calves were randomly enrolled to a control (n = 115) or FMT (n = 112) treatment group (~36 g of processed fecal matter once daily for 3 days). Fecal samples were collected at enrollment and again 9 days later after the first FMT dose. Although the FMT product was rich in organisms typically known for their beneficial probiotic properties, the FMT therapy did not prevent or ameliorate GI disease in dairy calves. In fact, calves that received FMT were less likely to recover from GI disease, and more likely to die due to GI disease complications. Fecal microbial community analysis revealed an increase in the alpha-diversity in FMT calves; however, no major differences across treatment groups were observed in the beta-diversity analysis. Calves that received FMT had higher relative abundance of an uncultured organism of the genus Lactobacillus and Lactobacillus reuteri on day 10. Moreover, FMT calves had lower relative abundance of Clostridium nexile and Bacteroides vulgatus on day 10. Our results indicate the need to have an established protocol when developing FMT products, based on rigorous inclusion and exclusion criteria for the selection of FMT donors free of potential pathogens, no history of disease or antibiotic treatment.


Conflict of interest statement

The authors have declared that no competing interests exist.

Figures

Fig 1
Fig 1. Relative abundance of three FMT product samples at species level.
Fig 2
Fig 2. Alpha-diversity analysis using Shannon index.
Samples were grouped by treatment and health status. Day 0 reflects the day of enrollment when calves were first sampled and FMT calves received their first dose of FMT. Day 10 reflects the second sampling time, 9 days after enrollment of both groups. The bars indicate the 95% confidence intervals.
Fig 3
Fig 3. Venn diagram to assess species that were shared between calves that did or did not receive FMT.
The different colors represent the different samples: FMT product, day 10 samples from calves that received FMT previously (day10_FMT), and samples from calves that did not receive FMT (day10_Control).
Fig 4
Fig 4. Principal coordinates analysis (PCoA) based on Gower distances grouped by treatment group and health status.
Proportion of variance explained by each principal coordinate axis is denoted in the corresponding axis label. Samples were grouped by treatment groups. The different shapes indicate the calf health status at the time of sampling.
Fig 5
Fig 5. Relative abundance heatmap.
The relative abundance of each species across groups is indicated by the values in the tiles. The color gradient indicates different levels of relative abundance.

Similar articles

Cited by

References

    1. Gupta S, Allen-Vercoe E, Petrof EO. Fecal microbiota transplantation: in perspective. Therapeutic advances in gastroenterology. 2016;9(2):229–39. Epub 2016/03/02. doi: 10.1177/1756283X15607414 ; PubMed Central PMCID: PMC4749851. - DOI - PMC - PubMed
    1. Thursby E, Juge N. Introduction to the human gut microbiota. Biochem J. 2017;474(11):1823–36. doi: 10.1042/BCJ20160510 . - DOI - PMC - PubMed
    1. Bäumler AJ, Sperandio V. Interactions between the microbiota and pathogenic bacteria in the gut. Nature. 2016;535(7610):85–93. doi: 10.1038/nature18849 . - DOI - PMC - PubMed
    1. den Besten G, van Eunen K, Groen AK, Venema K, Reijngoud D-J, Bakker BM. The role of short-chain fatty acids in the interplay between diet, gut microbiota, and host energy metabolism. J Lipid Res. 2013;54(9):2325–40. Epub 2013/07/02. doi: 10.1194/jlr.R036012 . - DOI - PMC - PubMed
    1. Natividad JMM, Verdu EF. Modulation of intestinal barrier by intestinal microbiota: Pathological and therapeutic implications. Pharmacol Res. 2013;69(1):42–51. doi: 10.1016/j.phrs.2012.10.007 - DOI - PubMed

Publication types

Substances