. 2022 Oct 21;18(10):e1010623.
doi: 10.1371/journal.pcbi.1010623. eCollection 2022 Oct.

Stochastic dynamics of Type-I interferon responses

Affiliations

Stochastic dynamics of Type-I interferon responses

Benjamin D Maier et al. PLoS Comput Biol. .

Abstract

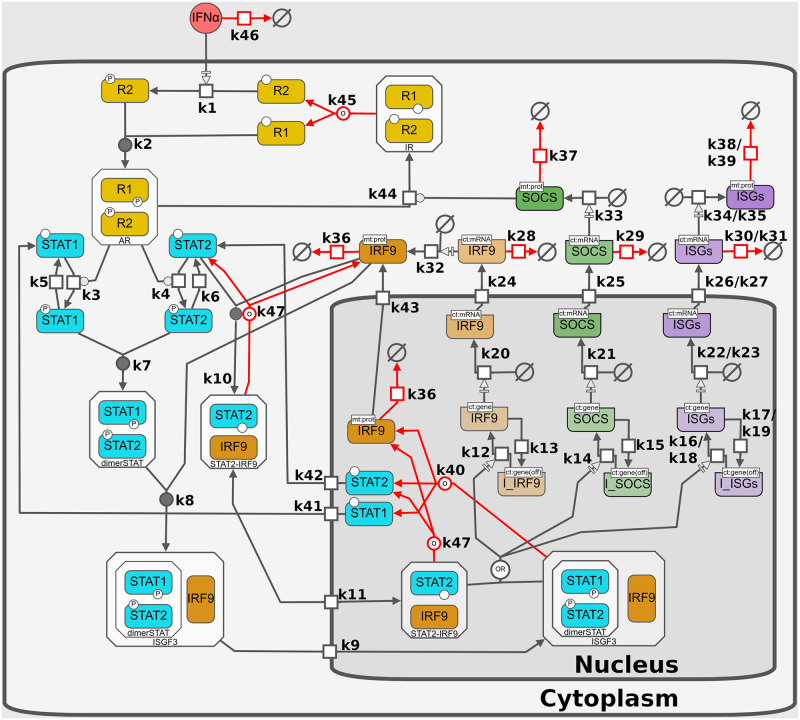
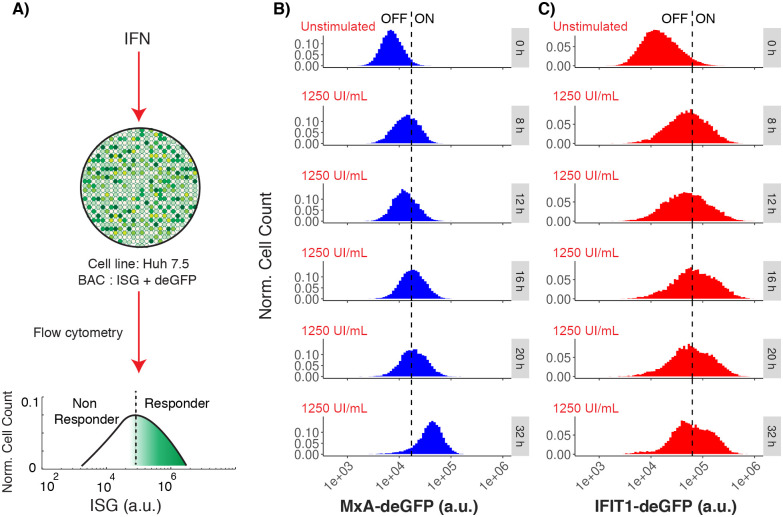
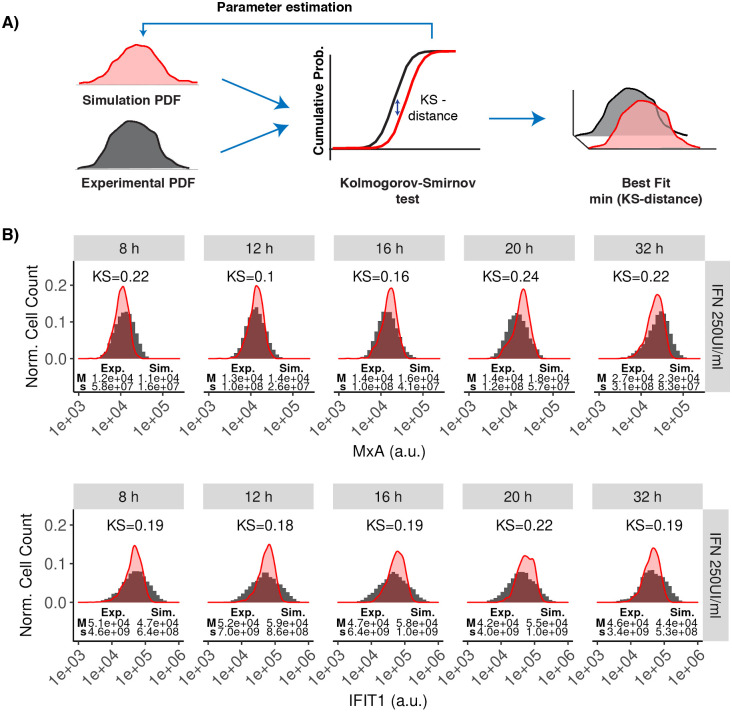
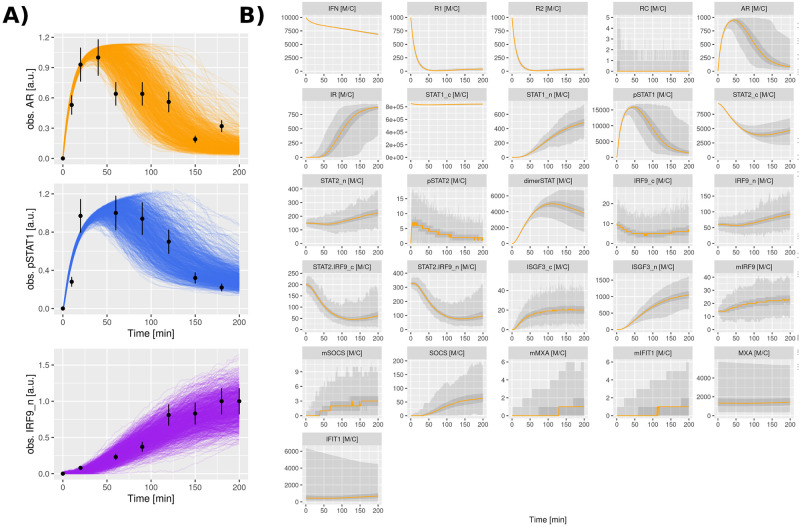
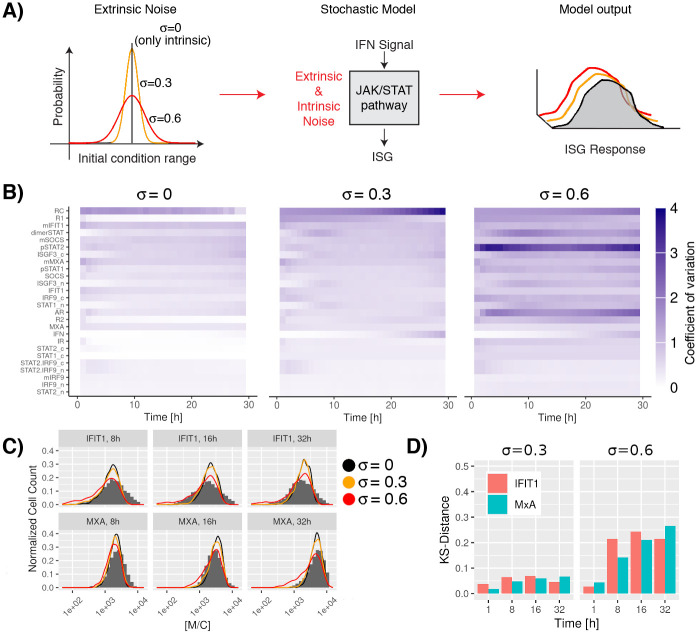
Interferon (IFN) activates the transcription of several hundred of IFN stimulated genes (ISGs) that constitute a highly effective antiviral defense program. Cell-to-cell variability in the induction of ISGs is well documented, but its source and effects are not completely understood. The molecular mechanisms behind this heterogeneity have been related to randomness in molecular events taking place during the JAK-STAT signaling pathway. Here, we study the sources of variability in the induction of the IFN-alpha response by using MxA and IFIT1 activation as read-out. To this end, we integrate time-resolved flow cytometry data and stochastic modeling of the JAK-STAT signaling pathway. The complexity of the IFN response was matched by fitting probability distributions to time-course flow cytometry snapshots. Both, experimental data and simulations confirmed that the MxA and IFIT1 induction circuits generate graded responses rather than all-or-none responses. Subsequently, we quantify the size of the intrinsic variability at different steps in the pathway. We found that stochastic effects are transiently strong during the ligand-receptor activation steps and the formation of the ISGF3 complex, but negligible for the final induction of the studied ISGs. We conclude that the JAK-STAT signaling pathway is a robust biological circuit that efficiently transmits information under stochastic environments.


Conflict of interest statement

The authors have declared that no competing interests exist.

Figures

Fig 1
Fig 1. IFN activation of the JAK-STAT signaling pathway.
Free IFN binds to the IFNAR subunits 1 and 2 to form an active complex. After IFNAR activation the signal is transduced inside the cytoplasm; here STAT1 and STAT2 are phosphorylated. Phosphorylated forms of STAT1 and STAT2 form a heterodimer (dimerSTAT). dimerSTAT interacts with IRF9 to form ISGF3 (a trimolecular complex). ISGF3 translocates to the nucleus. In the nucleus, ISGF3 binds to free transcription factor binding sites (ISRE), inducing transcriptional activity leading to production of more IRF9 as a positive feedback and SOCS as a negative feedback given by the SOCS1 degradation of active receptors. ISGF3 induces the expression of around 350 different ISGs, including MxA and IFIT1. Additionally, there is a constitutive formation of STAT2-IRF9 heterodimers, that stimulate the expression of interferon-induced genes (ISGs) without a signaling requirement (basal expression). The model consists of 42 species in two compartments and 62 kinetic reactions and is fully described in the methods section. In the figure, boxes represent the chemical species, empty symbols represent degradation processes, arrows represent the reactions described in Section B.1 in S1 Text, initial conditions and parameters are given in Tables 1, 2 and 3, respectively. The pathway diagram was created with the Newt Editor [26, 27] following the Systems Biology Graphical Notation (SBGN) [28].
Fig 2
Fig 2. ISG induction after IFN stimulation.
A: Experimental set-up showing the graded expression of MxA and IFIT1 after IFN-α stimulation in a population of Huh7.5 cells. A threshold is defined to differentiate responder vs. non-responder cells in the population. B: Distributions represent the flow cytometry measurements of MxA expression at different time points after IFN stimulation (blue distribution). C: Distributions represent the flow cytometry measurements of IFIT1 expression at different time points after IFN stimulation (red distribution). In figures B and C, the vertical dashed lines represents a threshold value (defined as the mean plus two standard deviations) calculated form the unstimulated populations. This threshold value is used to differentiate responser vs non-responder cells in a cell population with a graded response. In the observed treatments, the mean fluorescence level shifts from 8x10³ a.u. (arbitrary units of fluorescence) to 4.5x10⁴ a.u. for MxA, and from 2x10⁴ to 9x10⁴ a.u. for IFIT1.
Fig 3
Fig 3. Fitting single-cell data to the stochastic model.
A: The parameter estimation strategy consist of optimization routines based on genetic algorithms. The proposed methods measure the similitude between experimental and simulated distributions using KS-distance. The best parameters are obtained by minimizing the KS-distance. The full strategy for parameter estimation is given in the Section C in S1 Text. B: Experimental time-dependent distributions were computed from the flow cytometry datasets (filled histograms). Simulated time-dependent distributions were computed by solving our model under stochastic dynamics and repeating the simulations 1,000 times (red density plots). In the plots, the y-axis represents the normalized cell count and the x-axis represents the fluorescence quantity (arbitrary units, a.u.) associated with the expression of the MxA and IFIT1 proteins at various time points after stimulating Huh7.5 cells with 250 UI/mL IFN (5,000 IFN molecules). For each distribution, the median (M) and variance (s) is given. The initial conditions are given in Table 1, fitted parameter values are given in Table 2 and compartment sizes are given in Table 3. See Figs H and I in S1 Text for fits using different IFN doses.
Fig 4
Fig 4. Model temporal dynamics and cell population data.
A: Cell population data describing the temporal dynamics of phosphorylated JAK1, pSTAT1 and nuclear IRF9. Experimental data describe quantitative immunoblotting measurements in Huh7.5 cells after stimulation with 500 UI/mL of IFN-α at different time points for a total time of 180 min [4]. Measurement error of 18% is represented in the figures as error bars. Model dynamics were obtained by repeating the stochastic simulation 1,000 times, each trajectory representing a single cell. The procedure for mapping the model variables and experimental data is given in Section C.1 in S1 Text. B: Time courses data describing the temporal dynamics of all species involved in the JAK-STAT signaling pathway. The plots represent the repetitions of the stochastic model. The y-axis has units of Molecules per Cell (M/C). Orange lines represent the median, while light gray display the range of values and dark gray ribbons contain 50% of the values. The ribbons may not be visible if there is almost no variation (e.g. IFN) or if there is no particle present for the majority of trajectories (e.g. mIRF9n).
Fig 5
Fig 5. Effect of extrinsic noise in the JAK-STAT signaling pathway.
A: Extrinsic noise in the system was introduced by considering the effect of variability in the initial copy number of the proteins in the pathway. Initial conditions were generated by random sampling using a normal distribution N(μ,σ2) with values for μ given in Table 1 and one of three values of σ: 0, 0.3, 0.6. B: Variability in the elements of the JAK-STAT signaling pathway over time. The effects of extrinsic noise in the system were calculated by the coefficient of variation (cv = σS/(μS + 0.1), where the subindex s represents the species in the pathway). In the plot the colorbar varies between 0 (white color) and larger than 4 (blue color), dark colors represent high variability in the dynamics of the studied species. Species were ordered based on the average coefficient of variation over all time points for systems with an extrinsic noise of σ = 0.3. The overall system dynamics under the influence of extrinsic noise can also be observed in Figs J to L in S1 Text. C: Stochastic simulations of different time points after IFN stimulation using a distribution of values as initial conditions. The results show a transient perturbation in the MxA and IFIT1 expression when extrinsic fluctuations are considered. As reference, experimental data for a system without extrinsic noise (σ = 0.0) are given (gray histograms). D: Distributions at multiple time points considering different strengths of extrinsic noise vs a system with only intrinsic noise are compared using the Kolmogorov-Smirnov distance.
Fig 6
Fig 6. Parameter robustness assay.
Parameters were altered between half (0.5 * k) and double (2.0 * k) their original values individually to determine to what extent the evaluated system functionality is preserved under considered perturbations. The effect on the ISG induction was quantified by repeating the stochastic simulation 600 times and computing the KS-distance to the unpertubated system.
Fig 7
Fig 7. Signal transduction under pertubations.
Parameters were altered between half (0.5 * k) and double (2.0 * k) their original values individually to determine which parameters prevent reliable transduction of the signal from receptor to gene expression under considered perturbations. The effect on the ISG induction was quantified by repeating the stochastic simulation 600 times and computing the relative change in IFIT and MxA molecules to the unpertubated system.

References

    1. Horner SM, Gale M Jr. Regulation of hepatic innate immunity by hepatitis C virus. Nature medicine. 2013;19(7):879–888. doi: 10.1038/nm.3253 - DOI - PMC - PubMed
    1. Hertzog PJ, Williams BR. Fine tuning type I interferon responses. Cytokine & growth factor reviews. 2013;24(3):217–225. doi: 10.1016/j.cytogfr.2013.04.002 - DOI - PubMed
    1. Ivashkiv LB, Donlin LT. Regulation of type I interferon responses. Nature reviews Immunology. 2014;14(1):36–49. doi: 10.1038/nri3581 - DOI - PMC - PubMed
    1. Maiwald T, Schneider A, Busch H, Sahle S, Gretz N, Weiss TS, et al.. Combining theoretical analysis and experimental data generation reveals IRF9 as a crucial factor for accelerating interferon α-induced early antiviral signalling. FEBS journal. 2010;277(22):4741–4754. doi: 10.1111/j.1742-4658.2010.07880.x - DOI - PubMed
    1. Platanitis E, Demiroz D, Schneller A, Fischer K, Capelle C, Hartl M, et al.. A molecular switch from STAT2-IRF9 to ISGF3 underlies interferon-induced gene transcription. Nature Communications. 2019. doi: 10.1038/s41467-019-10970-y - DOI - PMC - PubMed

MeSH terms