. 2022 Oct 28;7(76):eabo0981.
doi: 10.1126/sciimmunol.abo0981. Epub 2022 Oct 21.

The ZFP36 family of RNA binding proteins regulates homeostatic and autoreactive T cell responses

Affiliations

The ZFP36 family of RNA binding proteins regulates homeostatic and autoreactive T cell responses

Melissa E Cook et al. Sci Immunol. .

Abstract

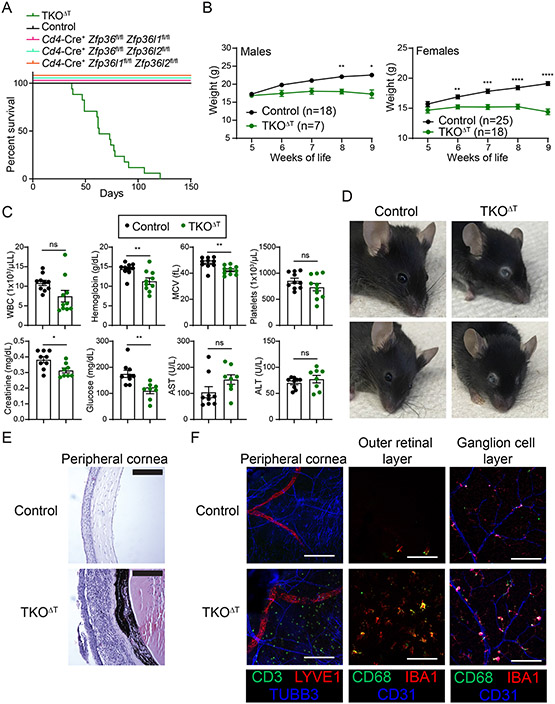
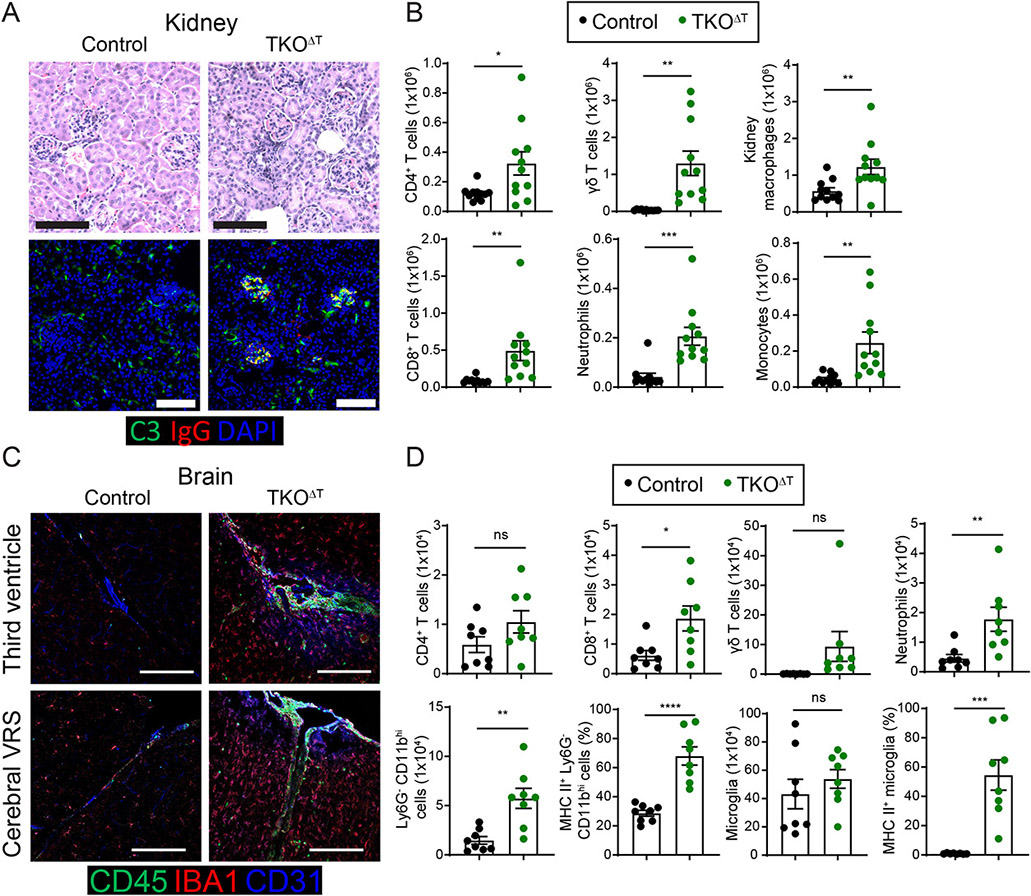
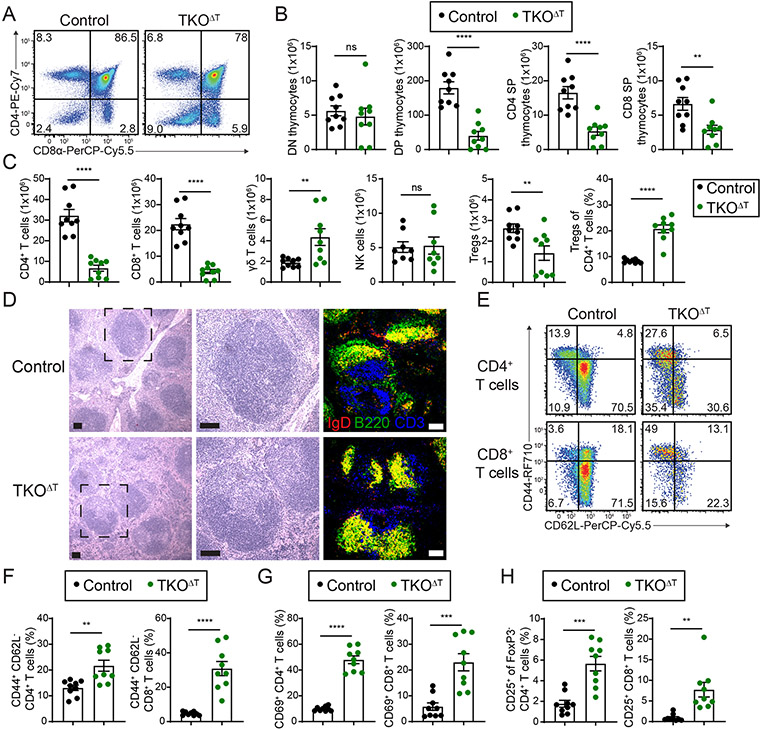
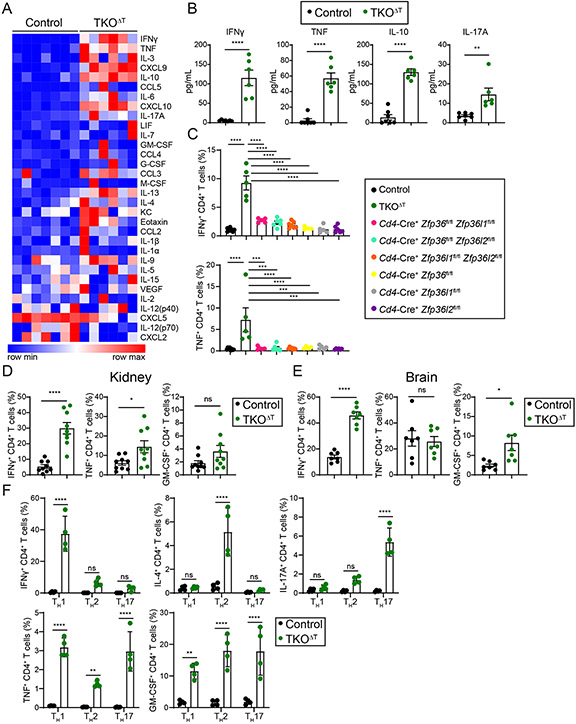
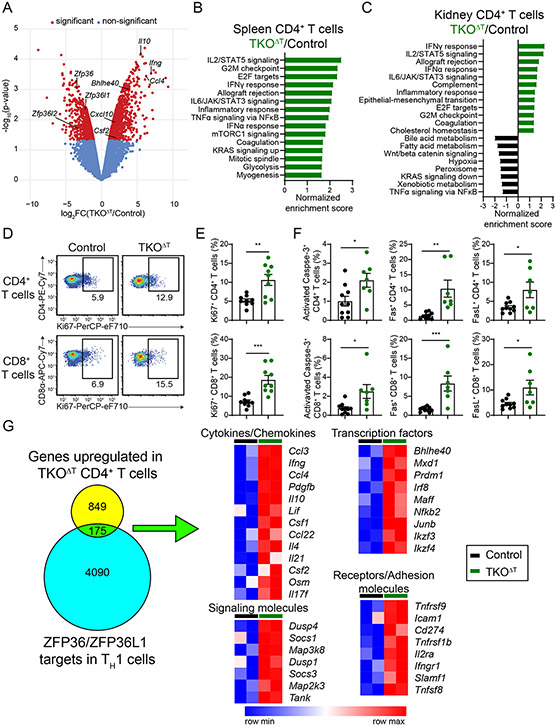
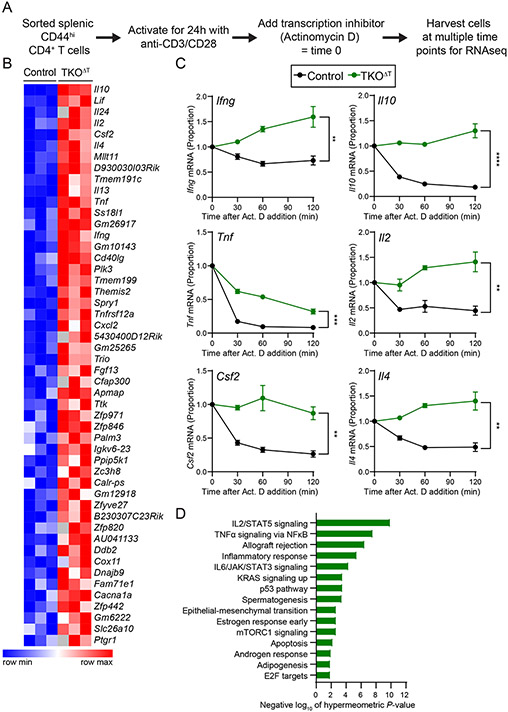
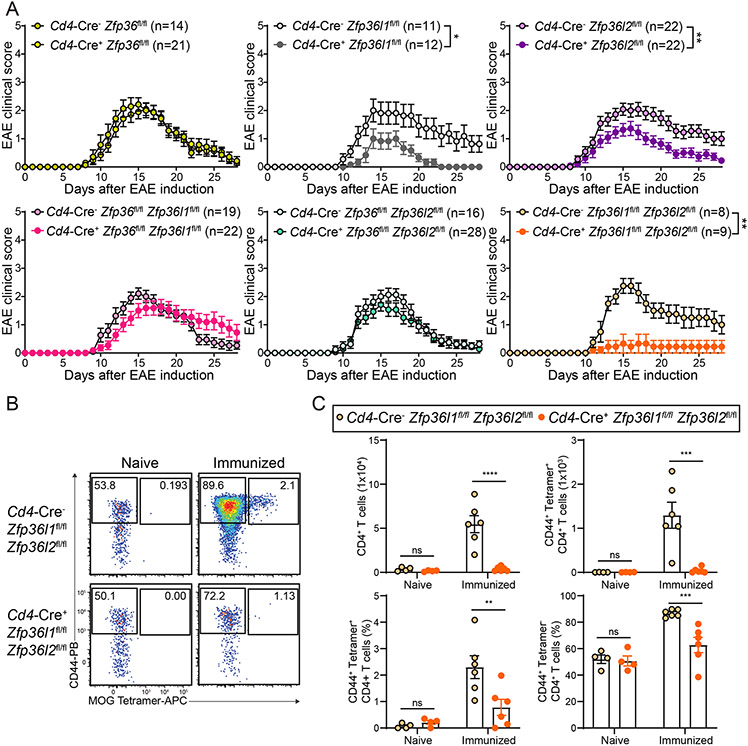
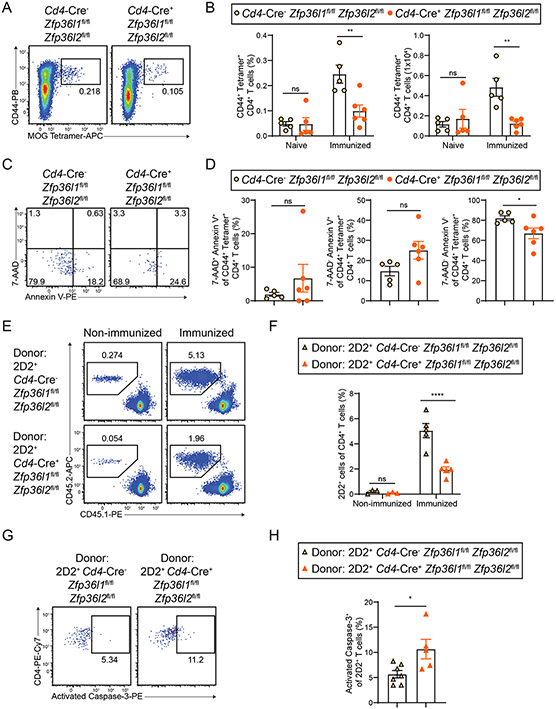
RNA binding proteins are important regulators of T cell activation, proliferation, and cytokine production. The zinc finger protein 36 (ZFP36) family genes (Zfp36, Zfp36l1, and Zfp36l2) encode RNA binding proteins that promote the degradation of transcripts containing AU-rich elements. Numerous studies have demonstrated both individual and shared functions of the ZFP36 family in immune cells, but their collective function in T cells remains unclear. Here, we found a redundant and critical role for the ZFP36 proteins in regulating T cell quiescence. T cell-specific deletion of all three ZFP36 family members in mice resulted in early lethality, immune cell activation, and multiorgan pathology characterized by inflammation of the eyes, central nervous system, kidneys, and liver. Mice with T cell-specific deletion of any two Zfp36 genes were protected from this spontaneous syndrome. Triply deficient T cells overproduced proinflammatory cytokines, including IFN-γ, TNF, and GM-CSF, due to increased mRNA stability of these transcripts. Unexpectedly, T cell-specific deletion of both Zfp36l1 and Zfp36l2 rendered mice resistant to experimental autoimmune encephalomyelitits due to failed priming of antigen-specific CD4+ T cells. ZFP36L1 and ZFP36L2 double-deficient CD4+ T cells had poor proliferation during in vitro T helper cell polarization. Thus, the ZFP36 family redundantly regulates T cell quiescence at homeostasis, but ZFP36L1 and ZFP36L2 are specifically required for antigen-specific T cell clonal expansion.


Figures

Figure 1:
Figure 1:. TKOΔT mice exhibit spontaneous mortality and ocular pathology.
A, Survival curves in the indicated mice at homeostasis (n=6-18/group). B, Control and TKOΔT mice were weighed weekly (n=7-25/group). C, Blood and sera were collected from Control and TKOΔT mice for CBCs and the indicated chemistry tests (pooled from 2 experiments, n=8-10/group). D, Photographs of the gross ocular phenotype in TKOΔT mice. Two representative mice from each genotype are shown. E, H&E staining on corneas from Control and TKOΔT eyes. Scale bar is 50 μm. F, Immunofluorescent staining of different eye regions of Control and TKOΔT mice. The peripheral cornea was stained with anti-CD3 (green), anti-LYVE1 (red), and anti-TUBB3 (blue), and the outer retinal layer and ganglion cell layer were stained with anti-CD68 (green), anti-IBA1 (red), and anti-CD31 (blue). Scale bar is 100 μm. Data in B,C are mean ± s.e.m. Two-way ANOVA with Šídák’s multiple comparisons test (B); unpaired two-sided Student’s t-test (C). *P < 0.05; **P < 0.01; ***P < 0.001; ****P < 0.001; ns, not significant.
Figure 2:
Figure 2:. Broad immune cell activation and infiltration into peripheral organs of TKOΔT mice.
A, Top: H&E staining of kidney sections from Control and TKOΔT mice. Bottom: Complement C3 (green), mouse IgG (red), and DAPI (blue) immunofluorescent staining of kidneys from Control and TKOΔT mice. B, Quantitation of kidney CD4+ T cells (F4/80 Ly6Clow CD11blow TCRγδ TCRβ+ CD4+), CD8+ T cells (F4/80 Ly6Clow CD11blow TCRγδ TCRβ+ CD8α+), γδ T cells (F4/80 Ly6Clow CD11blow TCRβ TCRγδ+), neutrophils (F4/80 Ly6Chi CD11bint Ly6G+), kidney macrophages (F4/80+ Ly6C MHC II+), and monocytes (F4/80 Ly6Cint CD11b+) in Control and TKOΔT mice (pooled from 6 experiments, n=11/group). C, CD45 (green), IBA1 (red) and CD31 (blue) immunofluorescent staining of brains from Control and TKOΔT mice at the third ventricle (top) and a cerebral Virchow-Robin space (VRS) (bottom). Scale bar is 100 μm. D, Quantitation of brain CD4+ T cells (CD45+ CD11blow TCR γδ TCRβ+ CD4+), CD8+ T cells (CD45+ CD11blow TCR γδ TCRβ+ CD8α+), γδ T cells (CD45+ CD11blow TCRβ TCR γδ+), neutrophils (CD45+ CD11bhi Ly6G+), Ly6G CD11bhi cells (CD45+ CD11bhi Ly6G), MHC II+ Ly6G CD11bhi cells, microglia (CD45int CD11bint), and MHC II+ microglia in Control and TKOΔT mice (pooled from 4 experiments, n=8/group). Data in B,D are mean ± s.e.m. Unpaired two-sided Student’s t-test. *P < 0.05; **P < 0.01; ***P < 0.001; ****P < 0.001; ns, not significant.
Figure 3:
Figure 3:. T cell lymphopenia and T cell activation in TKOΔT mice.
A, CD4 and CD8α staining of thymocytes (pre-gated as Ly6G NK1.1 CD19 TCRγδ CD11b) from Control and TKOΔT mice. B, Quantitation of CD4 CD8α (double negative, DN), CD4+ CD8α+ (double positive, DP), CD4+ CD8α (CD4 single positive, CD4 SP), and CD4 CD8α+ (CD8α single positive, CD8 SP) thymocytes (pooled from 5 experiments, n=9/group). C, Quantitation of the indicated splenic populations in Control and TKOΔT mice: CD4+ T cells, CD8+ T cells, γδ T cells, NK cells (NK1.1+ TCRβ), and the number and frequency of Tregs (TCRβ+ CD4+ CD25+ FoxP3+) (pooled from 5 experiments, n=8-9/group). D, H&E and immunofluorescent staining of spleens from Control and TKOΔT mice. Left: low magnification view of H&E stained spleen. Middle: high magnification view of the dashed black box. Right: Immunofluorescent staining for CD3 (blue), B220 (green), and IgD (red) of spleens from Control and TKOΔT mice. Scale bar is 100 μm. E, CD44 and CD62L staining of splenic CD4+ and CD8+ T cells from Control and TKOΔT mice. F-H, Quantitation of the percentage of (F) CD44+ CD62L CD4+ and CD8+ T cells, (G) CD69+ CD4+ and CD8+ T cells, and (H) CD25+ FoxP3 CD4+ and CD25+ CD8+ T cells in the spleens of indicated mice (pooled from 5 experiments, n=9/group). Data in B,C,F-H are mean ± s.e.m; unpaired two-sided Student’s t-test. *P < 0.05; **P < 0.01; ***P < 0.001; ****P < 0.001; ns, not significant.
Figure 4:
Figure 4:. Hypercytokinemia in TKOΔT mice.
A, Heat map of serum cytokines and chemokines from Control and TKOΔT mice (n=6-7/group). B, Concentration of IFNγ, TNF, IL-10, and IL-17A in the sera of Control and TKOΔT mice (n=6-7/group). C, Quantitation of IFNγ+ and TNF+ CD4+ T cells from the indicated mice determined by ICS of bulk splenocytes cultured for 4 h with Brefeldin A (pooled from 4 experiments, n=5-8/group). D,E, Quantitation of IFNγ+, TNF+, and GM-CSF+ CD4+ T cells from the (D) kidney (pooled from 5 experiments, n=9/group) and (E) brain (pooled from 4 experiments, n=7/group) of Control and TKOΔT mice. F, CD4+ splenic T cells were polarized in different TH conditions. On day 4, cells were cultured for 4 h with Brefeldin A before ICS for IFNγ, IL-4, IL-17A, TNF, and GM-CSF (pooled from 2 experiments, n=4/group). Data in B-F are mean ± s.e.m. Unpaired two-sided Student’s t-test (B,D,E); one-way ANOVA with Tukey’s multiple comparisons test (C), two-way ANOVA with Šídák’s multiple comparisons test (F). *P < 0.05; **P < 0.01; ***P < 0.001; ****P < 0.001; ns, not significant.
Figure 5:
Figure 5:. RNA-sequencing reveals inflammatory and proliferative pathways enriched in TKOΔT T cells.
A-C, RNA-sequencing of splenic and kidney CD4+ T cells from Control and TKOΔT mice (n=2/group). A, Volcano plot identifying differentially expressed genes between Control and TKOΔT splenic CD4+ T cells. Red dots indicate genes significantly differentially expressed (P-value < 0.05 and fold change ≥ 2). B,C, Hallmark pathways enriched in TKOΔT (B) splenic CD4+ T cells and (C) kidney CD4+ T cells by GSEA. If more than 15 pathways were statistically enriched, only the top 15 pathways are shown. D, Ki67 staining of splenic CD4+ and CD8+ T cells. E, Quantitation of Ki67+ CD4+ and CD8+ splenic T cells from Control and TKOΔT mice (pooled from 4 experiments, n=9/group). F, Quantitation of activated Caspase-3+, Fas+, and FasL+ CD4+ and CD8+ splenic T cells from Control and TKOΔT mice (pooled from 4 experiments, n=7-10/group). G, Left: Overlap of the 1024 genes upregulated in splenic CD4+ TKOΔT T cells with published ZFP36/ZFP36L1 mRNA targets in murine TH1 cells (GSE96074) (32). Right: Heat maps of gene expression of selected genes from the overlapping set. Data in E,F are mean ± s.e.m. Unpaired two-sided Student’s t-test. *P < 0.05; **P < 0.01; ***P < 0.001; ****P < 0.001; ns, not significant.
Figure 6:
Figure 6:. Increased cytokine gene transcript stability in TKOΔT CD4+ T cells.
A, Experimental schema. CD44hi CD4+ splenic T cells were sorted from Control and TKOΔT mice (n=3/group). Cells were then activated for 24 h on anti-CD3/CD28 coated cell culture plates at which point some cells were harvested (time 0) and some cells were treated with Actinomycin D (Act. D). At different times post-addition (30, 60, 120 min), cells were harvested for RNA-sequencing. B, Heat map representation of area under the curve (AUC) values for the top 50 most significant genes with increased AUC (P-value < 0.05) in TKOΔT CD4+ T cells compared to Control CD4+ T cells. C, mRNA decay curves for Ifng, Il10, Tnf, Il2, Csf2, and Il4. All time points are graphed as a fraction of the time 0 counts per million reads mapped. D, Enriched Hallmark pathways (FDR q-value < 0.05) in genes with increased AUC (P-value < 0.05) in TKOΔT CD4+ T cells compared to Control CD4+ T cells. Data in C are mean ± s.e.m. Unpaired two-sided Student’s t-test computed on the AUC. *P < 0.05; **P < 0.01; ***P < 0.001; ****P < 0.001; ns, not significant.
Figure 7:
Figure 7:. Cd4-Cre+ Zfp36l1fl/fl Zfp36l2fl/fl mice are protected from EAE.
A, Clinical EAE scoring in the indicated strains of mice. B, CD44 and MOG38-49-I-Ab Tetramer staining on CD4+ T cells from the CNS of naïve or MOG35-55 peptide immunized (day 14) Cd4-Cre Zfp36l1fl/fl Zfp36l2fl/fl and Cd4-Cre+ Zfp36l1fl/fl Zfp36l2fl/fl mice. C, Quantitation of CD4+ cells, CD44+ MOG38-49-I-Ab Tetramer+ CD4+ T cells, the frequency of CD44+ MOG38-49-I-Ab Tetramer+ CD4+ T cells, and the frequency of CD44+ MOG38-49-I-Ab Tetramer CD4+ T cells in the CNS of naïve (pooled from 2 experiments, n=4/group) or immunized (day 14) Cd4-Cre Zfp36l1fl/fl Zfp36l2fl/fl and Cd4-Cre+ Zfp36l1fl/fl Zfp36l2fl/fl mice (pooled from 2 experiments, n=6/group). Data in A,C are mean ± s.e.m. Mann-Whitney U test between area under the curve for individual mice (A); two-way ANOVA with Šídák’s multiple comparisons test (C). *P < 0.05; **P < 0.01; ***P < 0.001; ****P < 0.001; ns, not significant.
Figure 8:
Figure 8:. Deficient CD4+ T cell priming in Cd4-Cre+ Zfp36l1fl/fl Zfp36l2fl/fl mice.
A, CD44 and MOG38-49-I-Ab Tetramer staining on CD4+ T cells from the popliteal lymph nodes of MOG35-55 peptide immunized mice (day 7). B, Quantitation of the frequency and number of CD44+ MOG38-49-I-Ab Tetramer+ CD4+ T cells from the inguinal lymph nodes from naïve mice (pooled from 2 experiments, n=5/group) and the popliteal lymph nodes of MOG35-55 peptide immunized mice (day 7) (pooled from 2 experiments, n=5-6/group). C, 7-AAD and Annexin V staining on CD44+ MOG38-49-I-Ab Tetramer+ CD4+ T cells from the popliteal lymph nodes of MOG35-55 peptide immunized mice (day 7). D, Quantitation of necrotic (7-AAD+ Annexin V+), apoptotic (7-AAD Annexin V+), or live (7-AAD Annexin V) CD4+ T cells from the popliteal lymph nodes of Cd4-Cre Zfp36l1fl/fl Zfp36l2fl/fl and Cd4-Cre+ Zfp36l1fl/fl Zfp36l2fl/fl mice 7 days after MOG35-55 peptide immunization (pooled from 2 experiments, n=5-6/group). E, Staining of popliteal lymph nodes to identify donor 2D2+ T cells (CD45.2) and endogenous CD4+ T cells (CD45.1) gated on TCRβ+ CD4+ T cells on day 5 post-MOG35-55 hock immunization or in non-immunized mice. F, Quantitation of the frequency of popliteal lymph node donor 2D2+ T cells on day 5 post-MOG35-55 hock immunization or in non-immunized mice (pooled from 2 experiments, n=3-5/group). G, Activated Caspase-3 staining of popliteal lymph node donor 2D2+ T cells on day 3 post-MOG35-55 hock immunization. H, Quantitation of activated Caspase-3+ popliteal lymph node donor 2D2+ T cells on day 3 post-MOG35-55 hock immunization (pooled from 2 experiments, n=5-7). Data in B,D,E,H are mean ± s.e.m. Two-way ANOVA with Šídák’s multiple comparisons test (B,F); unpaired two-sided Student’s t-test (D,H). *P < 0.05; **P < 0.01; ***P < 0.001; ****P < 0.001; ns, not significant.

References

    1. Anderson P, Post-transcriptional control of cytokine production. Nat Immunol 9, 353–359 (2008). - PubMed
    1. Kontoyiannis D, Pasparakis M, Pizarro TT, Cominelli F, Kollias G, Impaired on/off regulation of TNF biosynthesis in mice lacking TNF AU-rich elements: implications for joint and gut-associated immunopathologies. Immunity 10, 387–398 (1999). - PubMed
    1. Hodge DL, Berthet C, Coppola V, Kastenmüller W, Buschman MD, Schaughency PM, Shirota H, Scarzello AJ, Subleski JJ, Anver MR, Ortaldo JR, Lin F, Reynolds DA, Sanford ME, Kaldis P, Tessarollo L, Klinman DM, Young HA, IFN-gamma AU-rich element removal promotes chronic IFN-gamma expression and autoimmunity in mice. J Autoimmun 53, 33–45 (2014). - PMC - PubMed
    1. Matsushita K, Takeuchi O, Standley DM, Kumagai Y, Kawagoe T, Miyake T, Satoh T, Kato H, Tsujimura T, Nakamura H, Akira S, Zc3h12a is an RNase essential for controlling immune responses by regulating mRNA decay. Nature 458, 1185–1190 (2009). - PubMed
    1. Uehata T, Iwasaki H, Vandenbon A, Matsushita K, Hernandez-Cuellar E, Kuniyoshi K, Satoh T, Mino T, Suzuki Y, Standley DM, Tsujimura T, Rakugi H, Isaka Y, Takeuchi O, Akira S, Malt1-induced cleavage of regnase-1 in CD4(+) helper T cells regulates immune activation. Cell 153, 1036–1049 (2013). - PubMed

Publication types