. 2022 Nov 14;40(11):1392-1406.e7.
doi: 10.1016/j.ccell.2022.09.015. Epub 2022 Oct 20.

Multiomic analysis reveals conservation of cancer-associated fibroblast phenotypes across species and tissue of origin

Affiliations

Multiomic analysis reveals conservation of cancer-associated fibroblast phenotypes across species and tissue of origin

Deshka S Foster et al. Cancer Cell. .

Abstract

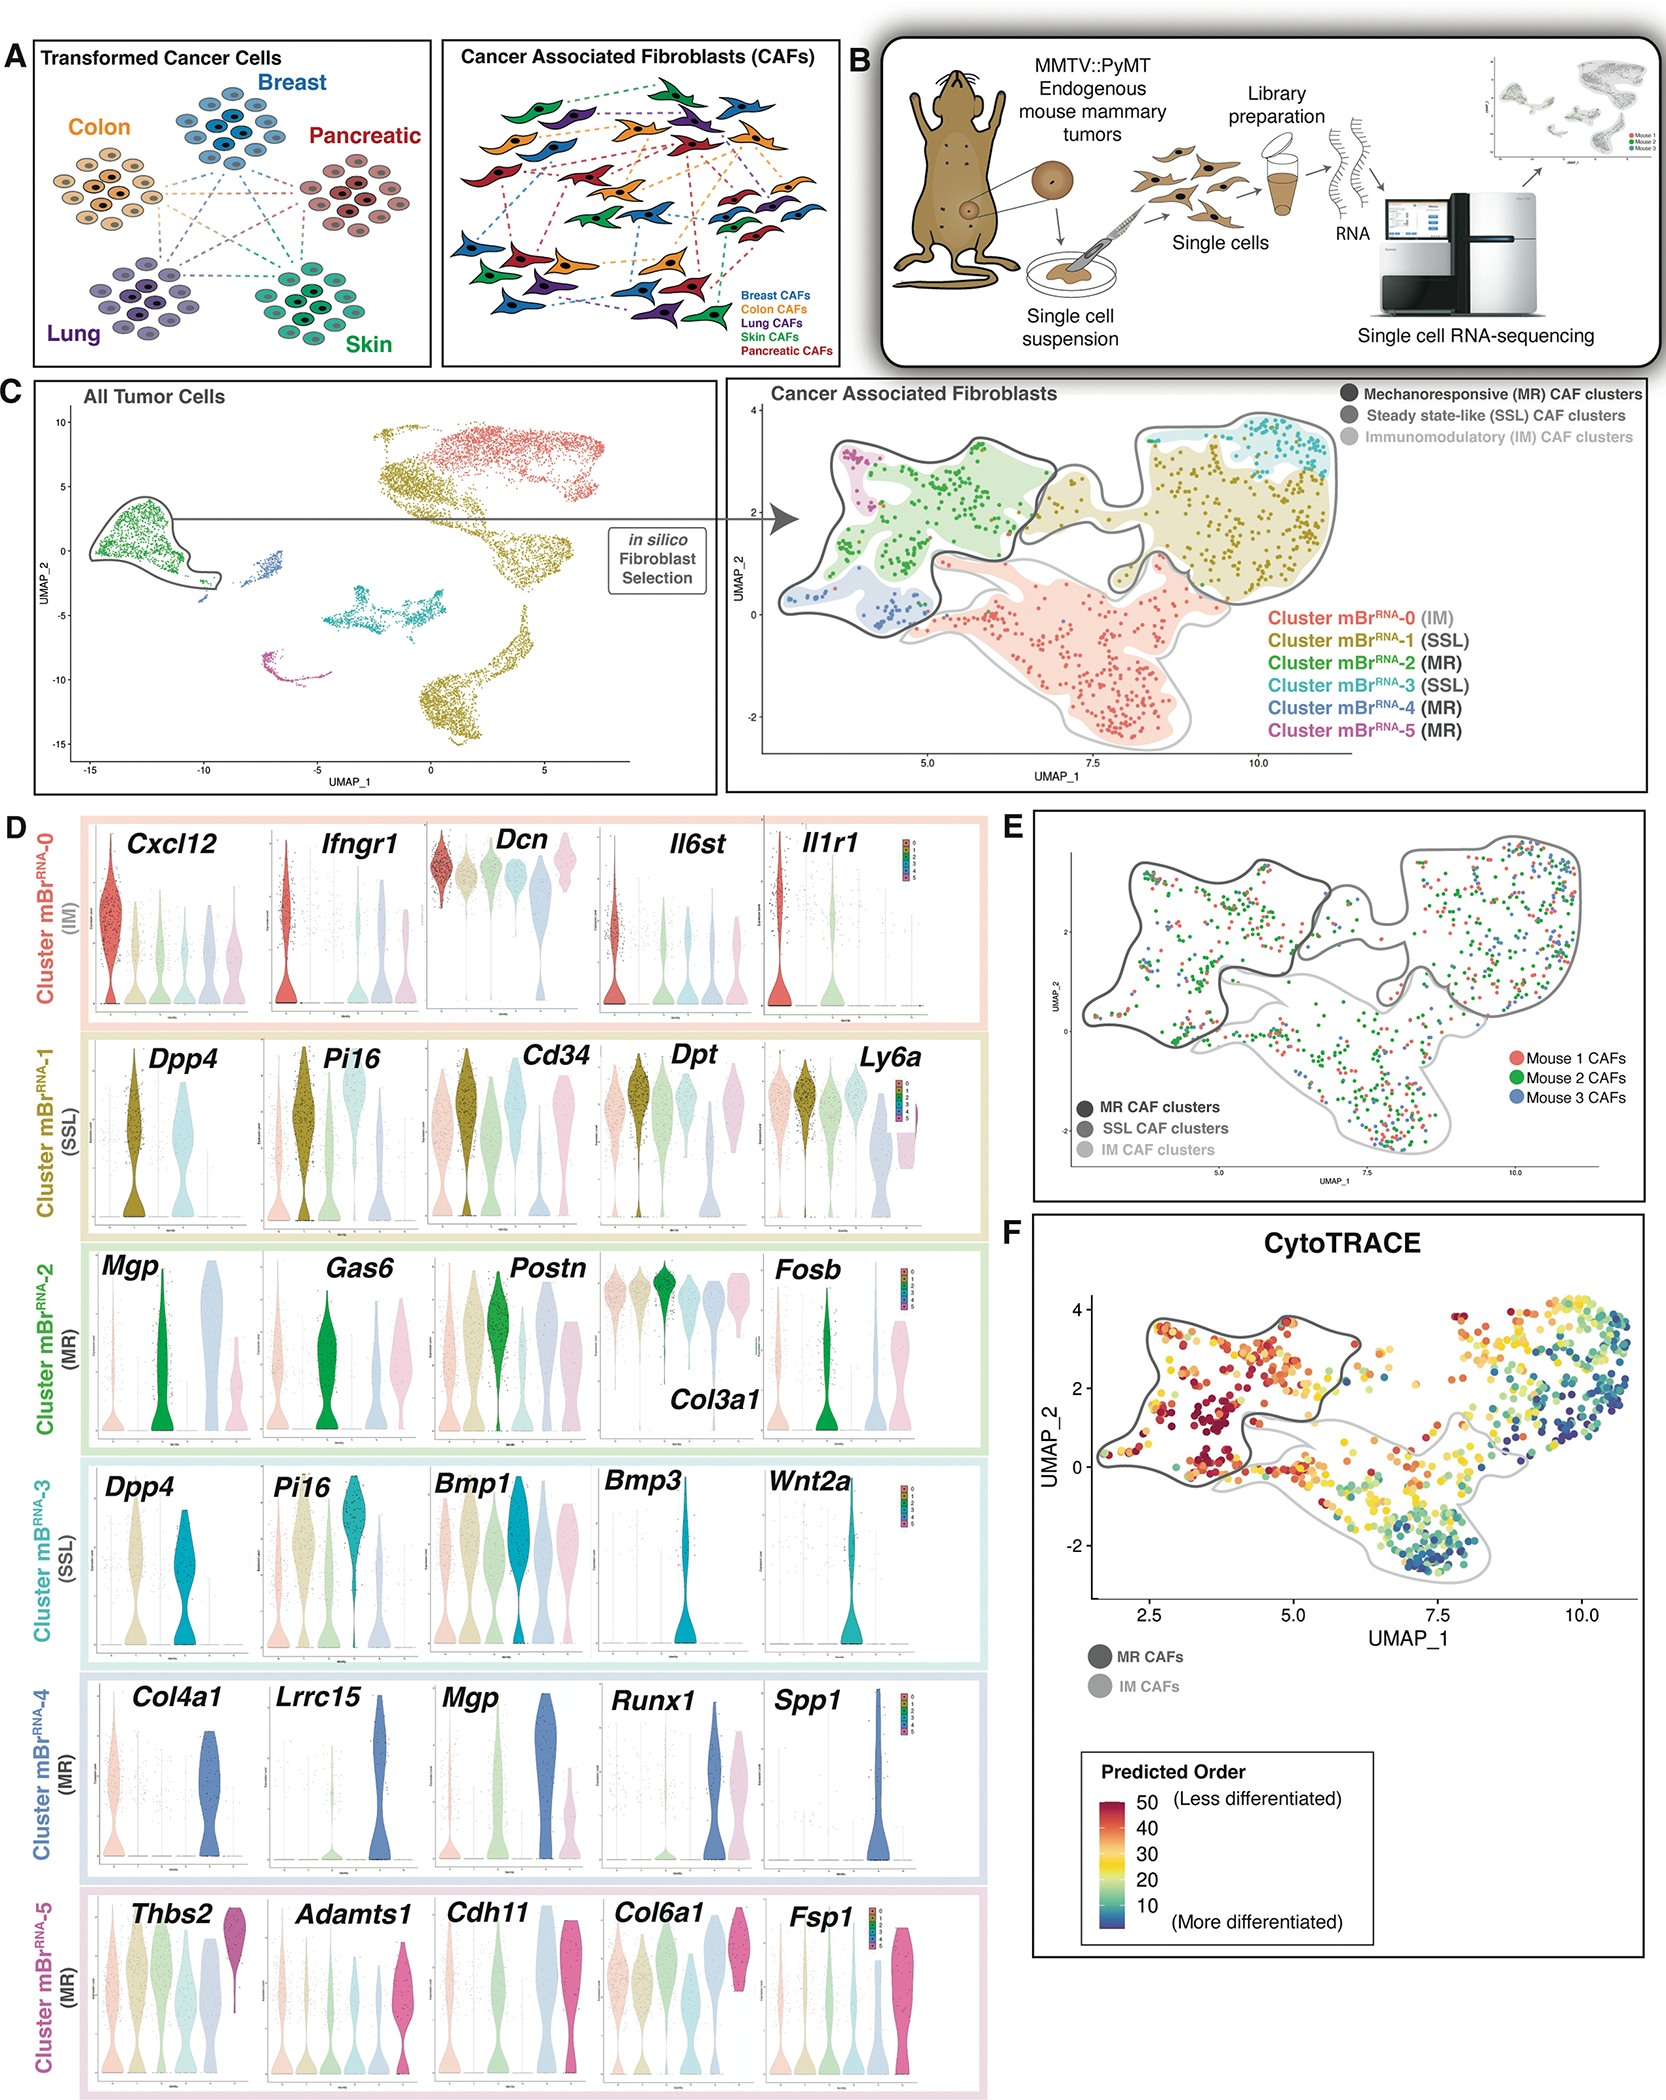
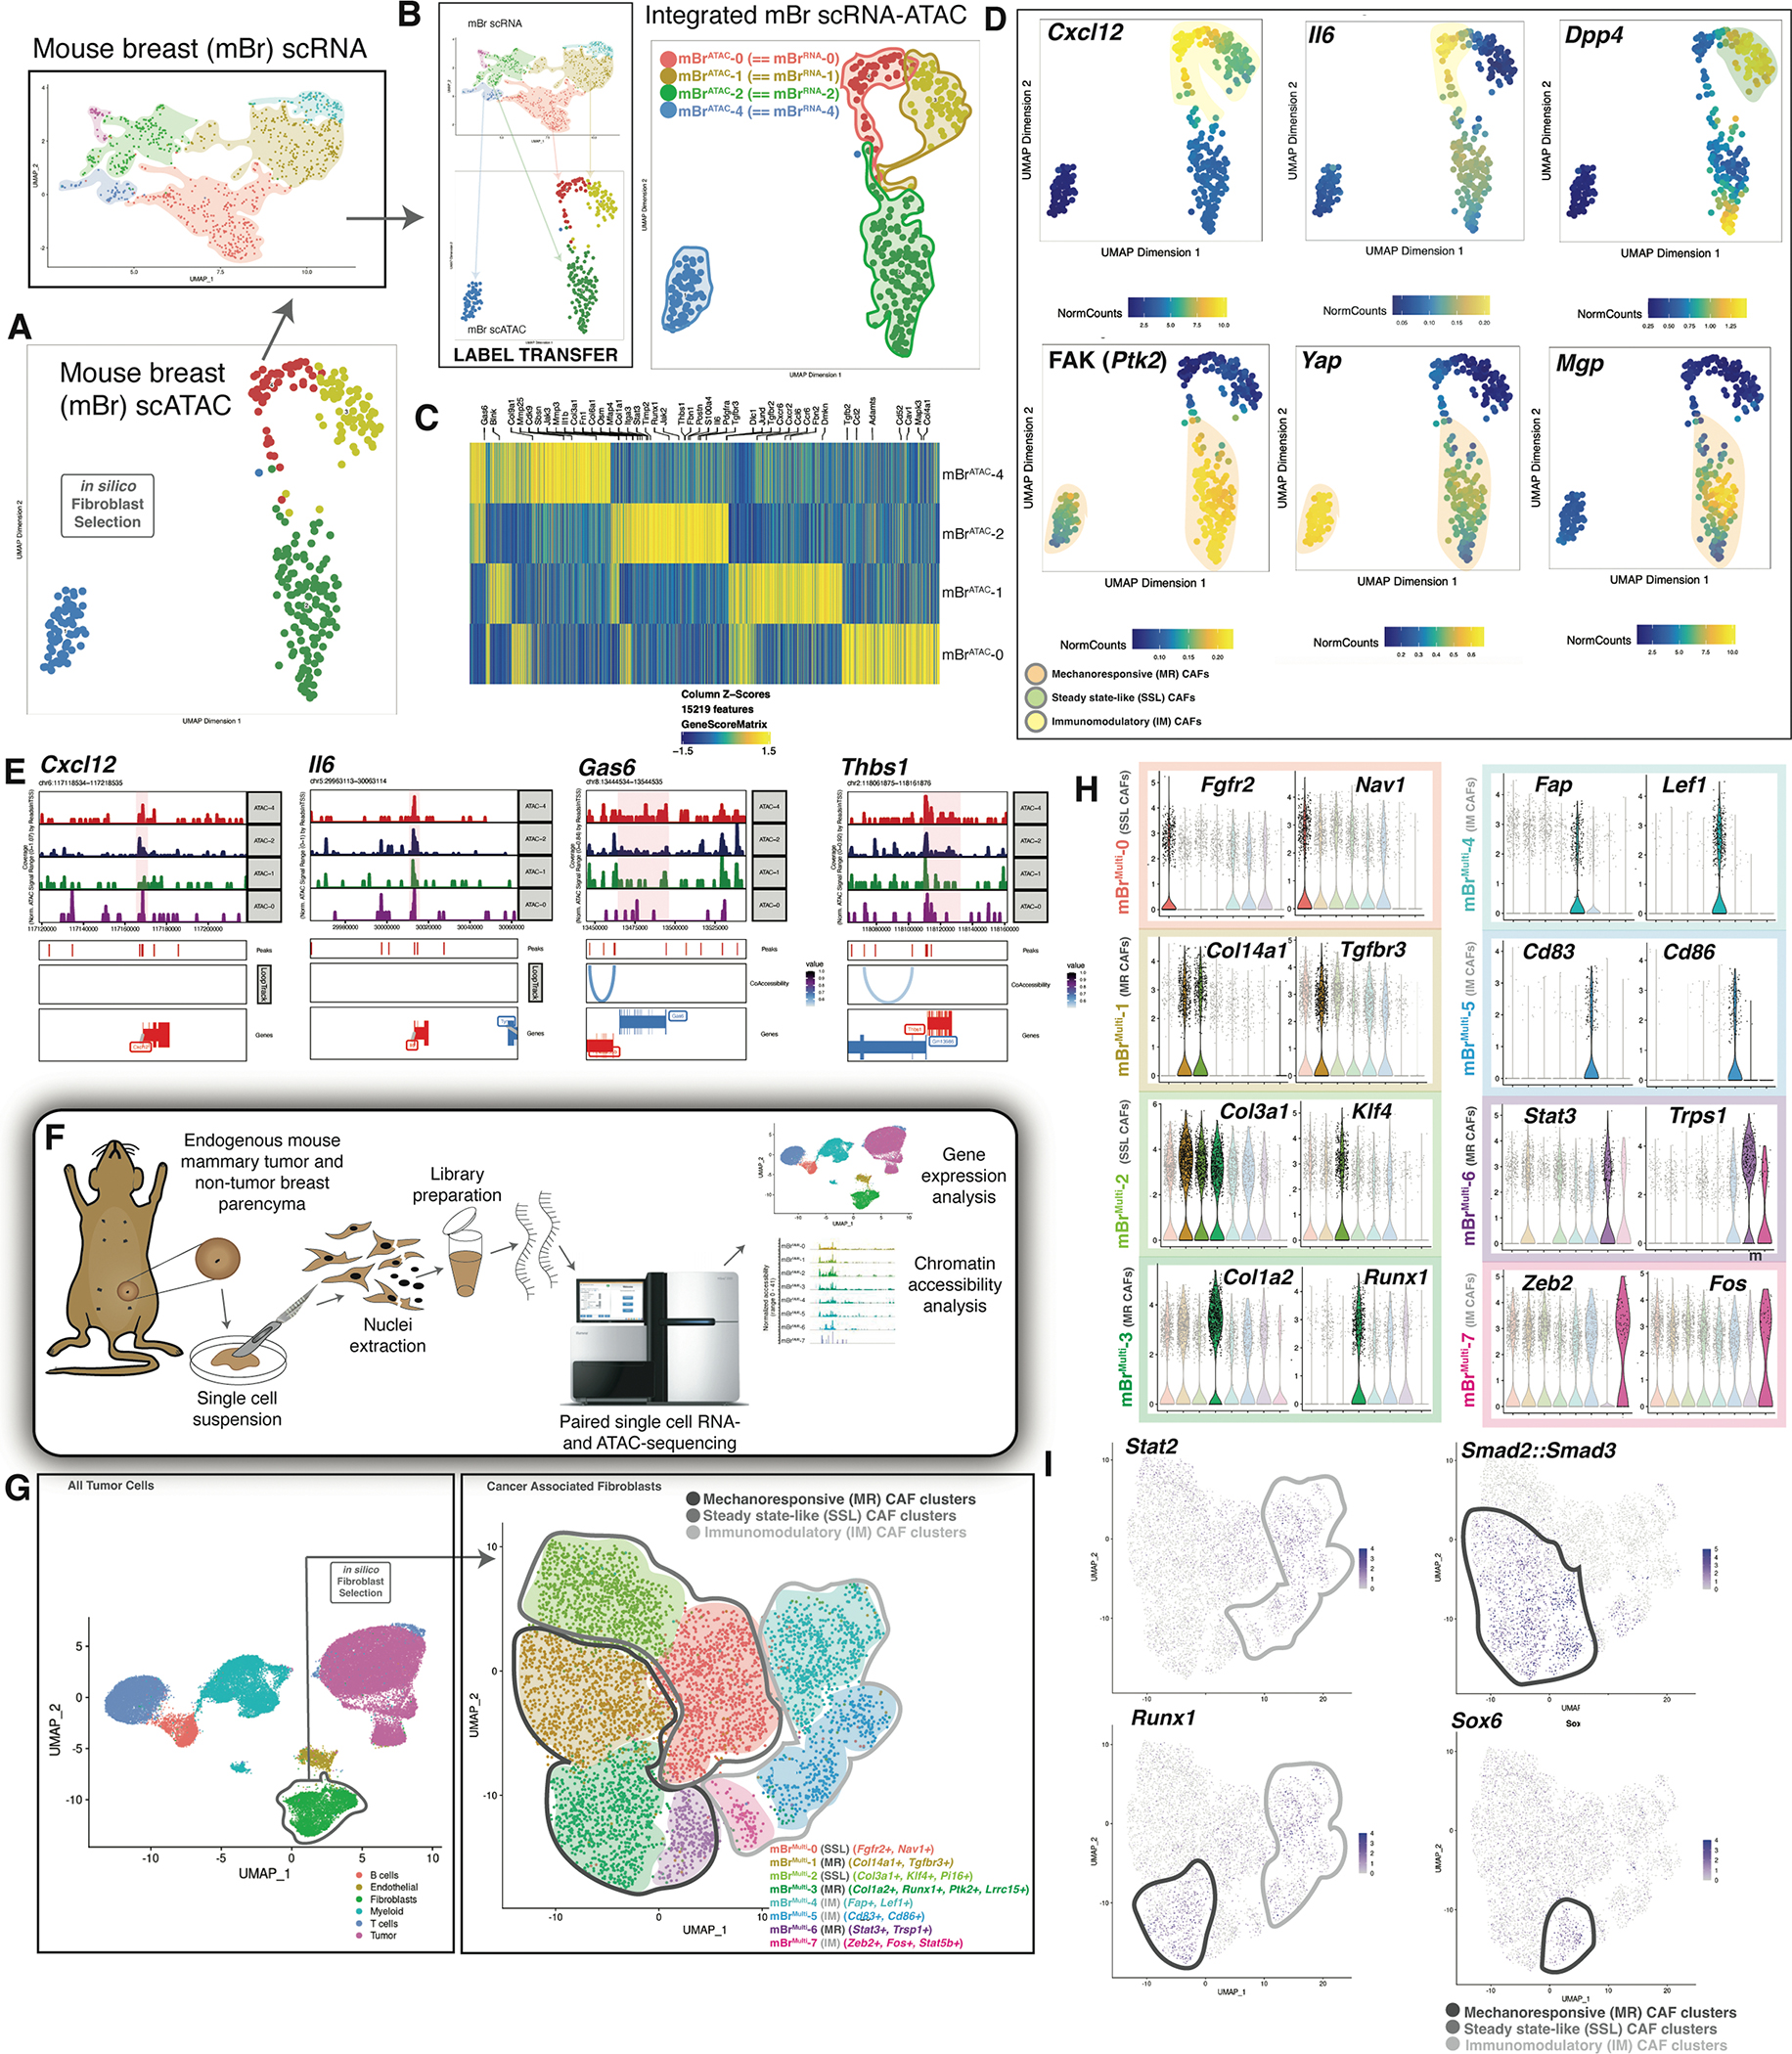
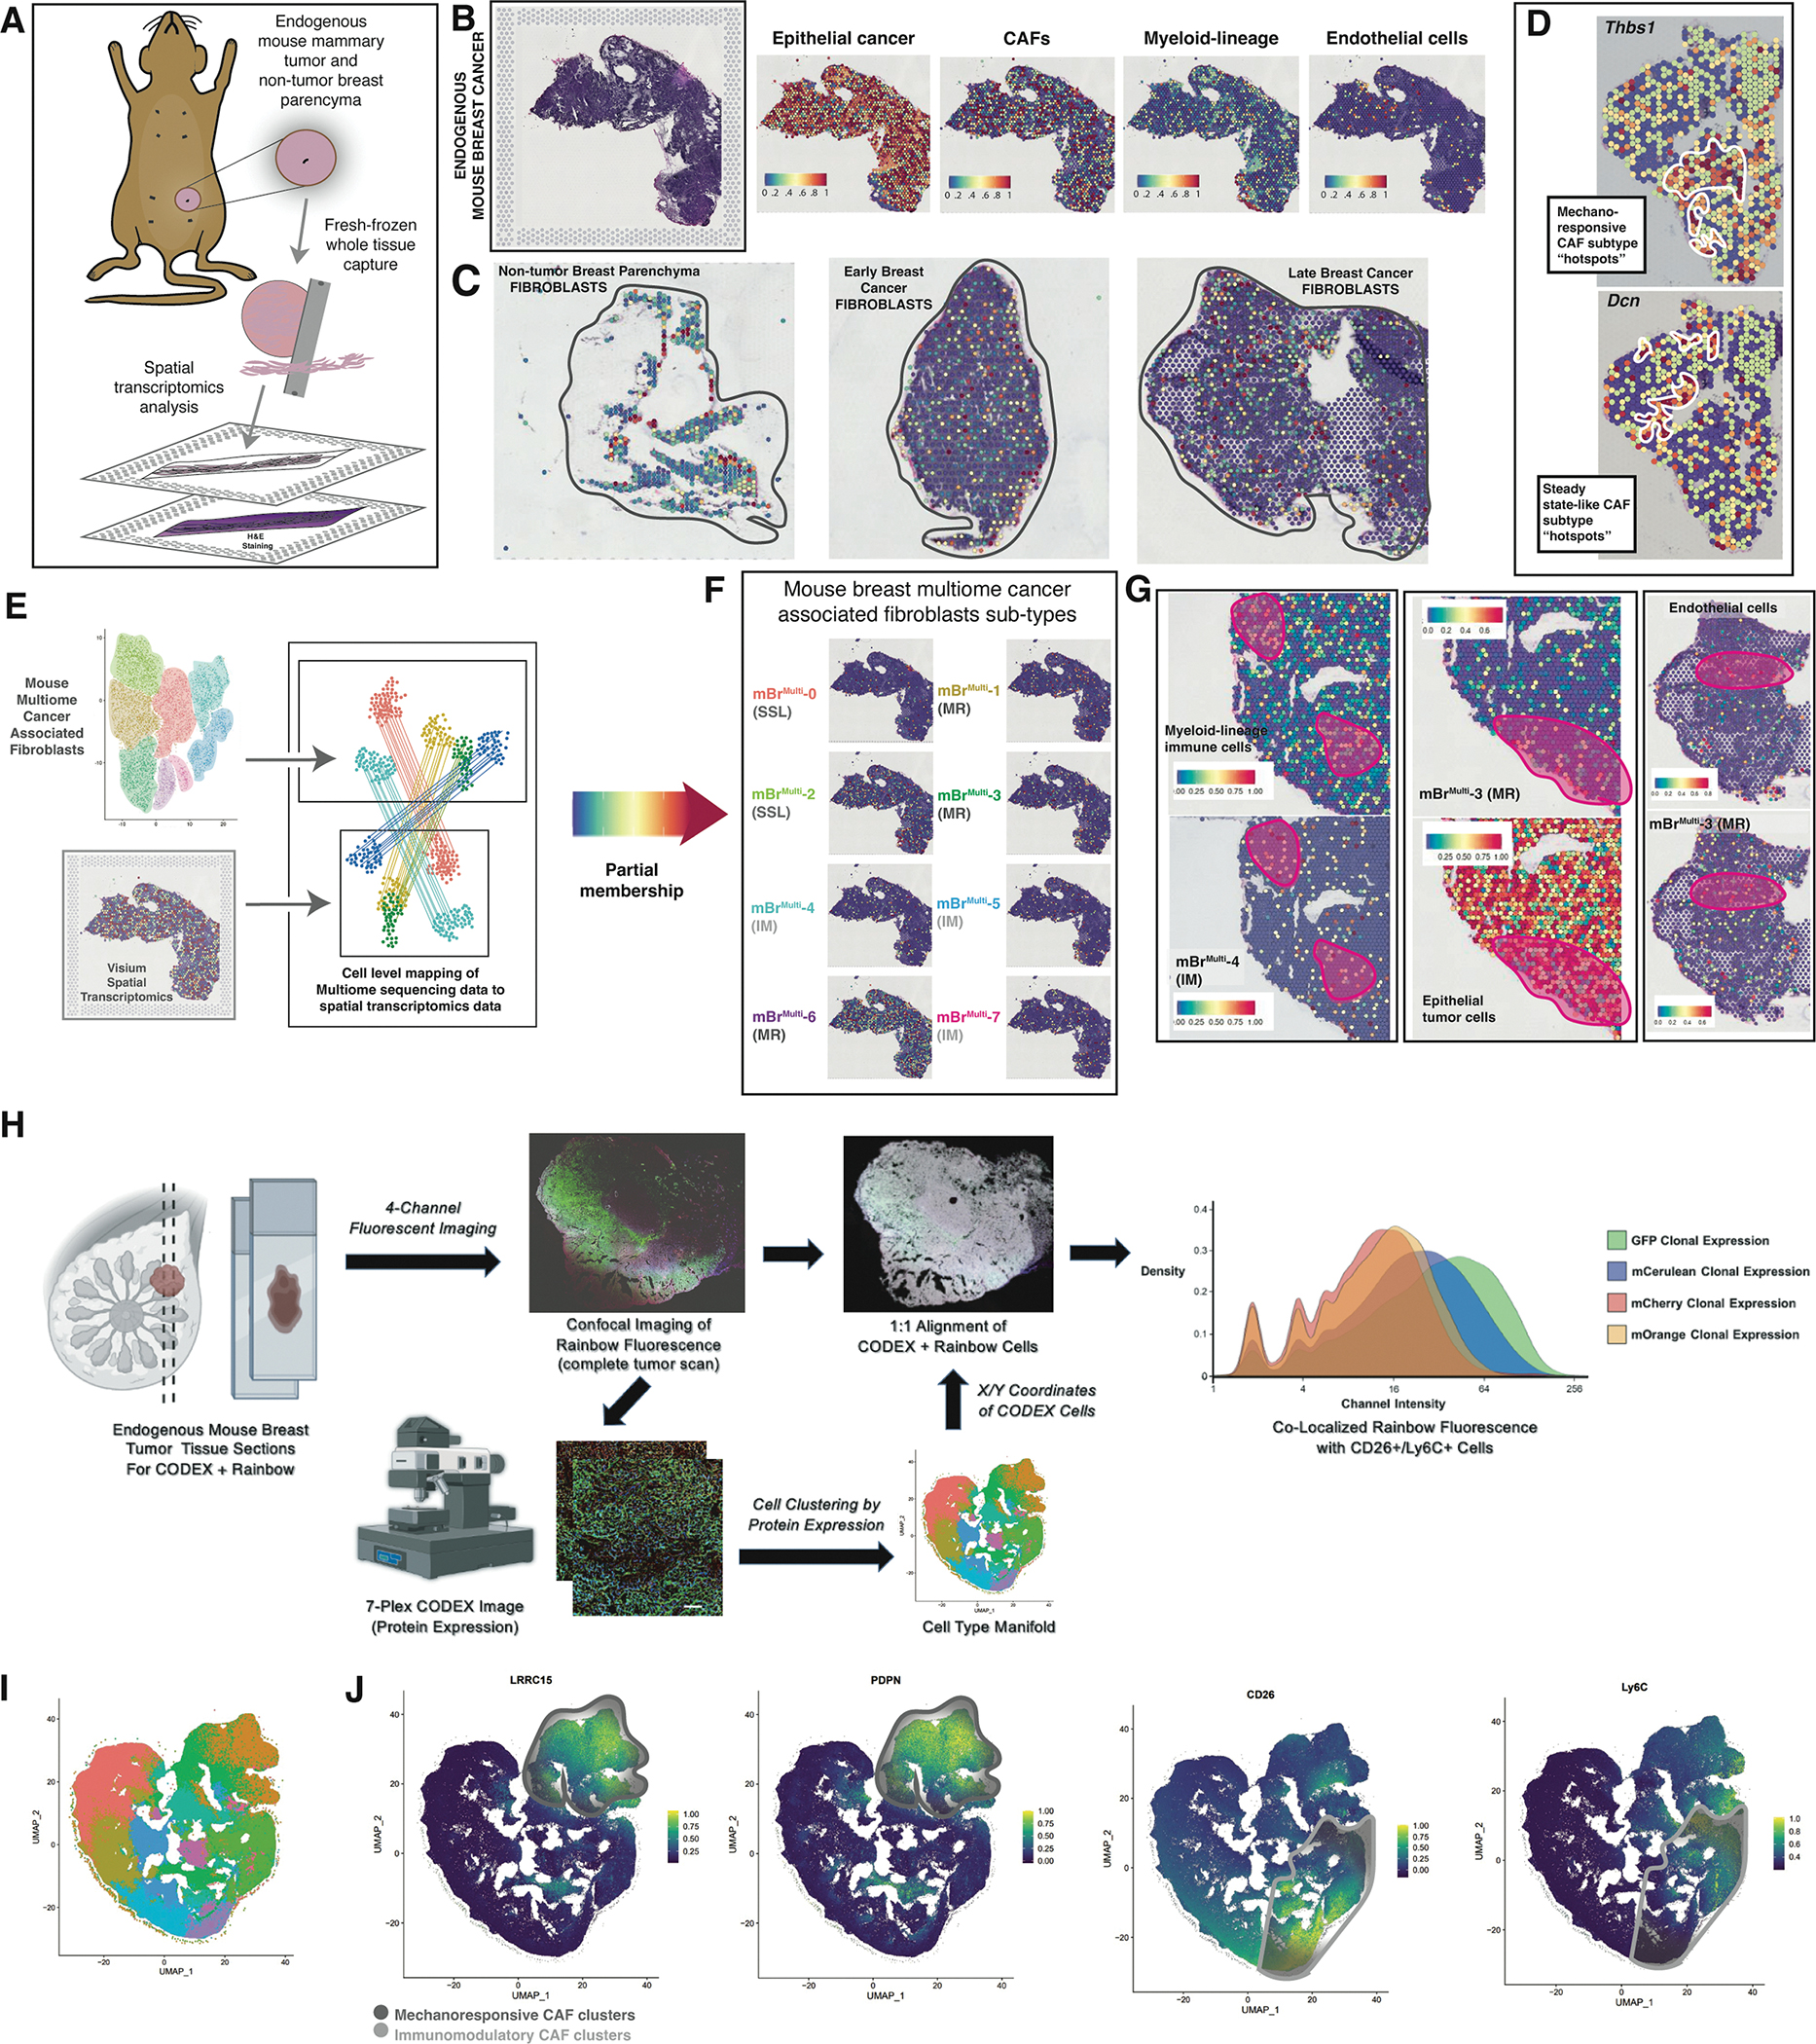
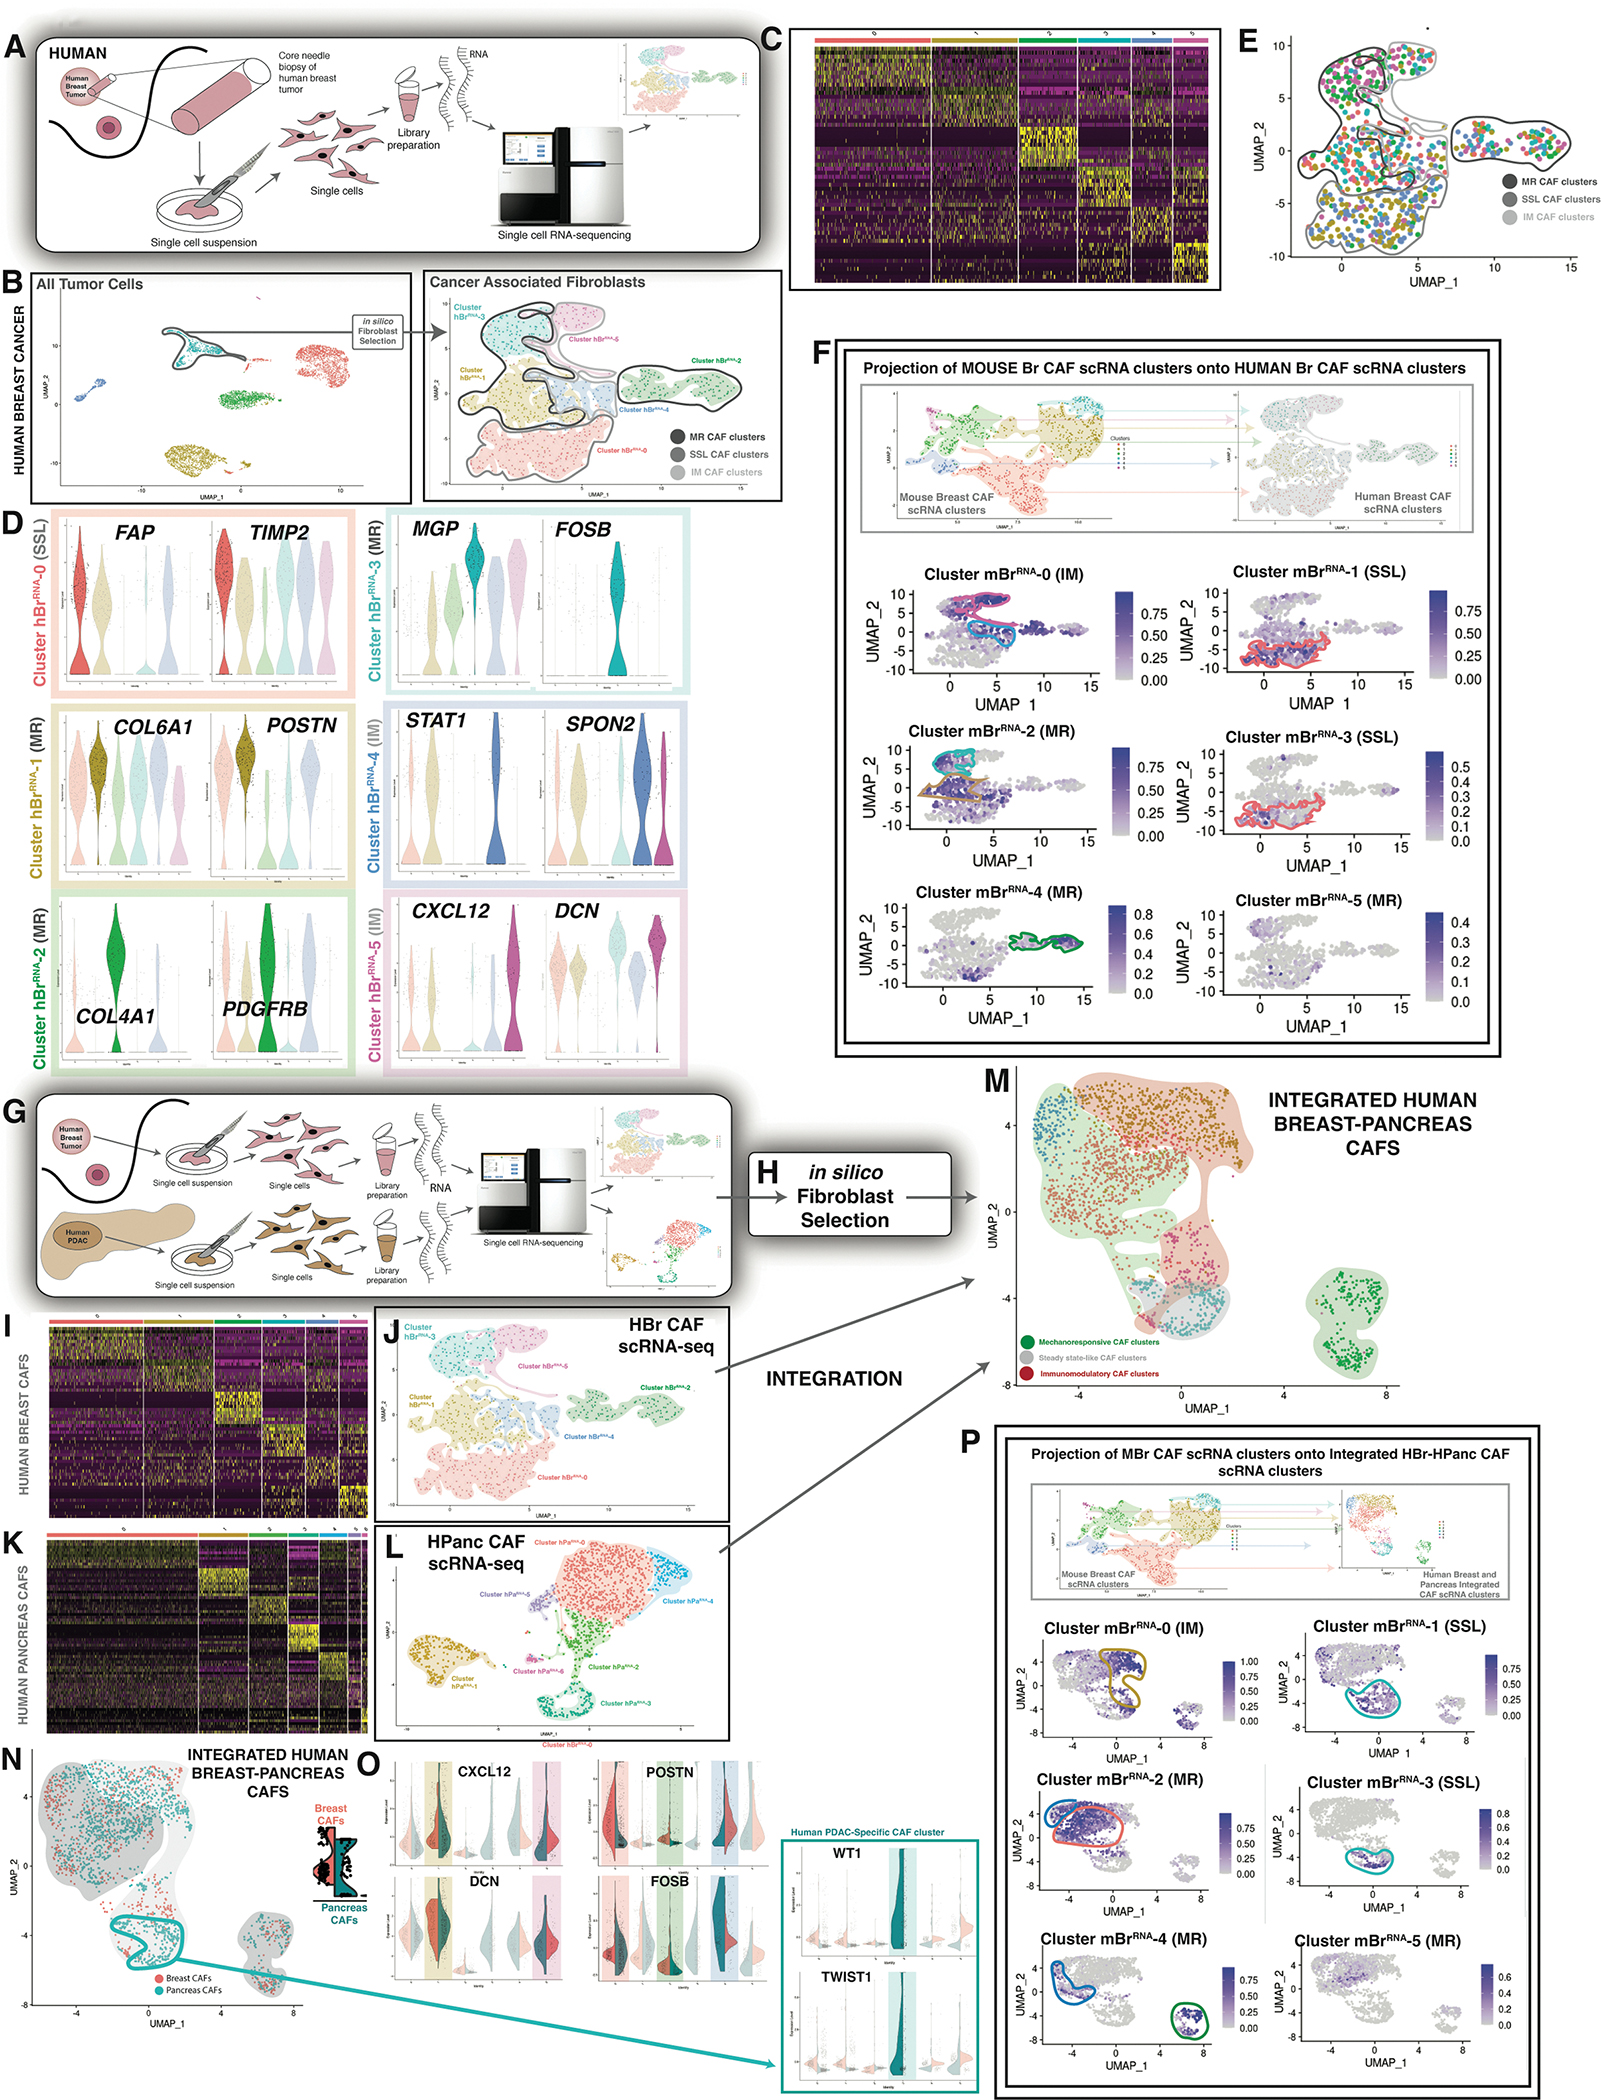
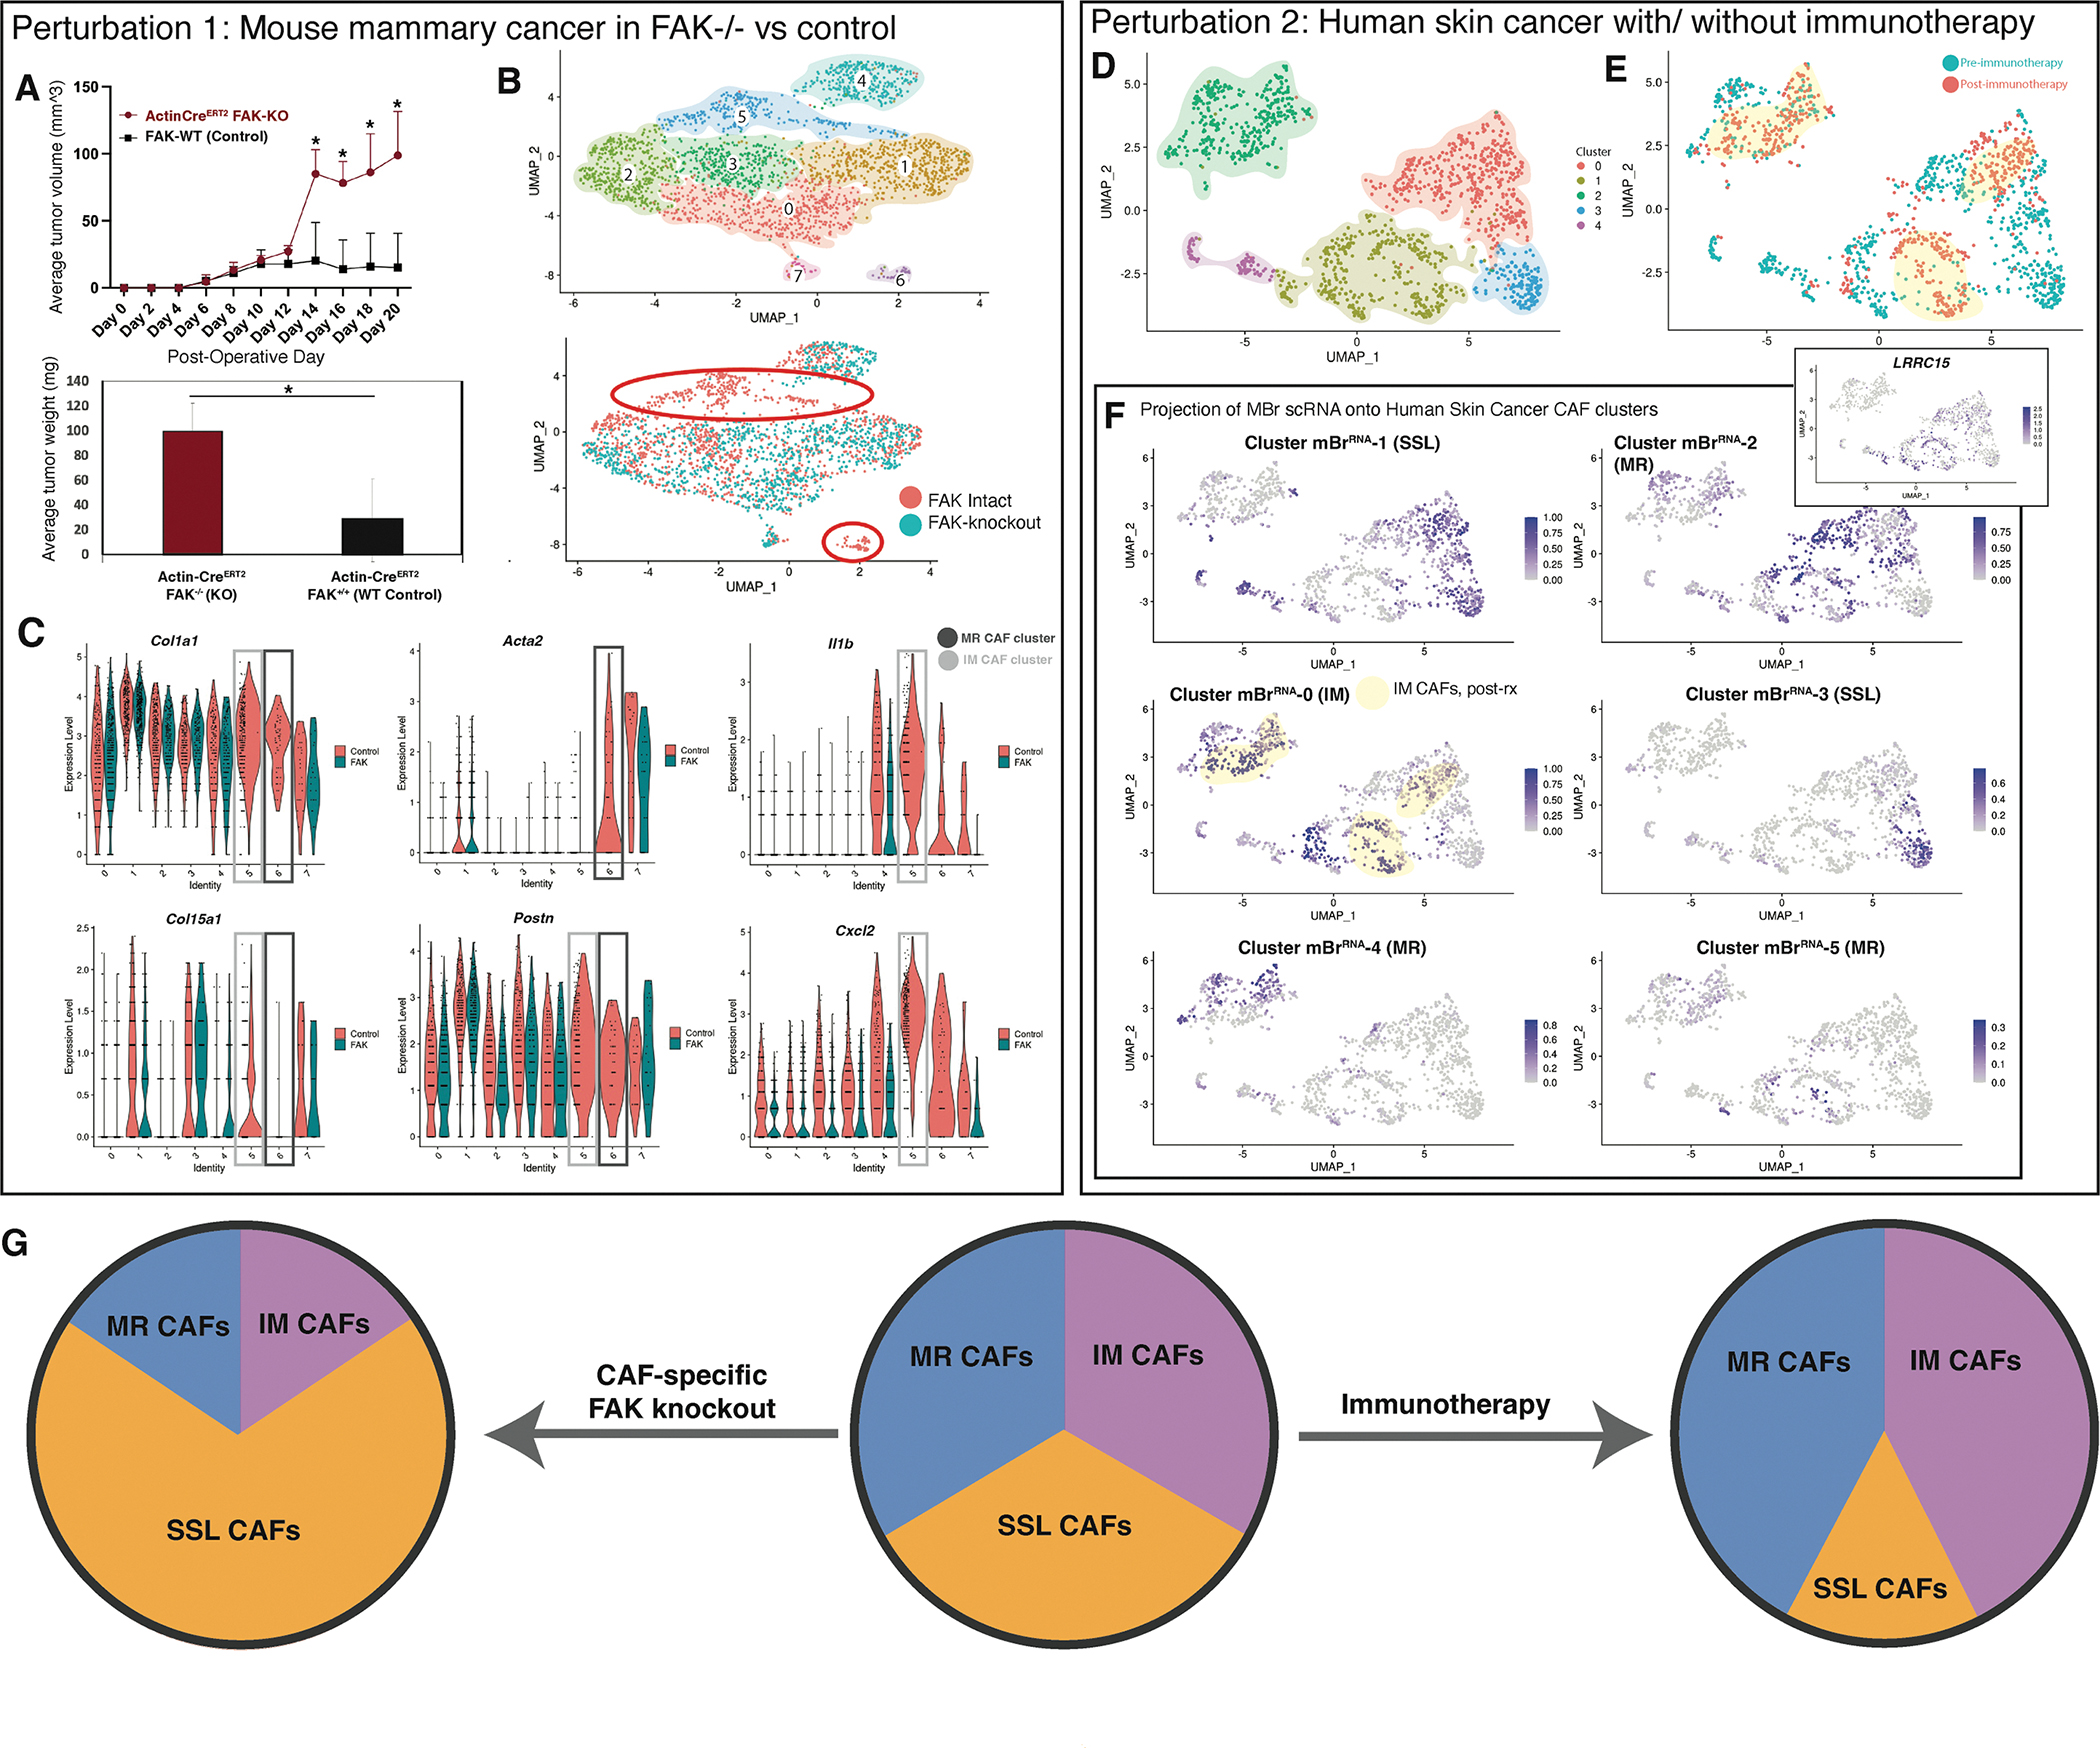
Cancer-associated fibroblasts (CAFs) are integral to the solid tumor microenvironment. CAFs were once thought to be a relatively uniform population of matrix-producing cells, but single-cell RNA sequencing has revealed diverse CAF phenotypes. Here, we further probed CAF heterogeneity with a comprehensive multiomics approach. Using paired, same-cell chromatin accessibility and transcriptome analysis, we provided an integrated analysis of CAF subpopulations over a complex spatial transcriptomic and proteomic landscape to identify three superclusters: steady state-like (SSL), mechanoresponsive (MR), and immunomodulatory (IM) CAFs. These superclusters are recapitulated across multiple tissue types and species. Selective disruption of underlying mechanical force or immune checkpoint inhibition therapy results in shifts in CAF subpopulation distributions and affected tumor growth. As such, the balance among CAF superclusters may have considerable translational implications. Collectively, this research expands our understanding of CAF biology, identifying regulatory pathways in CAF differentiation and elucidating therapeutic targets in a species- and tumor-agnostic manner.

Keywords: ATAC-seq; CODEX; RNA-seq; cancer; fibroblasts; mechanotransduction; multi-omics; single cell; spatial transcriptomics.


Conflict of interest statement

Declaration of interests D.S.F., M.J., D.D., H.Y.C., J.A.N., and M.T.L. have applied for a provisional patent through Stanford University related to the research presented in this manuscript. H.Y.C. is a co-founder of Accent Therapeutics, Boundless Bio, and Cartography Biosciences, and an advisor of 10X Genomics, Arsenal Biosciences, and Spring Discovery. K.E.Y. is a consultant for Cartography Biosciences.

Figures

Figure 1.
Figure 1.. Derivation of three CAF superclusters.
A. Schematics illustrating that transformed cancer cells show distinct transcriptional and epigenomic programs in accordance with tumor type and tissue of origin (left panel), whereas CAF subtypes may be conserved between tumor types (right panel). B. Schematic showing the procedure of scRNA-seq applied to endogenous mouse breast tumors. MMTV::PyMt endogenous mouse tumors (n=3 biological replicates per timepoint per condition). C. UMAP plot showing all tumor cells sequenced (left panel) → in silico CAF selection → UMAP plot demonstrating 6 distinct CAF clusters: dark grey circle indicates MR CAF clusters, medium grey circle indicates SSL CAF clusters and light grey circle indicates IM CAF clusters (right panel). D. Violin plots showing differentially expressed genes characteristic of each mouse breast cancer CAF cluster. Colors correspond to the indicated CAF cluster in the UMAP above. E. UMAP plot showing the sample distribution by hash-oligo data for the endogenous mouse breast tumors sequenced. MR, SSL, and IM CAF superclusters indicated as labelled in figure panel. F. UMAP plot showing CytoTRACE analysis of mBrRNA CAF data. Mechanoresponsive and immunomodulatory CAF cluster groups are circled as labelled in figure panel.
Figure 2.
Figure 2.. Chromatin accessibility of CAF subsets.
A. UMAP plot displaying mouse breast cancer mBrATAC clusters (bottom panel) → in silico fibroblast selection → integration with CAF mBrRNA data (top panel). (Data represent n=3 biological replicates per timepoint per condition). B. Anchor based label transfer of scRNA clusters into scATAC data (left panel) results in integrated mBr CAF scRNA-ATAC clusters (right panel). C. Heatmap showing characteristic differential paired chromatin accessibility-gene expression for integrated MBr CAF scRNA-ATAC clusters. D. UMAP plots showing integrated MBr CAF scRNA-ATAC data for key genes of interest characteristic of immunomodulatory and steady state-like CAF clusters (top row) and mechanoresponsive clusters (bottom row). E. Chromatin accessibility peaks for key genes of interest characteristic of immunomodulatory CAF clusters (Cxcl12 and Il6) and mechanoresponsive (Gas6 and Thbs1). F. Schematic showing procedure for multiome sequencing of endogenous mouse breast tumor tissue. Data represent samples from nonmalignant breast tissue, early breast tumors and late breast tumors. Each time point included three biological replicates. G. UMAP plot includes all cells that underwent multiome sequencing (left panel) → in silico CAF selection → UMAP plot demonstrating distinct CAF clusters: MR, IM, and SSL superclusters as indicated (right panel). Characteristic genes for each cluster are provided in figure labels. (Data represent n=3 biological replicates per timepoint per condition). H. Violin plots indicate differentially expressed genes characteristic of each mBrMulti CAF cluster. I. Transcription factor (TF) motif analysis was performed on mBrMulti data using the Signac and chromVAR packages. Feature plots indicate cells with highly accessible motifs for the indicated TF.
Figure 3.
Figure 3.. CAF cluster localization and plasticity.
A. Schematic showing 10X Genomics Visium spatial transcriptomic analysis of endogenous mouse breast tumors. B. H&E staining of a representative section of an endogenous mouse breast tumor used for Visium analysis (left panel). Visium spatial transcriptomic sequencing panels showing cell type represented representation in the representative tumor section (right panels). C. Representative Visium sections showing CAF representation within normal breast parenchyma, early and late endogenous breast tumors. D. Spatial transcriptomics plots showing “hot spots” containing CAFs with high expression of key genes characteristic of mechanoresponsive (Thbs1) and steady state-like CAF clusters (Dcn). E. Cell level mapping of multiome sequencing data to spatial transcriptomics data → Partial membership of mBrRNA CAF clusters represented in mBrVisium data. F. Visium spatial transcriptomics plots showing representation of each of the mBrMulti CAF clusters on a representative endogenous mouse breast tumor section. G. Example co-localization of specific mBrMulti CAF clusters with relevant cell types from representative Visium sections, clusters and cell types as labeled in figure, pink circles highlight areas of co-localization. H. Schematic describing the Rainbow-CODEX workflow. Tumor sections are first imaged for Rainbow fluorescence followed by CODEX staining and analysis, which included spatial analysis at the single cell level. Staining patterns for each cell are represented in two-dimensional UMAP plots, identifying populations of CD26+Ly6C+ SSL/IM CAFs. Cellular location is then identified on the corresponding confocal image and matched to Rainbow fluorophore expression, ultimately confirming the presence of poly-clonal SSL/IM CAFs that once expressed aSMA. I. UMAP of cell populations derived from CODEX staining in Rainbow mouse breast tumors. J. CODEX data feature plots demonstrating distinct localization of MR CAFs (LRRC15+, PDPN+) in the upper-right of manifold and SSL/IM CAFs (CD26+, Ly6C+) in the bottom-right of manifold.
Figure 4.
Figure 4.. Cross-tumor integration of CAF phenotypes.
A. Schematic showing scRNA-seq of human breast tumor tissue. B. UMAP plot showing all tumor cells sequenced (top panel) → in silico CAF selection → UMAP plot showing human breast cancer scRNA-seq (hBrRNA) CAF clusters. Clusters as labelled in figure panel (bottom panel). C. Heatmap showing characteristic differential gene expression for hBrRNA CAF clusters. D. Violin plots showing differentially expressed genes characteristic of each hBrRNA CAF cluster. Colors represent clusters visualized in B. E. UMAP plot showing hash-oligo data for the human breast tumors sequenced. Each human sample was stained with two hash-oligos for validation. F. Label transfer projection of mBrRNA clusters onto hBrRNA CAF clusters. Clusters as labeled in figure panel. CAF clusters indicated with colors corresponding to mBrRNA CAF data. G. Schematic showing scRNA-seq of human breast and pancreas tumor tissue. H. In silico CAF selection. I. Heatmap showing characteristic differential gene expression for hBrRNA CAF clusters. J. UMAP plot showing hBrRNA CAF clusters as in B (right panel). J. Heatmap showing characteristic differential gene expression for hPaRNA CAF clusters. (Data represent n=3 unique patient tissue samples as noted). K. UMAP plot showing hPaRNA CAF clusters. L. UMAP plot showing integrated human breast-pancreas CAF data (7 clusters). Green shading indicates mechano-responsive CAF clusters whereas gold shading indicates immuno-modulatory CAF clusters. M. UMAP plot showing integrated human breast-pancreas CAF data in terms of organ of origin. N. Violin plots showing selected highest-differentially expressed genes characteristic of integrated human breast-pancreas CAF clusters. One cluster is only represented by HPanc CAFs, as indicated (blue box). O. Label transfer projection of mBrRNA CAF clusters onto integrated human breast-pancreas CAF scRNA-seq clusters. Clusters as labeled in figure panel. CAF clusters indicated with colors corresponding to mBrRNA CAF data.
Figure 5.
Figure 5.. Functional modulation affects the balance of CAF subtypes.
A. Average tumor size comparing allograft mouse breast tumors with global FAK knockout versus control (ActinCreERT2::FAKKO mice) (top panel). Average tumor weight comparing allograft mouse breast tumors with global FAK knockout versus control on day 20 of harvest (ActinCreERT2::FAKKO mice) (bottom panel). POD = post-operative day, KO = knockout, WT = Wildtype, * = p<0.05 (t-test). (Data represent n=3 biological replicates per timepoint per condition unless otherwise noted). B. UMAP plot showing eight transcriptionally-defined CAF clusters for mouse allograft breast cancer specimens from FAK-intact and Col1a2CreERT2::FAKfl/fl mice (data represent n=3 biological replicates per group, hash-oligos incorporated to distinguish biological replicates) (Top panel). UMAP plot grouped by CAF origin (FAK-intact in red vs Col1a2CreERT2::FAKfl/fl in green). Primary clusters (5 and 6) lost with fibroblast-specific FAK knockout are highlighted with orange circles (bottom panel). C. Violin plots illustrating expression of genes of interest between CAFs (FAK-intact in red vs Col1a2CreERT2::FAKfl/fl in green). MR and IM CAF clusters of interest highlighted with grey boxes as labelled in the figure panel. D. UMAP plot showing transcriptionally-defined clusters for human BCC scRNA-seq CAF. E. UMAP plot from CAF-specific scRNA-seq data colored according to pre- vs post- immune checkpoint blockade for human BCC. F. Label transfer projection of mouse breast CAF scRNA-seq clusters on human BCC CAF scRNA-seq clusters. Immunomodulatory CAF cluster 0 is highly represented in post-therapy CAFs, while SSL cluster 3 is almost entirely found in pre-therapy samples. These patterns are highlighted with yellow shading. Feature plot of LRRC15 expression shown in inset corresponds closely with MBr cluster 2 (MR1) correlation as anticipated. G. Schematic summarizing CAF subpopulation perturbations observed with FAK knockout in the context of mouse breast cancer compared with immunotherapy in the context of human BCC.

Comment in

References

    1. Biasci D, Smoragiewicz M, Connell CM, Wang Z, Gao Y, Thaventhiran JED, Basu B, Magiera L, Johnson TI, Bax L, et al. (2020). CXCR4 inhibition in human pancreatic and colorectal cancers induces an integrated immune response. Proc Natl Acad Sci U S A 117, 28960–28970. - PMC - PubMed
    1. Biffi G, Oni TE, Spielman B, Hao Y, Elyada E, Park Y, Preall J, and Tuveson DA (2019). IL1-Induced JAK/STAT Signaling Is Antagonized by TGFbeta to Shape CAF Heterogeneity in Pancreatic Ductal Adenocarcinoma. Cancer Discov 9, 282–301. - PMC - PubMed
    1. Black S, Phillips D, Hickey JW, Kennedy-Darling J, Venkataraaman VG, Samusik N, Goltsev Y, Schurch CM, and Nolan GP (2021). CODEX multiplexed tissue imaging with DNA-conjugated antibodies. Nat Protoc 16, 3802–3835. - PMC - PubMed
    1. Buechler MB, Pradhan RN, Krishnamurty AT, Cox C, Calviello AK, Wang AW, Yang YA, Tam L, Caothien R, Roose-Girma M, et al. (2021). Cross-tissue organization of the fibroblast lineage. Nature 593, 575–579. - PubMed
    1. Chen EY, Tan CM, Kou Y, Duan Q, Wang Z, Meirelles GV, Clark NR, and Ma’ayan A (2013). Enrichr: interactive and collaborative HTML5 gene list enrichment analysis tool. BMC Bioinformatics 14, 128. - PMC - PubMed

Publication types