. 2023 Jul;72(7):1296-1307.
doi: 10.1136/gutjnl-2022-327337. Epub 2022 Oct 21.

Rewiring the altered tryptophan metabolism as a novel therapeutic strategy in inflammatory bowel diseases

Affiliations

Rewiring the altered tryptophan metabolism as a novel therapeutic strategy in inflammatory bowel diseases

Chloé Michaudel et al. Gut. 2023 Jul.

Abstract

Objective: The extent to which tryptophan (Trp) metabolism alterations explain or influence the outcome of inflammatory bowel diseases (IBDs) is still unclear. However, several Trp metabolism end-products are essential to intestinal homeostasis. Here, we investigated the role of metabolites from the kynurenine pathway.

Design: Targeted quantitative metabolomics was performed in two large human IBD cohorts (1069 patients with IBD). Dextran sodium sulphate-induced colitis experiments in mice were used to evaluate effects of identified metabolites. In vitro, ex vivo and in vivo experiments were used to decipher mechanisms involved. Effects on energy metabolism were evaluated by different methods including Single Cell mEtabolism by profiling Translation inHibition.

Results: In mice and humans, intestinal inflammation severity negatively correlates with the amount of xanthurenic (XANA) and kynurenic (KYNA) acids. Supplementation with XANA or KYNA decreases colitis severity through effects on intestinal epithelial cells and T cells, involving Aryl hydrocarbon Receptor (AhR) activation and the rewiring of cellular energy metabolism. Furthermore, direct modulation of the endogenous tryptophan metabolism, using the recombinant enzyme aminoadipate aminotransferase (AADAT), responsible for the generation of XANA and KYNA, was protective in rodent colitis models.

Conclusion: Our study identified a new mechanism linking Trp metabolism to intestinal inflammation and IBD. Bringing back XANA and KYNA has protective effects involving AhR and the rewiring of the energy metabolism in intestinal epithelial cells and CD4+ T cells. This study paves the way for new therapeutic strategies aiming at pharmacologically correcting its alterations in IBD by manipulating the endogenous metabolic pathway with AADAT.

Keywords: inflammatory bowel disease.


Conflict of interest statement

Competing interests: HS report lecture fee, board membership, or consultancy from Carenity, AbbVie, Astellas, Danone, Ferring, Mayoly Spindler, MSD, Novartis, Roche, Tillots, Enterome, BiomX, Biose, Novartis,Takeda, Biocodex and is cofounder of Exeliom Biosciences.

Figures

Figure 1
Figure 1
KYNA and XANA abundances are negatively correlated with inflammation during DSS-induced colitis. (A) Kynurenine pathway, (B) histological score and colon length dynamic during the course of DSS-induced colitis, (C) dynamic of kynurenine pathway metabolites in serum and colon tissue during the course of DSS-induced colitis, (D) correlation between KYNA and XANA abundance in the caecum and weight loss. Statistical analysis: n=6–8 per time point, for correlation n=47, Spearman’s rank correlation, **: p<0.01, ****: p<0.0001. AADAT, aminoadipate aminotransferase; DSS, dextran sodium sulphate; KYNA, kynurenic acid; XANA, xanthurenic acid.
Figure 2
Figure 2
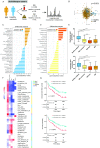
KYNA and XANA abundances correlate with disease activity in humans with IBD: Suivitheque cohort. (A) Design of the Suivitheque cohort. (B) PCA analysis based on trp metabolites in serum. (C) Differential analysis of the abundance of TRP metabolites in serum between patients with IBD versus HS (adjusted p value bH). (D) differential analysis of the abundance of TRP metabolites in serum between patients with IBD in flare versus remission (adjusted p value bH). (E) XANA and KYNA amount in serum (ANOVA with correction for FDR bH). (F) Correlation between the amount of tryptophan metabolites in serum and disease activity parameters. Spearman, p<0.05, q<0.1 (BH). (G) Clinical event-free survival according to XANA and KYNA levels in serum. Only patients in remission were included in this analysis. Two groups were defined according to the median level of XANA and KYNA. Statistical comparison was performed with a log-rank test. ANOVA, analysis of variance, ****: p<0.0001; CRP, C reactive protein; FDR, false discovery rate; Hb, haemoglobin; HBI, Harvey-Bradshaw Index; HS, healthy subjects; IBD, inflammatory bowel disease; IDO, indoleamine 2,3-dioxygenase; KYNA, kynurenic acid; PCA, principal component analysis; SCCAI, Simple Clinical Colitis Activity Index; XANA, xanthurenic acid.
Figure 3
Figure 3
IDO metabolites, XANA and KYNA protect against DSS-induced colitis. (A) Body weight loss, (B) DAI, (C) colon length, (D) histological score, (E) colon histology pictures and (F) nanostring colon transcriptomic results at day 12. Each column represents a mouse. Statistical analysis: n=16–20 mice per group, two-way or one-way ANOVA, with Bonferroni post test, *: p<0.05, **: p<0.01, ***: p<0.001, ****: p<0.0001. ANOVA, analysis of variance; DAI, disease activity index; DSS, dextran sodium sulphate; IDO, indoleamine 2,3-dioxygenase; KYNA, kynurenic acid; XANA, xanthurenic acid.
Figure 4
Figure 4
KYNA and XANA promote intestinal epithelial cells viability and proliferation through AhR. (A) Ki67 and DAPI staining in mouse colon at day 12 of a DSS model and quantification. (B, C) Scratch test on HT-29 cells treated with KYNA, XANA or FICZ: representative pictures and quantification of empty space. (D) Colitis protection by KYNA and XANA is abrogated in AhR-/- mice. (E) Oral gavage of KYNA and XANA for 12 days activate the expression of the AhR target gene, CYP1A1 in the colon. (F, G) Scratch test on HT-29 cells treated with KYNA, XANA, FICZ, with the AhR antagonist CH223191. (H) AhR reporter cell line activation and (I) radio displacement of TCDD induced by KYNA and XANA. (J–L) colitis protection by KYNA and XANA are partly conserved in AhRΔIEC mice. Data represent one out of two independent experiments. Statistical analysis: for scratch test 100 measures per slide, in vitro experiment n=3 and for in vivo and ex vivo experiment n=5–10 mice per group, two-way or one-way ANOVA, with Bonferroni post test, *: p<0.05, **: p<0.01, ***: p<0.001, ****: p<0.0001. AhR, aryl hydrocarbon receptor; ANOVA, analysis of variance;DSS, dextran sodium sulphate; KYNA, kynurenic acid; XANA, xanthurenic acid.
Figure 5
Figure 5
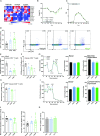
KYNA and XANA improved mitochondrial metabolism in epithelial intestinal cells. (A) SCFA dosages in cecum content and (B) relative SMCT and MCT-1 expression in murine colon at steady state in mouse after 12 days of KYNA and XANA gavage. (C) Dysfunctional mitochondria (MitoRed- and MitoGreen+) in HT-29 cells after 72 hours of KYNA or XANA stimulation (100 µM). (D) MitoRed MFI in dysfunctional mitochondria (MitoRed- MitoGreen+) from HT-29 cells. (E) MitoRed MFI in MitoRed+ HT-29 population. (F) Mitochondrial metabolisms with ocr measurements and (G) maximal respiration in Seahorse assay on HT-29 cells after 72 hours of KYNA or XANA stimulation. (H) Glycolysis metabolism, with ECAR measurements and (I) compensatory glycolysis in Seahorse assay on HT-29 cells after 72 hours of KYNA or XANA stimulation. (J) MitoRed MFI of CD45-EpCAM+ cells from the colon of mice gavaged for 12 days with KYNA or XANA. (K) MitoRed MFI of CD45-EpCAM+ cells from mice colon organoids 72 hours after KYNA, XANA and oligomycin treatment (5 µM). (L, M) Scratch test on HT-29 cells treated with KYNA, XANA in presence of oligomycin (5 µM): representative pictures and quantification of empty space. (N) Proliferation assay with EdU on mouse colon organoids 72 hours after KYNA, XANA and oligomycin treatment (5 µM). Data represent one out of two independent experiments. Statistical analysis: for in vitro experiment n=3–6 and for in vivo experiment n=5–7 mice per group, two-way or one-way ANOVA, with Bonferroni post test, *: p<0.05, **: p<0.01, ***: p<0.001, ****: p<0.0001. ANOVA, analysis of variance; EdU, 5-éthynyl-2’-déoxyuridine; KYNA, kynurenic acid; MFI, mean fluorescence intensity; SCFA, short-chain fatty acid; XANA, xanthurenic acid.
Figure 6
Figure 6
Adaptative immunity is involved in KYNA and XANA protective effects. (A) Lymphocytes-related genes colonic expression after 12 days of oral gavage with KYNA or XANA. (B) Body weight loss, (C) DAI in Rag2-/- after XANA administration. (D) Action of KYNA and XANA on TH17 cell differentiation in vitro. (E) Mitotracker red MFI in Jurkat cells and (F) mouse CD4+ T cells after a stimulation with KYNA and XANA. (G) Mitochondrial metabolisms with OCR measurements, basal and maximal respiration in Seahorse assay on Jurkat cells after KYNA or XANA stimulation for 72 hours. (H) Mitotracker red MFI in AhR-/- mouse CD4+ T cells. (I) Glycolysis metabolism, with ECAR measurements, basal and compensatory glycolysis. (J) Mitochondrial dependence and glycolytic capacity of mouse MLN CD4+T cells assessed by SCENITH at day 9 of DSS-induced colitis. (K) 2DG action on TH17 differentiation in the presence of KYNA and XANA. Data represent one out of two independent experiments. Statistical analysis: for in vitro experiment n=6–9, ex vivo experiments n=10–14 and for in vivo experiment n=7 mice per group, t-test or two-way or one-way ANOVA, with Bonferroni post-test, *: p<0.05, **: p<0.01, ***: p<0.001, ****: p<0.0001. ANOVA, analysis of variance; DSS, dextran sodium sulphate; KYNA, kynurenic acid; MFI, mean fluorescence intensity; SCENITH, Single Cell mEtabolism by profiling Translation inHibition; XANA, xanthurenic acid.
Figure 7
Figure 7
AADAT administration protects from DSS-induced colitis. (A) AADAT quantified in serum of healthy subjects (HS, n=39) and patients with IBD in remission (R, n=238) or in flare (F, n=248), (B) body weight loss, (C) DAI, (D) colon length, (E) relative genes expression of IL-1β, IFNγ, RORc and LCN2, (F) colon histology pictures and (G) histological score. (H) Serum metabolite levels in mice at day 9 of DSS-induced colitis, 1, 6 and 12 hours after AADAT injection. Statistical analysis: n=8–10 mice per group, two-way or one-way ANOVA with Bonferroni post-test, *: p<0.05, **: p<0.01, ***: p<0.001, ****: p<0.0001. AADAT, aminoadipate aminotransferase; ANOVA, analysis of variance; DAI, disease activity index; DSS, dextran sodium sulphate; IBD, inflammatory bowel disease; ns, not significant.

Comment in

References

    1. Furman D, Campisi J, Verdin E, et al. . Chronic inflammation in the etiology of disease across the life span. Nat Med 2019;25:1822–32. 10.1038/s41591-019-0675-0 - DOI - PMC - PubMed
    1. Xu X-R, Liu C-Q, Feng B-S, et al. . Dysregulation of mucosal immune response in pathogenesis of inflammatory bowel disease. World J Gastroenterol 2014;20:3255. 10.3748/wjg.v20.i12.3255 - DOI - PMC - PubMed
    1. Lamas B, Richard ML, Leducq V, et al. . Card9 impacts colitis by altering gut microbiota metabolism of tryptophan into aryl hydrocarbon receptor ligands. Nat Med 2016;22:598–605. 10.1038/nm.4102 - DOI - PMC - PubMed
    1. Sartor RB, Wu GD. Roles for intestinal bacteria, viruses, and fungi in pathogenesis of inflammatory bowel diseases and therapeutic approaches. Gastroenterology 2017;152:327–39. 10.1053/j.gastro.2016.10.012 - DOI - PMC - PubMed
    1. Burger JR, Hou C, Brown JH. Toward a metabolic theory of life history. Proc Natl Acad Sci U S A 2019;116:26653–61. 10.1073/pnas.1907702116 - DOI - PMC - PubMed

Publication types