. 2022 Oct 21;13(1):6271.
doi: 10.1038/s41467-022-33916-3.

Translational reprogramming in response to accumulating stressors ensures critical threshold levels of Hsp90 for mammalian life

Affiliations

Translational reprogramming in response to accumulating stressors ensures critical threshold levels of Hsp90 for mammalian life

Kaushik Bhattacharya et al. Nat Commun. .

Abstract

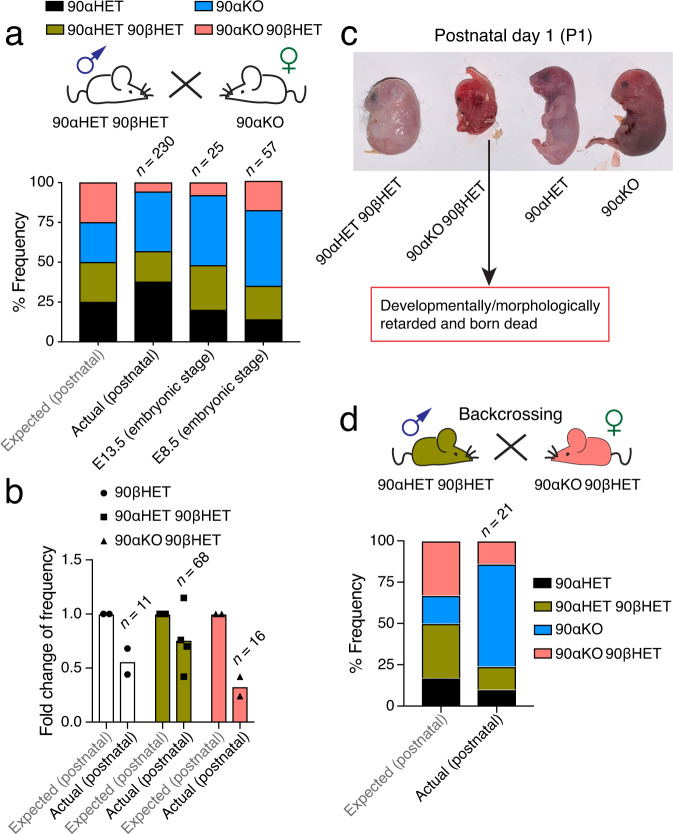
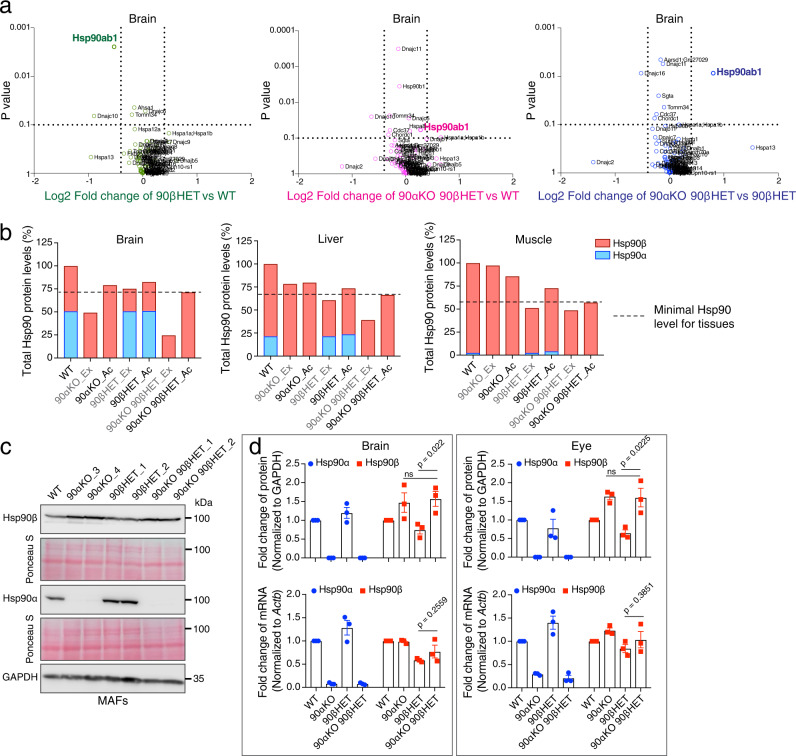
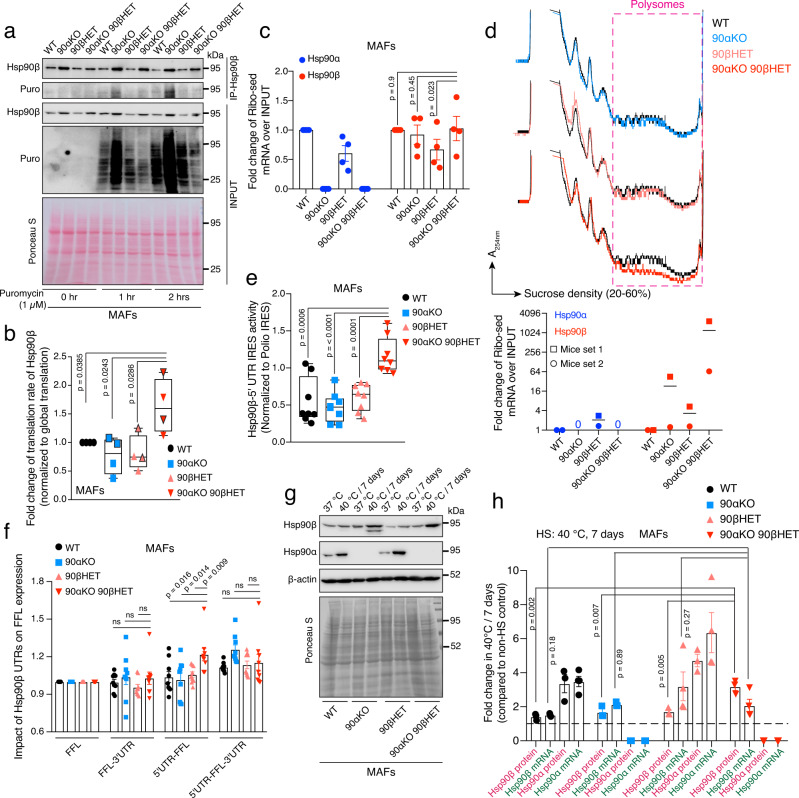
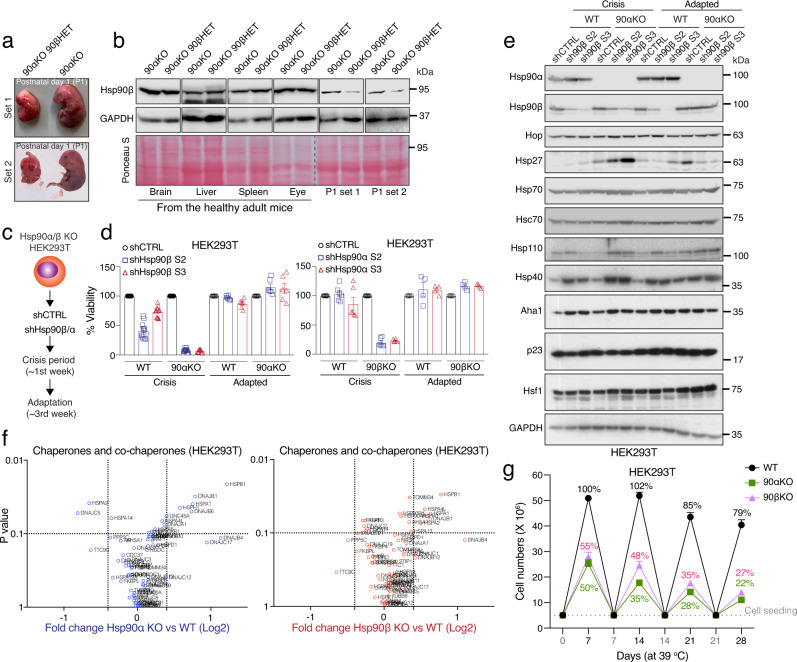
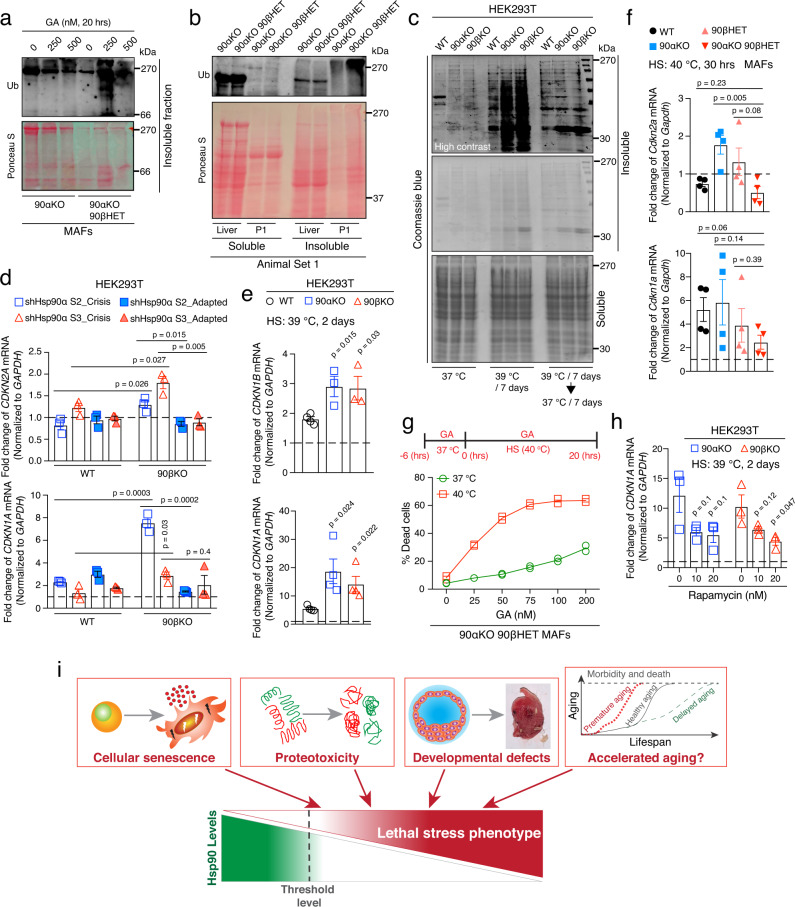
The cytosolic molecular chaperone Hsp90 is essential for eukaryotic life. Although reduced Hsp90 levels correlate with aging, it was unknown whether eukaryotic cells and organisms can tune the basal Hsp90 levels to alleviate physiologically accumulated stress. We have investigated whether and how mice adapt to the deletion of three out of four alleles of the two genes encoding cytosolic Hsp90, with one Hsp90β allele being the only remaining one. While the vast majority of such mouse embryos die during gestation, survivors apparently manage to increase their Hsp90β protein to at least wild-type levels. Our studies reveal an internal ribosome entry site in the 5' untranslated region of the Hsp90β mRNA allowing translational reprogramming to compensate for the genetic loss of Hsp90 alleles and in response to stress. We find that the minimum amount of total Hsp90 required to support viability of mammalian cells and organisms is 50-70% of what is normally there. Those that fail to maintain a threshold level are subject to accelerated senescence, proteostatic collapse, and ultimately death. Therefore, considering that Hsp90 levels can be reduced ≥100-fold in the unicellular budding yeast, critical threshold levels of Hsp90 have markedly increased during eukaryotic evolution.


Conflict of interest statement

The authors declare no competing interests.

Figures

Fig. 1
Fig. 1. Segregation distortion in mice carrying variable numbers of Hsp90 alleles.
a Expected Mendelian inheritance and observed (actual) segregation in live pups (postnatal) or embryos (E8.5 and E13.5) of the indicated genotypes from crossing 90αHET 90βHET and 90αKO mice. Only female 90αKO mice were used in this breeding strategy since male mice of the identical genotype are sterile. b Fold change of the expected and observed genotype frequencies for live pups resulting from different breeding strategies illustrated in Supplementary Fig. 1c–g. The expected frequency of a particular genotype from a specific breeding was set to 1. Each data point corresponds to a specific breeding strategy that produced offspring of the indicated genotype with the number n standing for the total number of pups with that genotype. c Morphology of newborn pups at postnatal day 1 (P1) from crossing 90αHET 90βHET and 90αKO mice. The 90αKO 90βHET pup is stillborn and developmentally retarded in this set. d Expected and observed genotype frequencies in live pups (postnatal) from backcrossing 90αHET 90βHET male and 90αKO 90βHET female. Only female 90αKO 90βHET mice were used in this breeding strategy. n indicates the total number of analyzed pups or embryos. Source data are provided as a Source Data file.
Fig. 2
Fig. 2. Increased Hsp90β protein levels in 90αKO 90βHET survivor mice.
a Volcano plot of the normalized fold changes of the Hsp70-Hsp90-related chaperones, co-chaperones, and other stress-responsive proteins determined by quantitative label-free proteomic analysis of brain (n = 2 biologically independent samples). Log2 fold change of >0.4 or <−0.4 with a p-value of <0.1 were considered to be significant differences for a particular protein. The comparisons between samples of different genotypes are shown in different colors. b Total Hsp90 protein levels and relative proportions of the Hsp90α and Hsp90β isoforms (measured by quantitative label-free proteomic analysis) for the indicated tissues of animals of the different genotypes. Ex, expected Hsp90 protein levels (these are mathematically derived and based on the observed Hsp90 allele-specific contributions to total Hsp90); Ac, actual (observed) Hsp90 protein levels (derived from proteomic analyses). Total Hsp90 protein levels in WT samples were set to 100%. Dotted lines indicate the experimentally observed minimum Hsp90 protein levels for the indicated mouse tissues (means of n = 2 biologically independent samples). c, Immunoblots of Hsp90α and Hsp90β from MAFs (representative of n = 4 biologically independent experiments). Two independent clones of Hsp90 mutant MAFs were analyzed. The Ponceau S-stained nitrocellulose filters and GAPDH immunoblot signal serve as loading controls. d Bar graphs represent normalized protein and mRNA expression of Hsp90α and Hsp90β isoforms in mouse brain and eyes of animals with the indicated genotypes. WT protein or mRNA levels were set to 1 (n = 3 biologically independent samples). The data are represented as mean values ± SEM for the bar graphs. The statistical significance between the groups was analyzed by two-tailed unpaired Student’s t-tests. ns non-significant p-values, MAFs mouse adult fibroblasts. Source data are provided as a Source Data file.
Fig. 3
Fig. 3. Increased translation of the Hsp90ab1 mRNA in 90αKO 90βHET is IRES-driven.
a Translation rate of Hsp90β based on the incorporation of puromycin (Puro). The Ponceau S-stained nitrocellulose filter serves as a loading control for inputs (n = 2 biologically independent experiments). b Relative translation rate of Hsp90β compared to the global protein translation rate in the MAFs of indicated genotypes. Densitometric scores were calculated from the experiments of Fig. 3a. Puromycin labeling for 1 and 2 h, each with two replicates (data points without and with outlines, respectively), was plotted together for a particular genotype. Hsp90β translation in WT samples was set to 1. Note that, solely as an indication, the p-values were calculated as if there were four replicates per genotype, and that a similar trend is seen when the time points are plotted separately. c Normalized fold change of ribosome-associated Hsp90α and Hsp90β mRNAs over inputs in MAFs of the indicated genotypes (see also Supplementary Fig. 6a; n = 4 biologically independent samples). Actb was used as a reference gene. d Representative polysome profiles of mouse brain (set 1) of the indicated genotype. Each profile from a Hsp90 mutant mouse brain was compared to that of WT (Top). The graph below the polysome profiles shows the normalized fold change of brain polysome-associated Hsp90α and Hsp90β mRNAs over inputs (bottom; n = 2 biologically independent mice sets). Gapdh was used as a reference gene. e IRES activities of the 5′-UTR of mouse Hsp90β mRNA, normalized to the respective poliovirus IRES activities (n = 8 biologically independent samples; see also Supplementary Fig. 7b for details on the bicistronic reporter plasmids); values >0 indicate IRES activity. f Impact of the UTRs of mouse Hsp90β mRNA on the translation of firefly luciferase (FFL) (n = 9 biologically independent samples; see also Supplementary Fig. 7e for details on the FFL reporter plasmids). Activities of the FFL reporter without UTRs were set to 1. Note that the Y-axis starts at 0.6. g Representative immunoblots of Hsp90α and Hsp90β from MAFs after 7 days in culture at 37 °C and 40 °C (n = 3 biologically independent experiments). β-actin and the Ponceau S-stained nitrocellulose membrane serve as loading controls. h Normalized fold change of mRNA (green labels, n = 4 biologically independent samples) and protein (pink labels, n = 3 biologically independent samples) expression of Hsp90α and Hsp90β from MAFs after 7 days in culture at 40 °C. Expression values at 37 °C were set to 1 (dashed line). The bar graphs show mean values ± SEM. Box plots with whiskers show the data distribution from minima to maxima, and the lines across the boxes indicate the median values. The statistical significance between the groups was analyzed by two-tailed unpaired Student’s t-tests. Source data are provided as a Source Data file.
Fig. 4
Fig. 4. Below threshold levels of Hsp90 are detrimental for mammalian life.
a Representative image of newborn pups of the indicated genotypes at postnatal day 1. 90αKO 90βHET pups are stillborn and developmentally retarded (see also Fig. 1a, c). b Immunoblots of Hsp90β from the indicated adult tissues (representative of n = 4 biologically independent experiments) or P1 pups (representative of n = 2 biologically independent experiments) of the 90αKO and 90αKO 90βHET genotypes; in this experiment, 90αKO P1 pups were live at birth and 90αKO 90βHET P1 pups were stillborn. GAPDH and Ponceau S-stained nitrocellulose membranes serve as loading controls. c Strategy for the knockdown (KD) of the remaining Hsp90 isoform in Hsp90α/β knockout (KO) HEK293T cells. d Measurement of % cell viability upon KD of the remaining Hsp90 isoform in Hsp90α/β KO HEK293T cells during the crisis period (n = 12 and n = 6 biologically independent samples for the Hsp90β and Hsp90α KD sets, respectively) and after adaptation (n = 6 and n = 4 biologically independent samples for the Hsp90β and Hsp90α KD sets, respectively) compared to that of WT (see panel c for the strategy). Two shRNA (S2 or S3) targeting sequences were designed for each Hsp90 isoform. Cell viability of control (shCTRL) sets was set to 100%. e Immunoblots of molecular chaperones, co-chaperones, and stress-related proteins upon KD of Hsp90β in WT and Hsp90α KO HEK293T cells during the crisis period and after adaptation (representative of n = 2 biologically independent experiments). GAPDH serves as loading control. f Volcano plots of the normalized fold changes of the Hsp70-Hsp90-related chaperones, co-chaperones, and other stress-responsive proteins determined by quantitative label-free proteomic analysis of Hsp90α/β KO and WT HEK293T cells (n = 3 biologically independent samples). Log2 fold change of >0.4 or <−0.4 with a p-value of <0.1 were considered significant differences for a particular protein. Comparisons between samples of different genotypes are shown in different colors. p-values were calculated by a two-tailed unpaired Student’s t-test with Benjamini-Hochberg p-value correction. g Cell proliferation of WT and Hsp90α/β KO HEK293T cells at 39 °C for the indicated time presented as cell numbers (n = 5 biologically independent experiments). Cells were reseeded at the density of 5 × 106 every 7th day. The number of WT cells after the first 7 days in culture was set to 100%. The data of panels d and g are represented as mean values ± SEM for the bar and line graphs, respectively. Source data are provided as a Source Data file.
Fig. 5
Fig. 5. Below threshold levels of Hsp90 augment proteotoxic collapse and cellular senescence.
a Aggregation of total (Ponceau S-stained proteins) and polyubiquitinated proteins in geldanamycin (GA)-treated 90αKO and 90αKO 90βHET MAFs (representative of n = 2 biologically independent experiments). Note that the apparent reduction of polyubiquitinated materials at 500 nM GA compared to 250 nM may be due to GA-induced enhanced degradation of E3-ligases themselves, since many of them are Hsp90 clients. b Total (Ponceau S-stained proteins) and polyubiquitinated detergent-soluble and -insoluble proteins from the liver of adult mice and P1 pups of the indicated genotypes (representative of n = 2 biologically independent experiments). This particular 90αKO 90βHET P1 pup was stillborn (see Fig. 4a). c Analysis by Coomassie blue staining of an SDS-PAGE of HS (39 °C for 7 days)-induced accumulation of detergent-insoluble aggregated proteins and subsequent clearance upon returning to 37 °C in WT and Hsp90α/β KO HEK293T cells (representative of n = 2 biologically independent experiments). d mRNA expression of the senescence markers CDKN2A (p16) and CDKN1A (p21) upon KD of Hsp90α in Hsp90β KO HEK293T cells during the crisis period and after adaptation compared to that of WT (see Fig. 4c for the strategy) (n = 3 biologically independent samples). shCTRL sets were set to 1 (dashed line). e HS (39 °C for 2 days)-induced mRNA expression of the senescence markers CDKN1B (p27; WT, n = 4; Hsp90α/β KO, n = 3 biologically independent samples) and CDKN1A (p21; n = 4 biologically independent samples for all genotypes) in WT and Hsp90α/β KO HEK293T cells. f HS (40 °C for 30 h)-induced mRNA expression of Cdkn2a (p16) and Cdkn1a (p21), in MAFs of the indicated genotypes (n = 4 biologically independent samples). g Flow cytometric quantification of cell death of 90αKO 90βHET MAFs at 40 °C and 37 °C in the absence and presence of GA (n = 2 biologically independent samples). h, Impact of rapamycin on the HS (39 °C for 2 days)-induced mRNA expression of CDKN1A (p21) in Hsp90α/β KO HEK293T cells (n = 3 biologically independent samples). GAPDH/Gapdh was used as a reference gene in all mRNA expression analyses. mRNA expression at 37 °C was set to 1 (dashed line) in panels e, f, and h. The data are represented as mean values ± SEM for the bar and line graphs. The statistical significance between the groups was analyzed by two-tailed unpaired Student’s t-tests. i Schematic representation of the physiological relevance of incompressible Hsp90 levels for mammalian life. Source data are provided as a Source Data file.

References

    1. Bijlsma R, Loeschcke V. Environmental stress, adaptation and evolution: an overview. J. Evol. Biol. 2005;18:744–749. - PubMed
    1. Miller, H. A., Dean, E. S., Pletcher, S. D. & Leiser, S. F. Cell non-autonomous regulation of health and longevity. eLife9 (2020). - PMC - PubMed
    1. van Oosten-Hawle P, Morimoto RI. Organismal proteostasis: role of cell-nonautonomous regulation and transcellular chaperone signaling. Genes Dev. 2014;28:1533–1543. - PMC - PubMed
    1. Taylor RC, Berendzen KM, Dillin A. Systemic stress signalling: understanding the cell non-autonomous control of proteostasis. Nat. Rev. Mol. Cell. Biol. 2014;15:211–217. - PMC - PubMed
    1. Higuchi-Sanabria R, et al. Divergent nodes of non-autonomous UPR(ER) Signaling through serotonergic and dopaminergic neurons. Cell Rep. 2020;33:108489. - PMC - PubMed

Publication types