. 2022 Oct 21;12(1):17692.
doi: 10.1038/s41598-022-21413-y.

Urban ecosystem drives genetic diversity in feral honey bee

Affiliations

Urban ecosystem drives genetic diversity in feral honey bee

Aleksandra Patenković et al. Sci Rep. .

Abstract

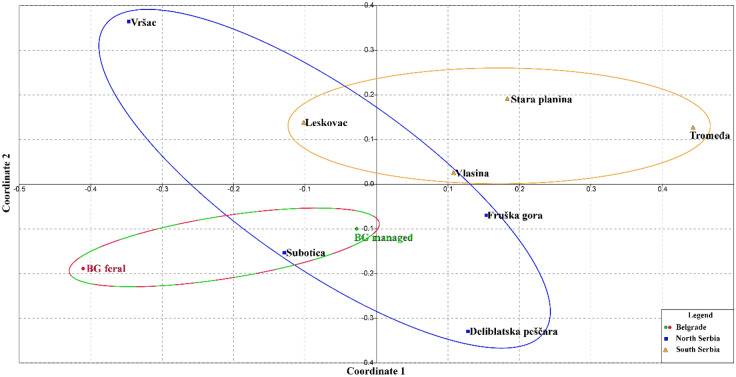
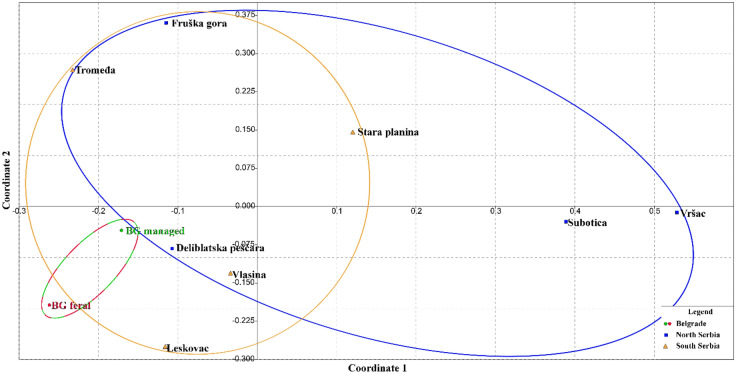
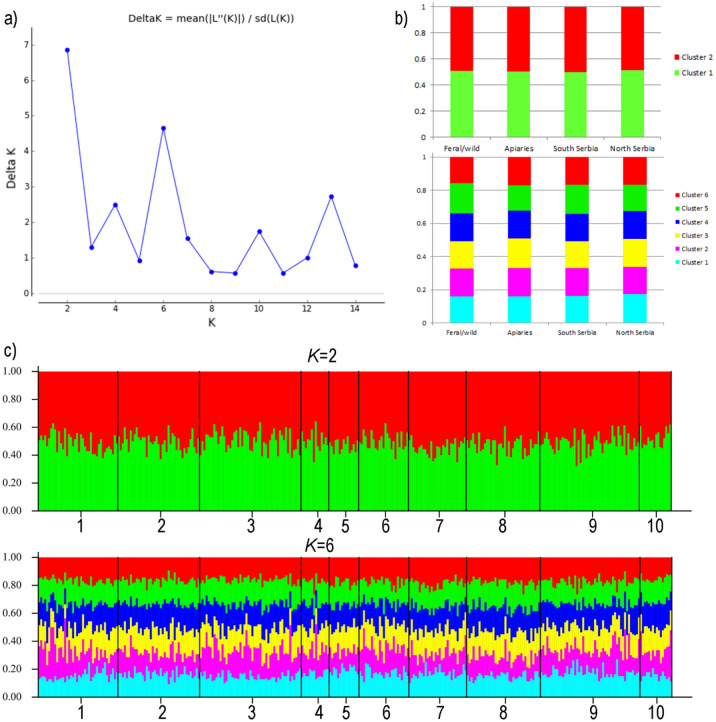
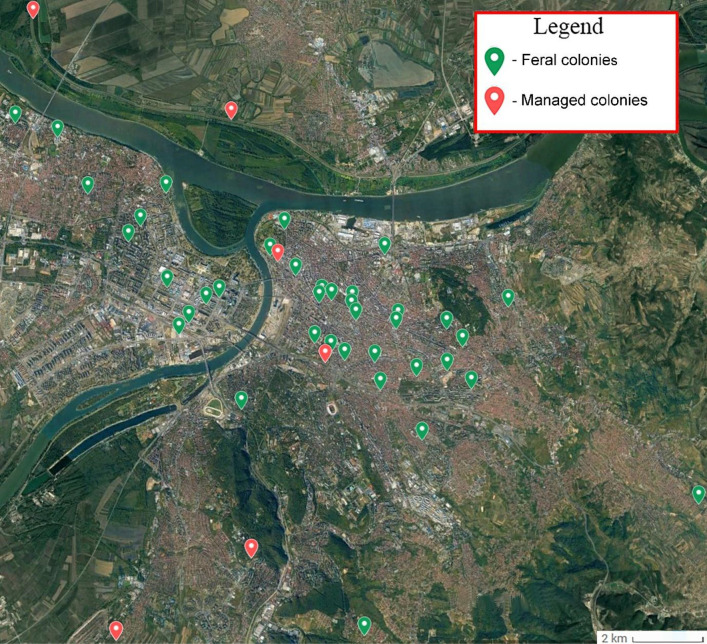
Urbanization can change biodiversity in both directions, positive and negative, and despite the rising global trend of urban beekeeping, little is known about the impact of urbanization on the genetic diversity of honey bees. We investigate how urbanization affects the genetic variability of feral and managed honey bee colonies that are spread throughout the entire city, even in highly urban areas, through genetic analysis of 82 worker bees. We found convincing evidence of high genetic differentiation between these two groups. Additionally, by comparing city samples with 241 samples from 46 apiaries in rural parts of the country, variations in mitochondrial tRNAleu-cox2 intergenic region and microsatellite loci indicated that feral colonies have distinct patterns of genetic diversity. These results, with evidence that feral honey bees find niches within highly modified and human-dominated urban landscapes, lead us to conclude that urbanization is a driver of the genetic diversity of feral honey bees in the city.


Conflict of interest statement

The authors declare no competing interests.

Figures

Figure 1
Figure 1
Median-joining phylogeographic network of mtDNA haplotypes detected in two types of honey bee colonies (feral and managed) in the territory of Belgrade based on the variability of the tRNAleu-cox2 intergenic sequence. The size of the node is proportional to the number of individuals. The numbers represent variable nucleotide positions between different haplotypes.
Figure 2
Figure 2
Non-metric multidimensional scaling plot of FST distances between two types of honey bee colonies from Belgrade and honey bee colonies originating from different regions of Serbia based on the variability of 14 microsatellite loci. The goodness of fit is expressed with the stress value, which is 0.1909 for this data set. Population pairwise FST values are presented in Suppl. Table S7.
Figure 3
Figure 3
Non-metric multidimensional scaling plot of FST distances between two types of honey bee colonies from Belgrade and honey bee colonies originating from different regions of Serbia based on the variability of tRNAleu-cox2 intergenic sequence. The goodness of fit is expressed with the stress value, which is 0.1120 for this data set. Population pairwise FST values are presented in Suppl. Table S8.
Figure 4
Figure 4
Discriminant analysis of principal components in which LDA was performed on the first 62 PCs (out of 197 PCs) cumulatively conserved 98.9% of the total variance. The first and second linear discriminants are presented in the plot.
Figure 5
Figure 5
(a) Δ K mean for the assumed number of genetic clusters. (b) Proportions of inferred STRUCTURE clusters (K = 2 and K = 6). (c) Proportions of the inferred STRUCTURE clusters (K = 2 and K = 6) from the individuals. 1—BG feral, 2—BG managed, 3–6—South Serbia (3—Leskovac, 4—Vlasina, 5—Tromeđa, 6—Stara planina), 7–10—North Serbia (7—Fruška gora, 8—Subotica, 9—Deliblatska peščara, 10—Vršac).
Figure 6
Figure 6
Sampling locations for feral and managed honey bee colonies in Belgrade. The base satellite imagery was obtained from Google Earth, and Adobe Photoshop CC 2015 (https://www.adobe.com/products/photoshop.html) was used to map the data by S. D. The locations overlying the map were obtained from the field using a GPS device (model no: Garmin eTrex 22x).

Similar articles

Cited by

References

    1. United Nations, Department of Economic and Social Affairs & Population Division. World Urbanization Prospects: The 2018 Revision (ST/ESA/SER.A/420). (United Nations, 2019).
    1. Wei YD, Ewing R. Urban expansion, sprawl and inequality. Landsc. Urban Plan. 2018;177:259–265. doi: 10.1016/j.landurbplan.2018.05.021. - DOI
    1. Ayers, A. C. & Rehan, S. M. Supporting bees in cities: How bees are influenced by local and landscape features. Insects12 (2021). - PMC - PubMed
    1. Grimm NB, et al. Global change and the ecology of cities. Science. 2008;319:756–760. doi: 10.1126/science.1150195. - DOI - PubMed
    1. Fahrig L. Effects of habitat fragmentation on biodiversity. Annu. Rev. Ecol. Evol. Syst. 2003;34:487–515. doi: 10.1146/annurev.ecolsys.34.011802.132419. - DOI

Publication types