. 2022 Oct 21;13(1):6266.
doi: 10.1038/s41467-022-33844-2.

DNA methyltransferase 3A controls intestinal epithelial barrier function and regeneration in the colon

Affiliations

DNA methyltransferase 3A controls intestinal epithelial barrier function and regeneration in the colon

Antonella Fazio et al. Nat Commun. .

Abstract

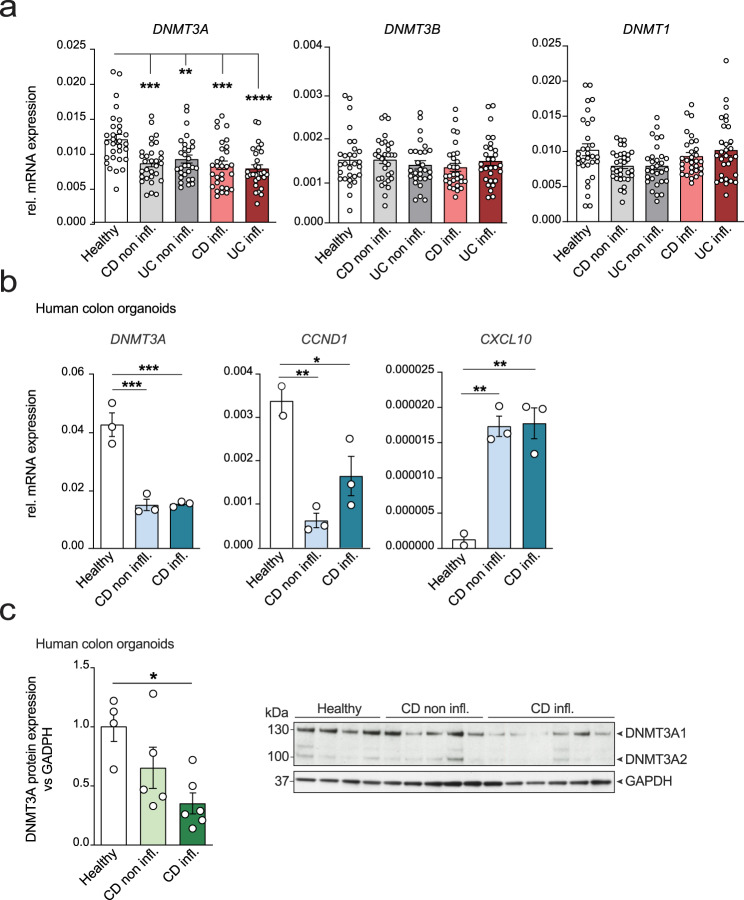
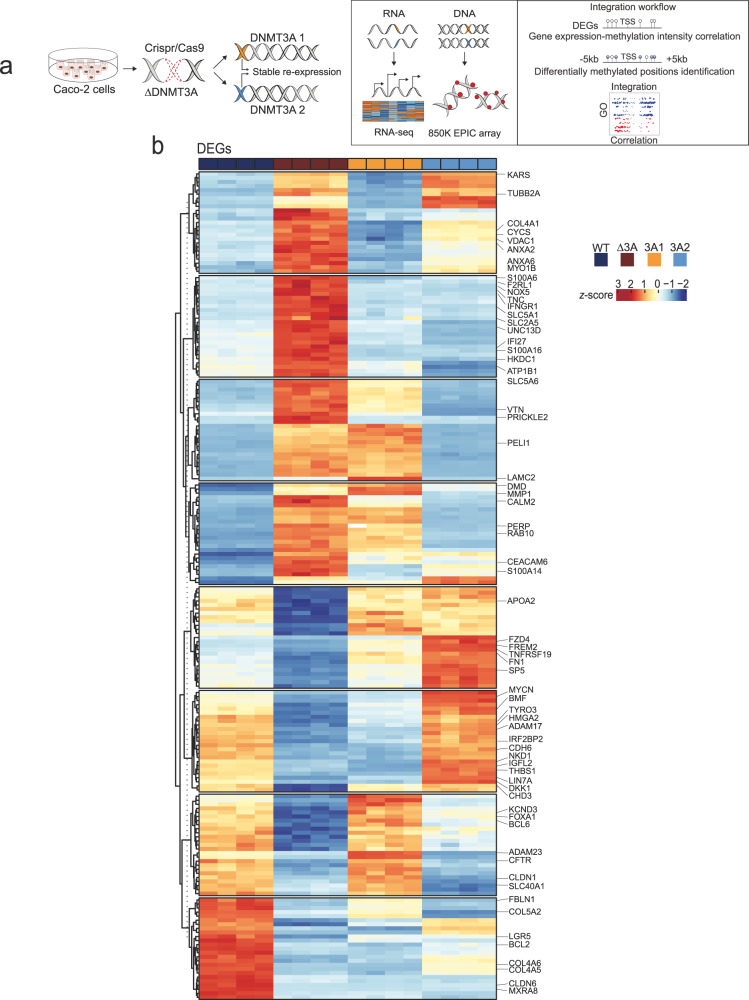
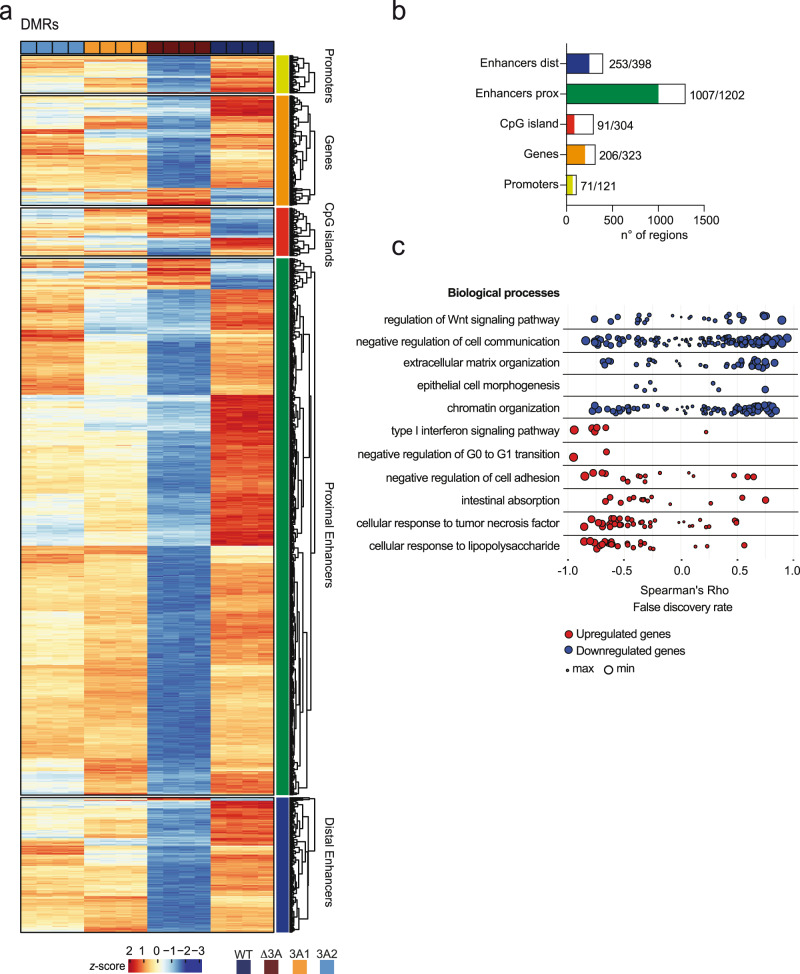
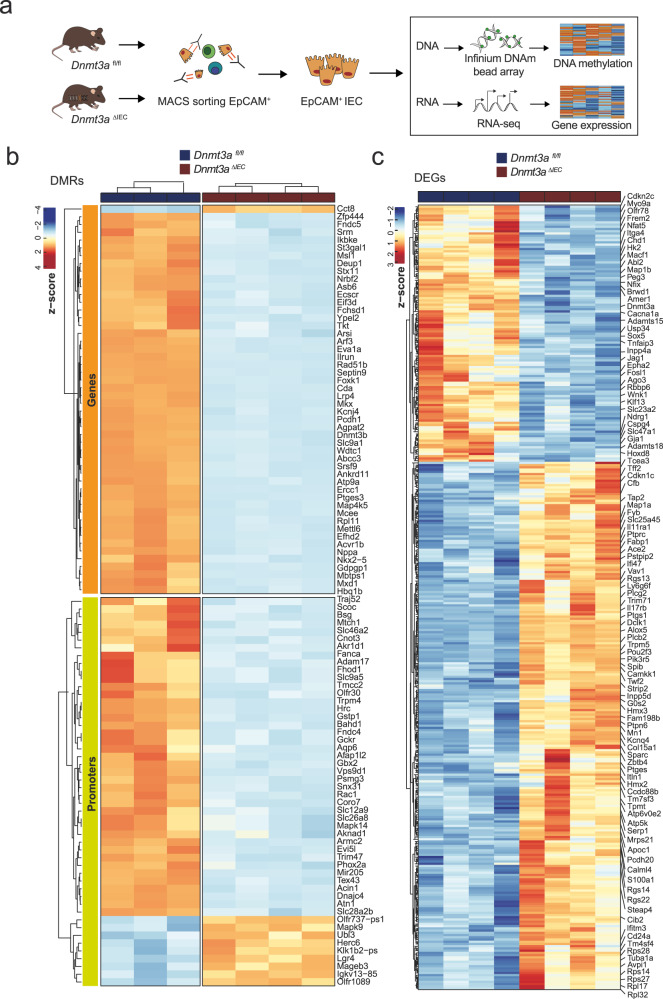
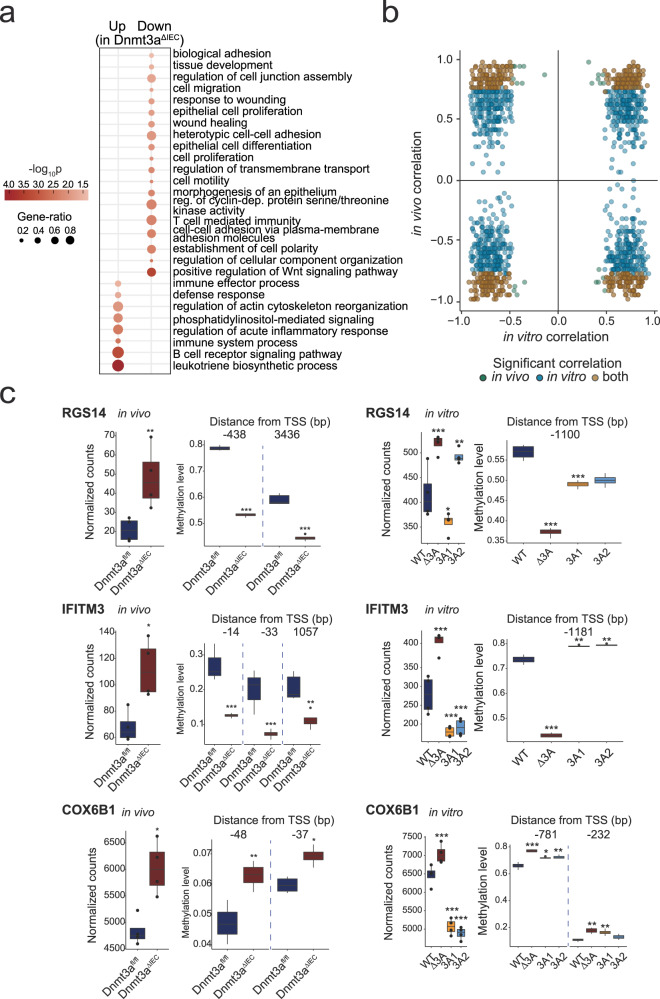
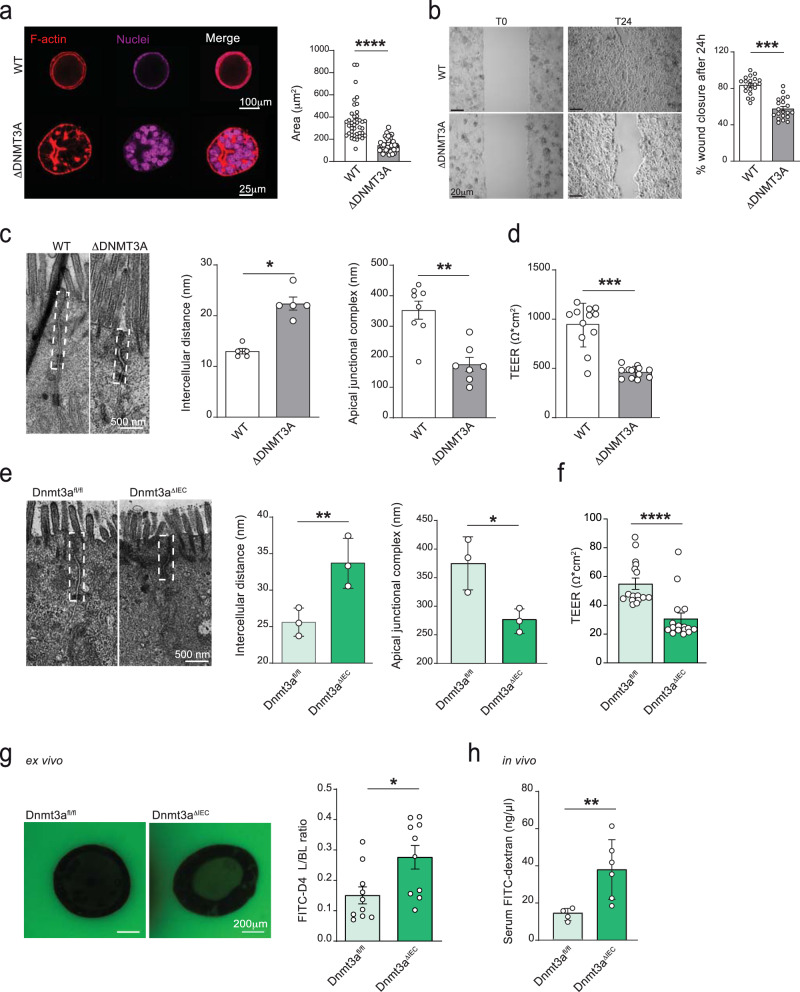
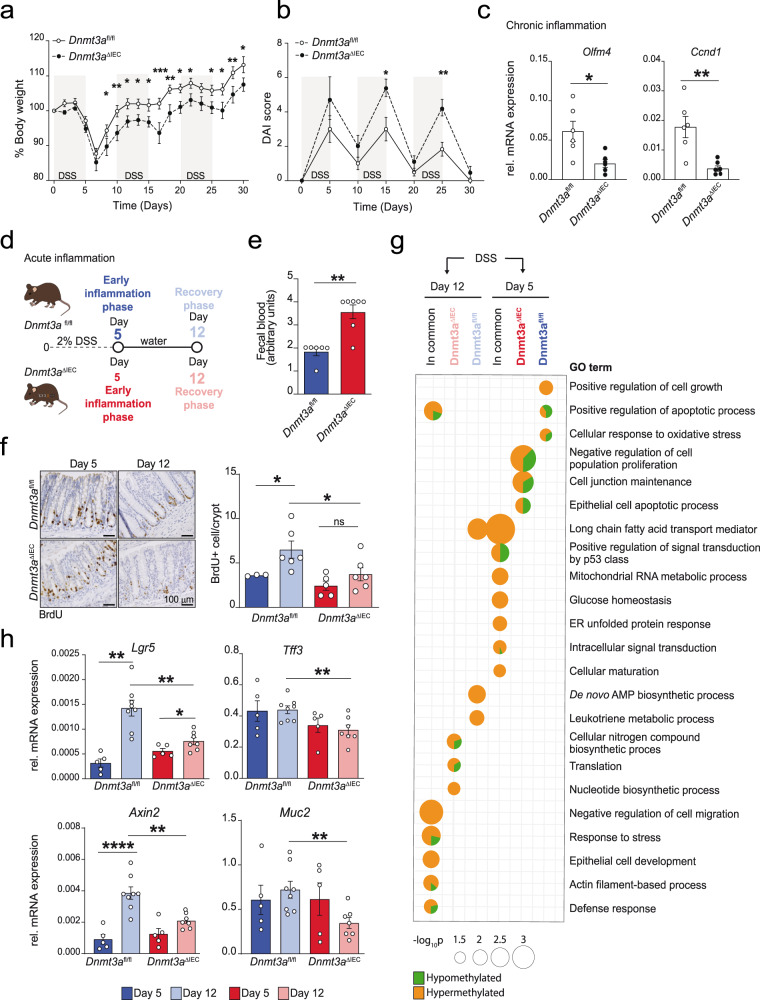
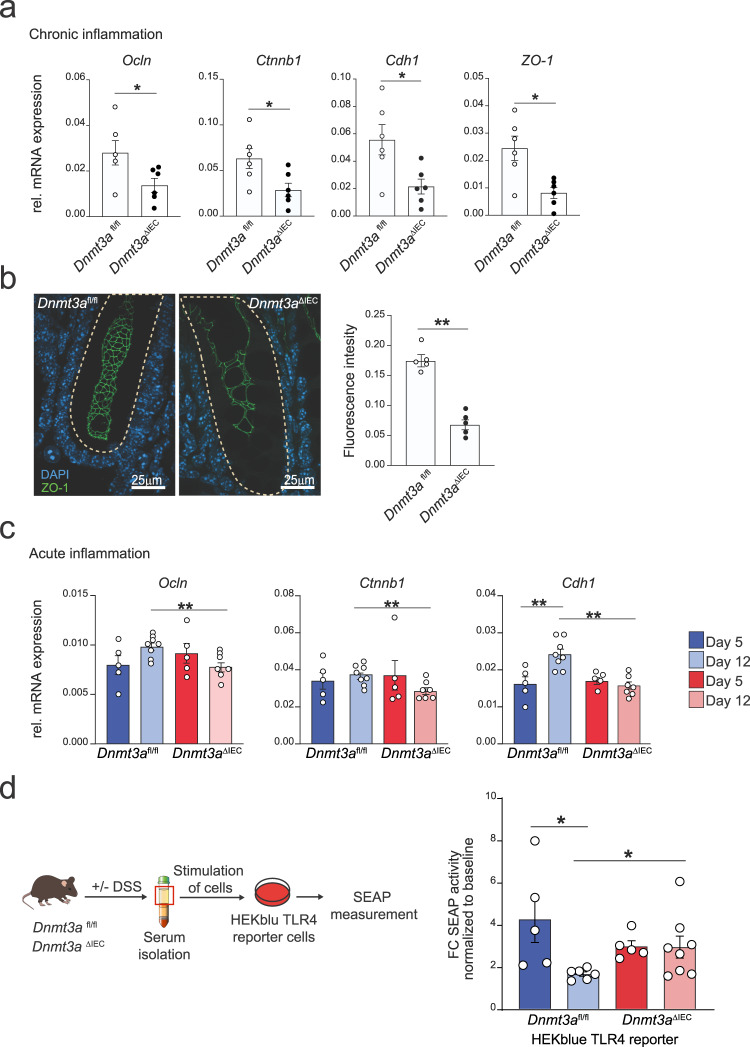
Genetic variants in the DNA methyltransferase 3 A (DNMT3A) locus have been associated with inflammatory bowel disease (IBD). DNMT3A is part of the epigenetic machinery physiologically involved in DNA methylation. We show that DNMT3A plays a critical role in maintaining intestinal homeostasis and gut barrier function. DNMT3A expression is downregulated in intestinal epithelial cells from IBD patients and upon tumor necrosis factor treatment in murine intestinal organoids. Ablation of DNMT3A in Caco-2 cells results in global DNA hypomethylation, which is linked to impaired regenerative capacity, transepithelial resistance and intercellular junction formation. Genetic deletion of Dnmt3a in intestinal epithelial cells (Dnmt3aΔIEC) in mice confirms the phenotype of an altered epithelial ultrastructure with shortened apical-junctional complexes, reduced Goblet cell numbers and increased intestinal permeability in the colon in vivo. Dnmt3aΔIEC mice suffer from increased susceptibility to experimental colitis, characterized by reduced epithelial regeneration. These data demonstrate a critical role for DNMT3A in orchestrating intestinal epithelial homeostasis and response to tissue damage and suggest an involvement of impaired epithelial DNMT3A function in the etiology of IBD.


Conflict of interest statement

The authors declare no competing interests.

Figures

Fig. 1
Fig. 1. DNMT3A expression is downregulated in IBD patients.
a Relative mRNA expression of DNMT3A, DNMT3B, and DNMT1 in biopsies from healthy controls (n = 30), CD non inflamed (non infl.) (n = 30), UC noninflamed (non infl.) (n = 30), CD inflamed (inf.) (n = 30), and UC inflamed (inf.) (n = 30). Beta-actin was used as housekeeping gene. b Gene expression analysis of DNMT3A, CCND1, and CXCL10 in human colonic organoids derived from healthy controls (n = 3), CD non infl. (n = 3), and CD inf. (n = 3) patients. Beta-actin was used as housekeeping gene. c Immunoblot and quantification of DNMT3A protein expression in human colonic organoid lysates derived from healthy controls (n = 4), CD non infl. (n = 5), and CD inf. (n = 6) patients. GAPDH protein expression was use for normalization. The values represent mean ± SEM. Statistical analysis was performed using one-way ANOVA together with Tukey post hoc test. *p < 0.05, **p < 0.01, ***p < 0.001, ****p < 0.0001.
Fig. 2
Fig. 2. Deletion of DNMT3A results in complex mRNA expression changes in Caco-2 cells.
a Schematic representation of cell lines generation and data analysis workflow. Graphical elements modified from ref. . b Heatmaps of differentially expressed genes (DEGs) of WT, ΔDNMT3A, DNMT3A1, and DNMT3A2 cell lines (n = 4). Scaled gene expression/methylation intensity across all samples are plotted.
Fig. 3
Fig. 3. DNA methylation changes in DNMT3A-depleted Caco-2 cells.
a Heatmaps of differentially methylated regions (DMRs) of WT, ΔDNMT3A, DNMT3A1, and DNMT3A2 cell lines (n = 4). Scaled gene expression/methylation intensity across all samples are plotted. b Bar plot indicating number of regions differentially methylated in genes rescued by DNMT3A1 and DNMT3A2 isoforms. c Correlation between gene expression and DNA methylation of up- (red) and downregulated (blue) rescued genes classified by the GO terms to which the genes belong. Top selected GO terms enriched in the rescued genes are shown. Each point represents a gene, and the size of the points is proportional to statistical significance (FDR) of the correlation with larger points being more significant.
Fig. 4
Fig. 4. Transcriptome and methylome profiles in Dnmt3a-deficient IEC in vivo.
a Summary of experimental setup. Graphical elements modified from refs. , . EpCAM positive IECs were obtained from colon tissues and used for RNA-sequencing and methylation profiling using Infinium Mouse Methylation BeadChip array. Heatmaps showing DMRs (b) and DEGs (c) identified in Dnmt3aΔIEC versus Dnmt3afl/fl IECs. (n = 4). Scaled gene expression/methylation intensity across all samples are plotted.
Fig. 5
Fig. 5. Intersection analysis of DNAm-linked DEGs in vivo and in vitro models.
a Gene ontology analysis for biological processes enriched in DEGs in Dnmt3aΔIEC and Dnmt3afl/fl mice. Dot size is proportional to the gene ratio and color corresponds to the p-value of enrichment (two-sided). Top selected GO terms are shown. b Comparison of transcription-methylation correlation between in vitro and in vivo models. Blue and green dots represent the rescued genes that are correlated with one or more nearby DMPs in vitro and in vivo, respectively. Brown dots represent the rescued genes that are correlated with one or more nearby DMPs in both models. c Common genes regulated by DNMT3A in Caco-2 model (in vitro) and in mouse model (in vivo). Gene expression (left panels) (n = 4) and DNA methylation levels (right panels) (n = 4) of RGS14 (Rgs14), IFITM3 (Ifitm3), and COX6B1 (Cox6b1) are shown. Within each boxplot, the horizontal lines denote the median values and the boxes extend from the 25th to the 75th quartile of the distribution. The vertical lines extend to the most extreme values within 1.5 interquartile range of the 25th and 75th percentile of the distribution. P-values are calculated using the DESeq2 method for the transcriptomic data and the hierarchical linear model (limma) for the methylation data. *p < 0.05, **p < 0.01, ***p < 0.001, ****p < 0.0001.
Fig. 6
Fig. 6. DNMT3A regulates intestinal paracellular permeability.
a Representative images of ΔDNMT3A and WT spheroids cultured in 3D matrix for 14 days. Confocal microscopy was used to analyze spheroid organization. Phalloidin (red) and DRAQ5 (purple) was used to visualize actin filaments and nuclei, respectively. Spheroids area (µm2) was determined in WT and ΔDNMT3A (n = 40 over 3 independent experiments). b Representative images of Caco-2 cells, WT and ΔDNMT3A, at 0 h and 24 h after inducing the gap. The percentage of wound closure after 24 h was measured with a phase-contrast microscope using the absolute wound area normalized to the corresponding value at 0 h. (n = 20 over 3 independent experiments). c Transmission electron microscopy (TEM) was used to measure intercellular distance and apical-junctional complex length in WT and ΔDNMT3A Caco-2 cells cultivated on a transwell support (n = 8). d Trans-epithelial electrical resistance (TEER) measurements of differentiated ΔDNMT3A and WT Caco-2 cells (n = 12 over 3 independent experiments). e Representative TEM images and quantification of intercellular distance and apical-junctional complex length of small intestinal sections from Dnmt3aΔIEC and Dnmt3afl/fl mice (n = 3). f TEER measurements of colonic organoids from Dnmt3aΔIEC and Dnmt3afl/fl mice grown as monolayer on transwell support (n = 16 over 4 independent experiments). g Representative images and fluorescence intensity ratio between the luminal (L) and basolateral (BL) side of Dnmt3aΔIEC and Dnmt3afl/fl colonic organoids incubated with FITC-D4 for 24 h (n = 10). h FITC-dextran quantification in serum isolated from Dnmt3aΔIEC and Dnmt3afl/fl mice (n = 6) 1 h after oral administration. The values represent mean ± SEM. Statistical analysis was performed using two-tailed t-test with Mann–Whitney correction. *p < 0.05, **p < 0.01, ***p < 0.001, ****p < 0.0001.
Fig. 7
Fig. 7. Conditional deletion of Dnmt3a in IECs increases susceptibility to inflammation.
Chronic colitis was induced by cyclic administration of 2% DSS (n = 6 female animals/group). Weight loss (a) and diseases activity index (DAI) score (b) were monitored every other day until day 30. c Colon mRNA expression levels of proliferative markers Olfm4 and Ccnd1 in crypts isolated from Dnmt3aΔIEC and Dnmt3afl/fl mice (qRT-PCR) in chronic DSS colitis at day 30 of the experiment. Murine beta-actin was used as housekeeping gene (n = 6). d Acute inflammation experimental model workflow (early inflammation group (day 5) n = 5, recovery post-DSS group (day 12) n = 8). Graphical elements modified from ref. . e Fecal blood content on day 5 (n = 6/7). f Representative images and quantification of BrdU-positive cells from colonic sections of Dnmt3aΔIEC and Dnmt3afl/fl mice. A minimum of 100 crypts/section were assessed. Each dot represents each animal (n = 3/5 day 5, n = 6 day 12). g Gene ontology (GO) analysis for processes enriched in differentially methylated promoters 5 and 12 days after DSS treatment in Dnmt3aΔIEC and Dnmt3afl/fl mice. Dot size is proportional to the statistical significance of the enrichment with larger dots being more significant and color corresponds to the proportion of hypo- (green) and hypermethylated (orange) promoters contributing to each GO term. Top selected GO terms that are unique to or shared between Dnmt3aΔIEC and Dnmt3afl/fl mice are shown. h Colon Lgr5, Tff3, Axin2, Muc2 mRNA expression levels (qRT-PCR) in crypts isolated from Dnmt3aΔIEC and Dnmt3afl/fl mice on day 5 (n = 5) and day 12 (n = 7/8). Murine beta-actin was used as housekeeping gene. The values represent mean ± SEM. Statistical analysis was performed using two-tailed t-test with Mann–Whitney correction or one-way ANOVA together with Tukey post hoc test. *p < 0.05, **p < 0.01, ***p < 0.001, ****p < 0.0001.
Fig. 8
Fig. 8. Apical-junctional proteins are downregulated in Dnmt3aΔIEC mice during inflammation.
a Colon mRNA expression levels of Ocln, Ctnnb1, Cdh1, and ZO-1 in crypts isolated from Dnmt3aΔIEC and Dnmt3afl/fl mice (qRT-PCR) in chronic DSS colitis at day 30 of the experiment (n = 6). Murine beta-actin was used as housekeeping gene. b Representative images and quantification of ZO-1 fluorescence intensity from colonic tissue sections of Dnmt3aΔIEC and Dnmt3afl/fl mice in chronic DSS colitis at day 30 of the experiment. ZO-1 is depicted in green while nuclei in light blue. Each dot represents each animal (n = 5). c Ocln, Ctnnb1, and Cdh1 mRNA expression levels in crypts isolated from colon tissues derived from Dnmt3aΔIEC and Dnmt3afl/fl mice during acute inflammation (day 5, n = 5) and recovery phase (day 12, n = 7/8). Murine beta-actin was used as housekeeping gene. d Schematic workflow (left panel) and SEAP production (right panel) of HEK-Blue TLR4 reporter assay. HEK-Blue TLR4 reporter cells were stimulated with serum derived from mice subjected to early inflammation (day 5, n = 5) and recovery phase (day 12, n = 6/8). Data are shown as fold change normalized with serum from untreated animals. Each dot represents a different mouse donor. The values represent mean ± SEM. Graphical elements modified from refs. , . Statistical analysis was performed using two-tailed t-test with Mann–Whitney correction (a, b) or one-way ANOVA together with Tukey post hoc test (c, d). *p < 0.05, **p < 0.01, ***p < 0.001, ****p < 0.0001.

References

    1. Sommer F, Anderson JM, Bharti R, Raes J, Rosenstiel P. The resilience of the intestinal microbiota influences health and disease. Nat. Rev. Microbiol. 2017;15:630–638. - PubMed
    1. Okumura R, Takeda K. Roles of intestinal epithelial cells in the maintenance of gut homeostasis. Exp. Mol. Med. 2017;49:e338. - PMC - PubMed
    1. Soderholm JD, et al. Augmented increase in tight junction permeability by luminal stimuli in the non-inflamed ileum of Crohn’s disease. Gut. 2002;50:307–313. - PMC - PubMed
    1. Schreiber S, Rosenstiel P, Albrecht M, Hampe J, Krawczak M. Genetics of Crohn disease, an archetypal inflammatory barrier disease. Nat. Rev. Genet. 2005;6:376–388. - PubMed
    1. Ventham, N. T. et al. Integrative epigenome-wide analysis demonstrates that DNA methylation may mediate genetic risk in inflammatory bowel disease. Nat. Commun.10.1038/ncomms13507 (2016). - PMC - PubMed

Publication types