. 2022 Nov;23(11):1536-1550.
doi: 10.1038/s41590-022-01324-w. Epub 2022 Oct 21.

Mechanisms of CD40-dependent cDC1 licensing beyond costimulation

Affiliations

Mechanisms of CD40-dependent cDC1 licensing beyond costimulation

Renee Wu et al. Nat Immunol. 2022 Nov.

Abstract

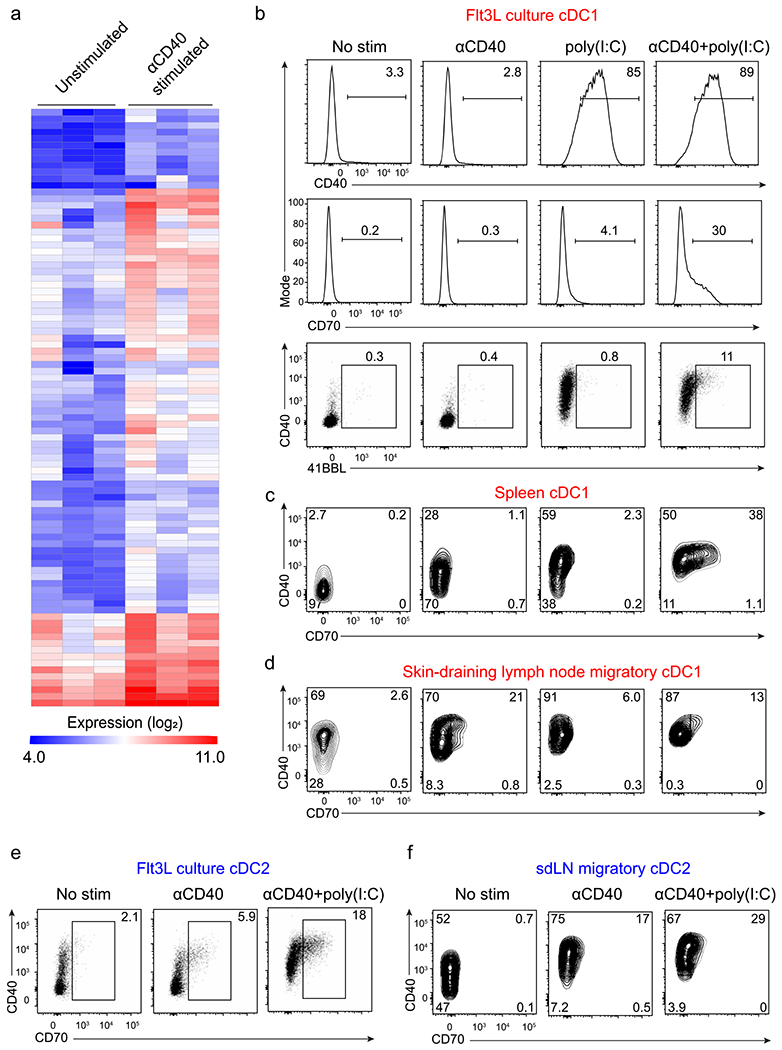
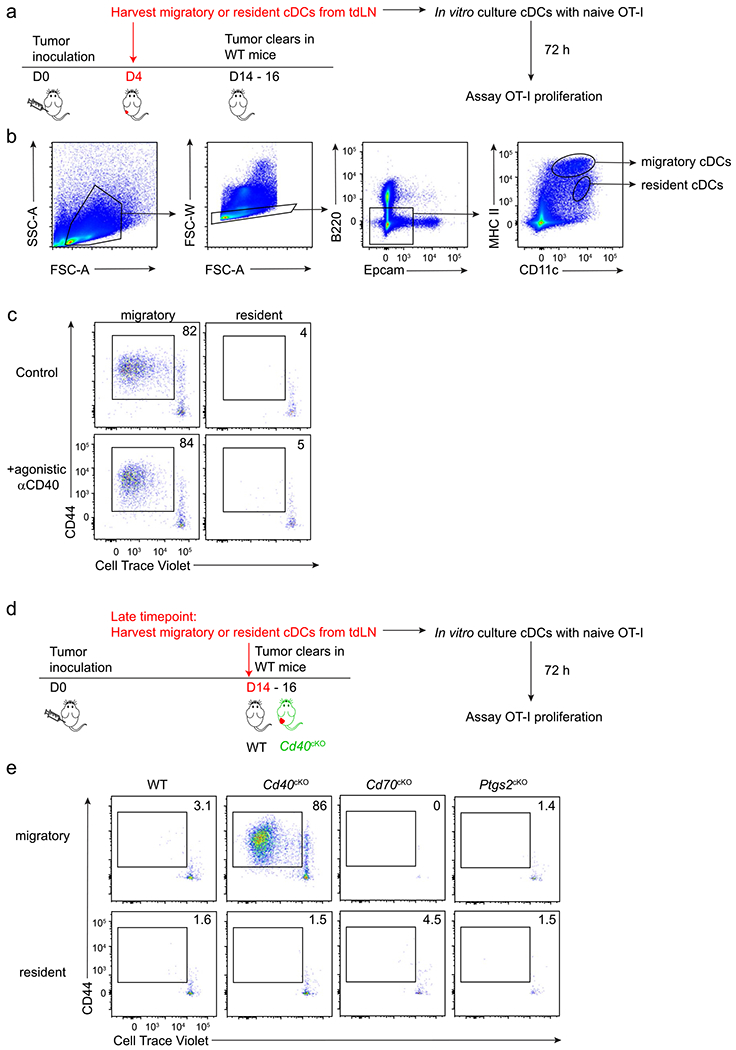
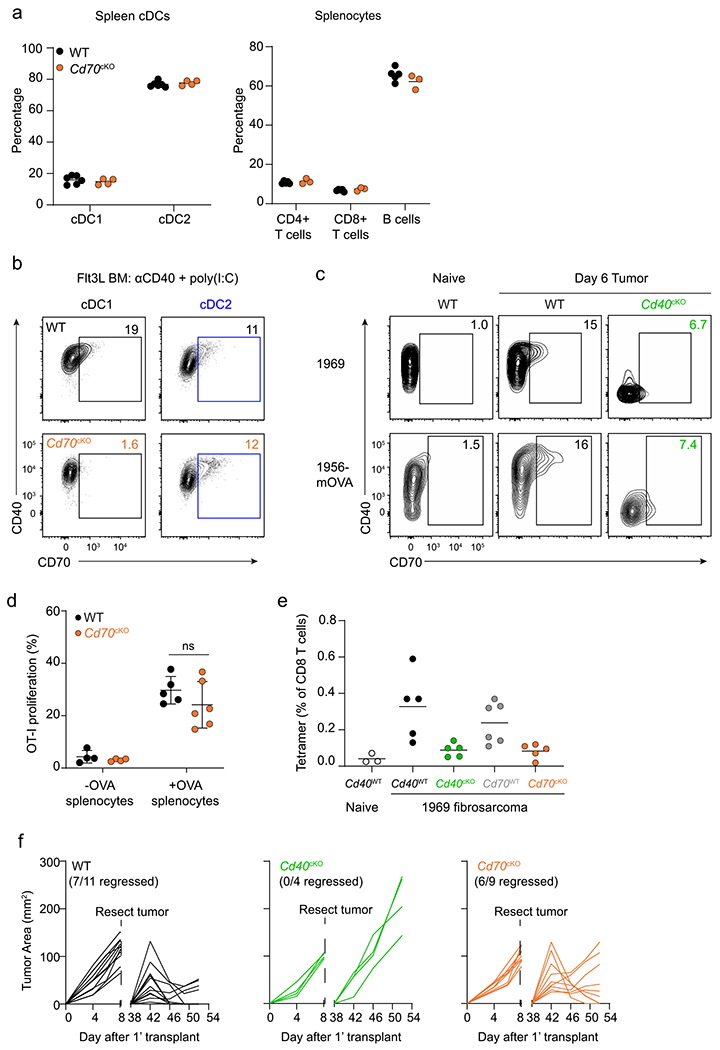
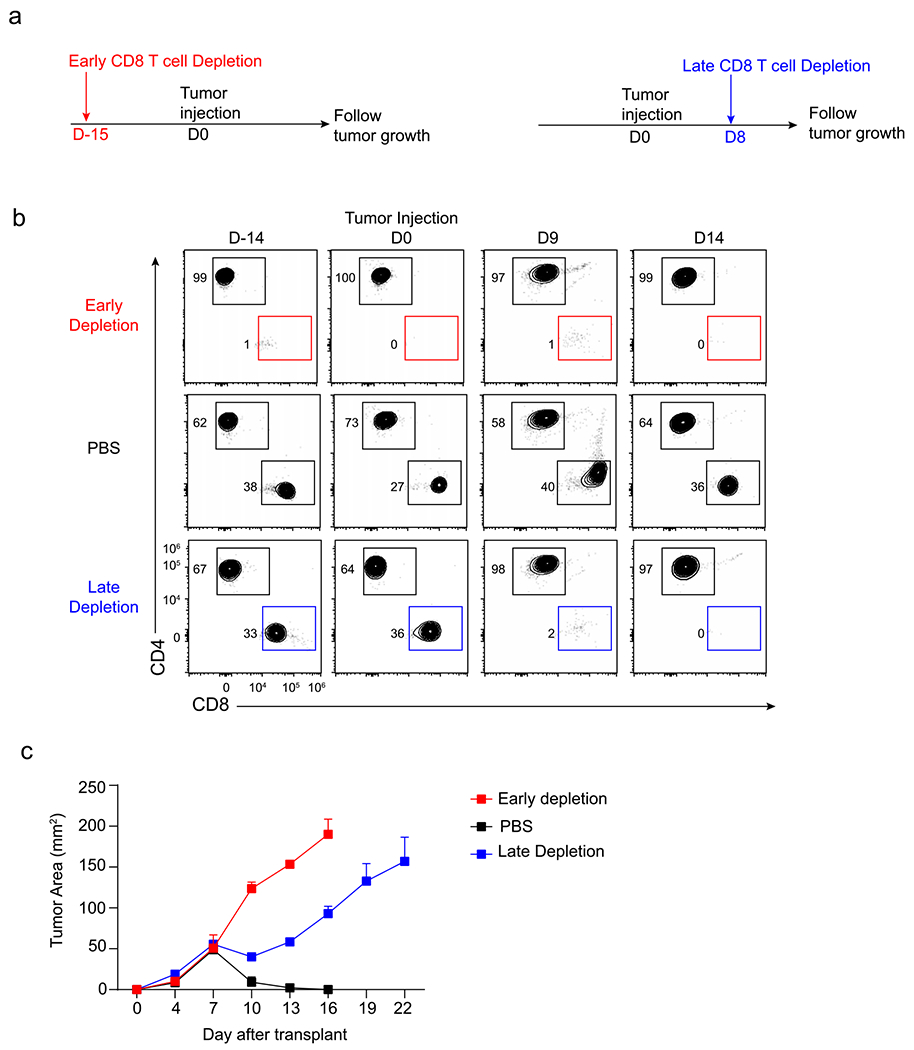
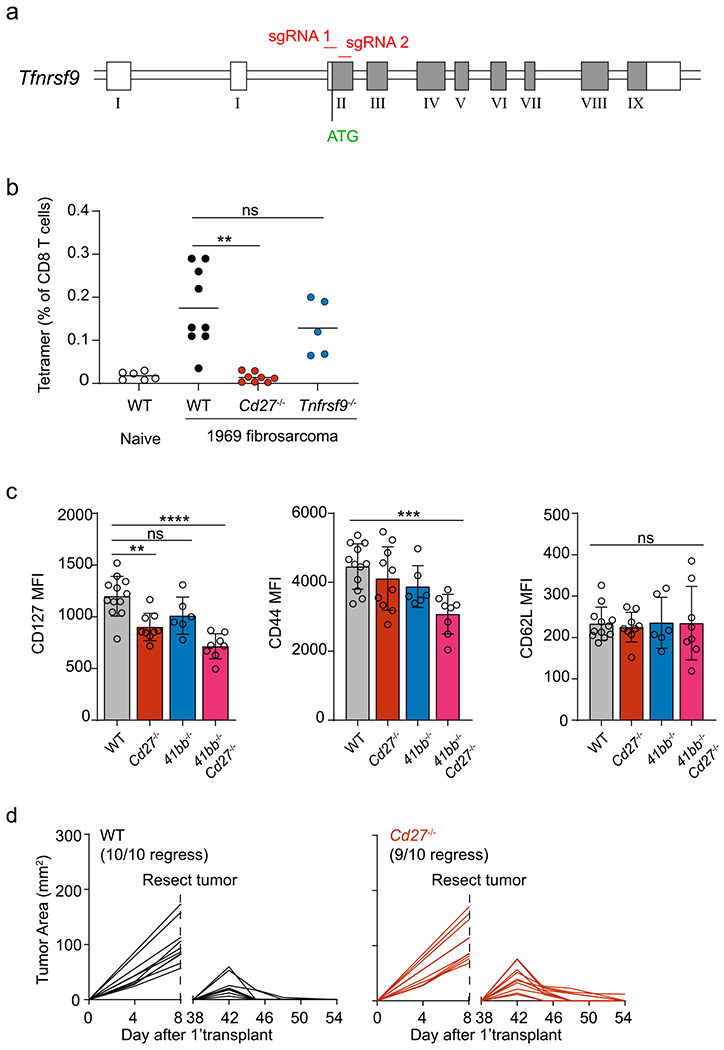
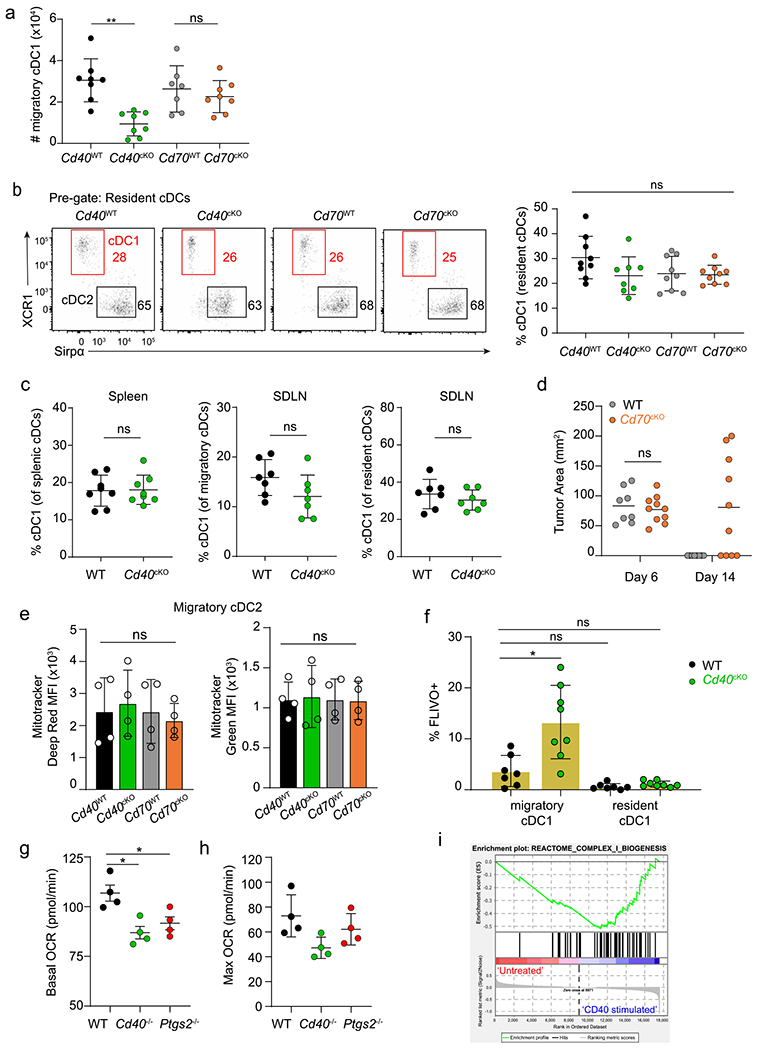
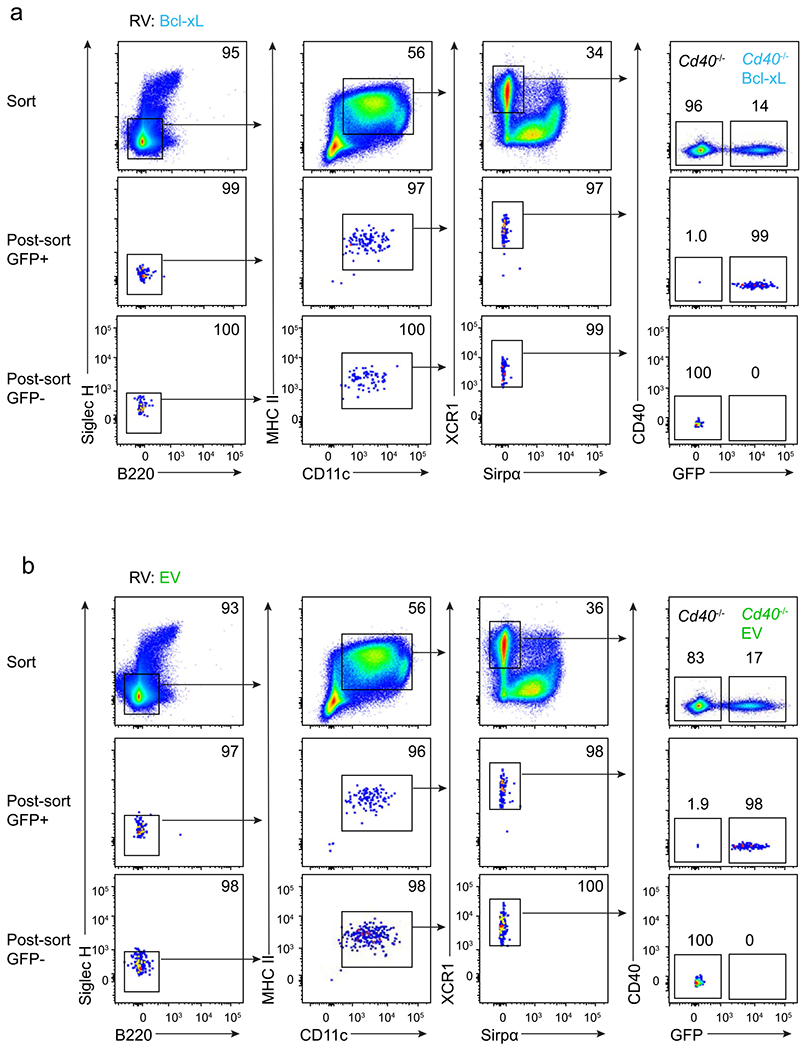
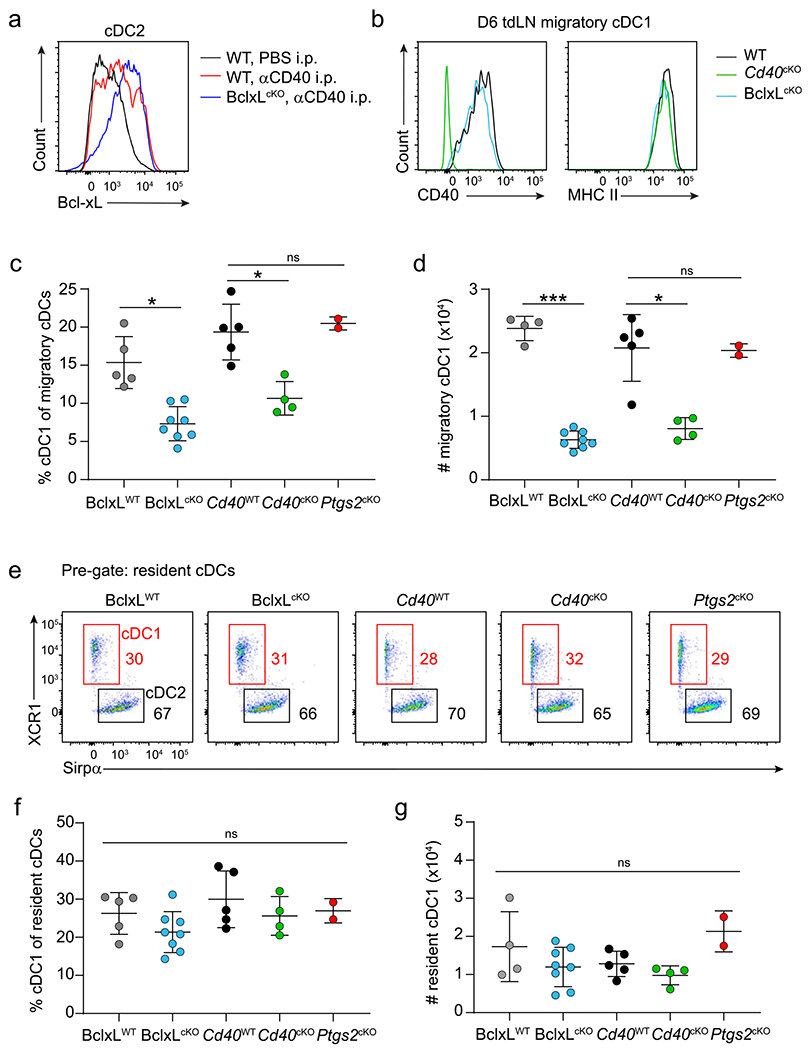
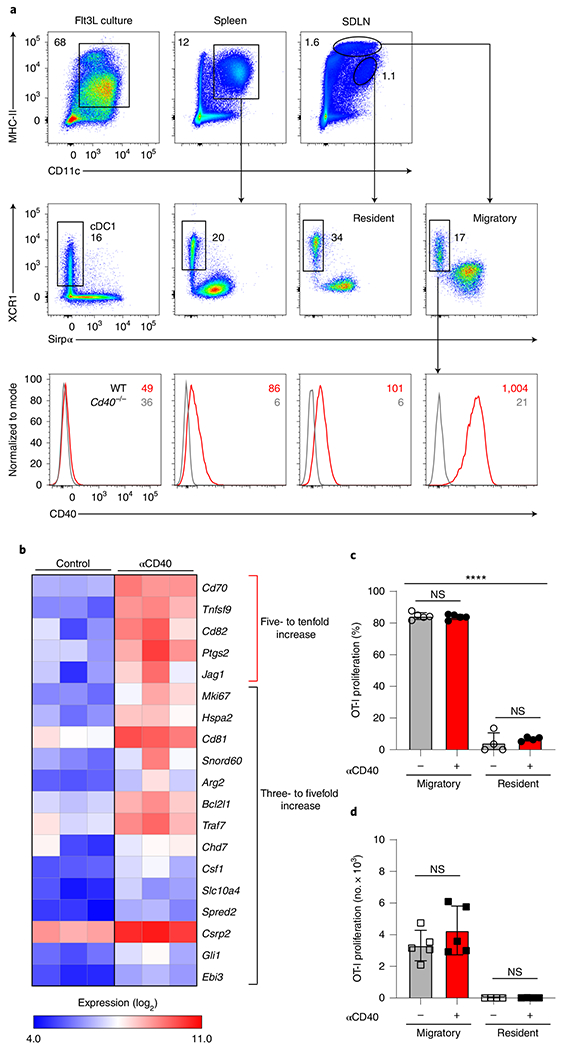
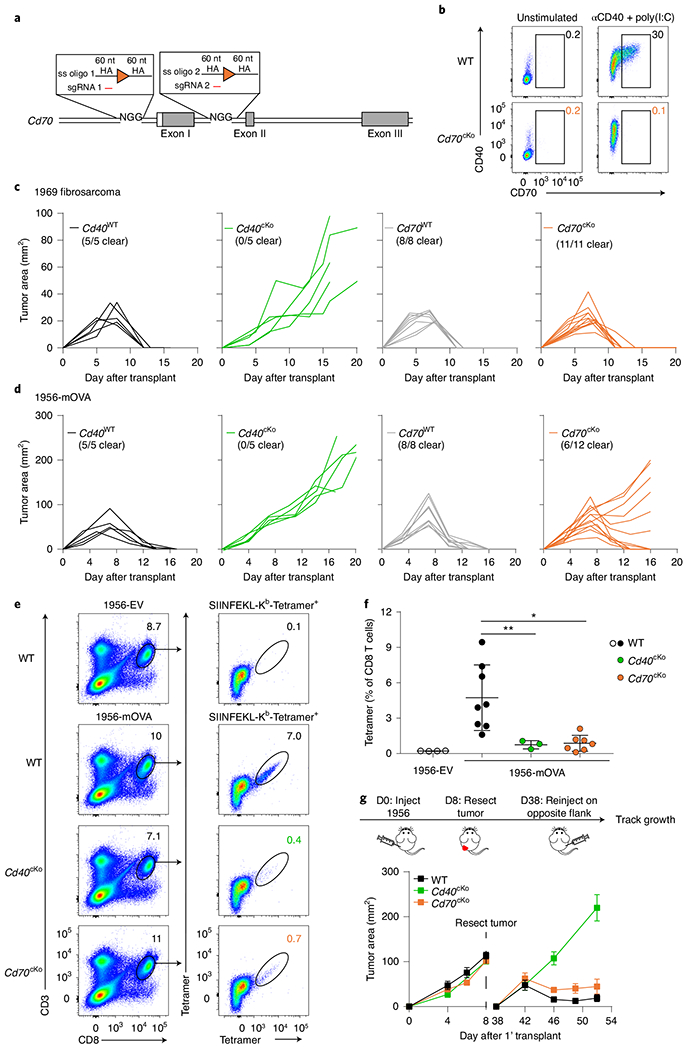
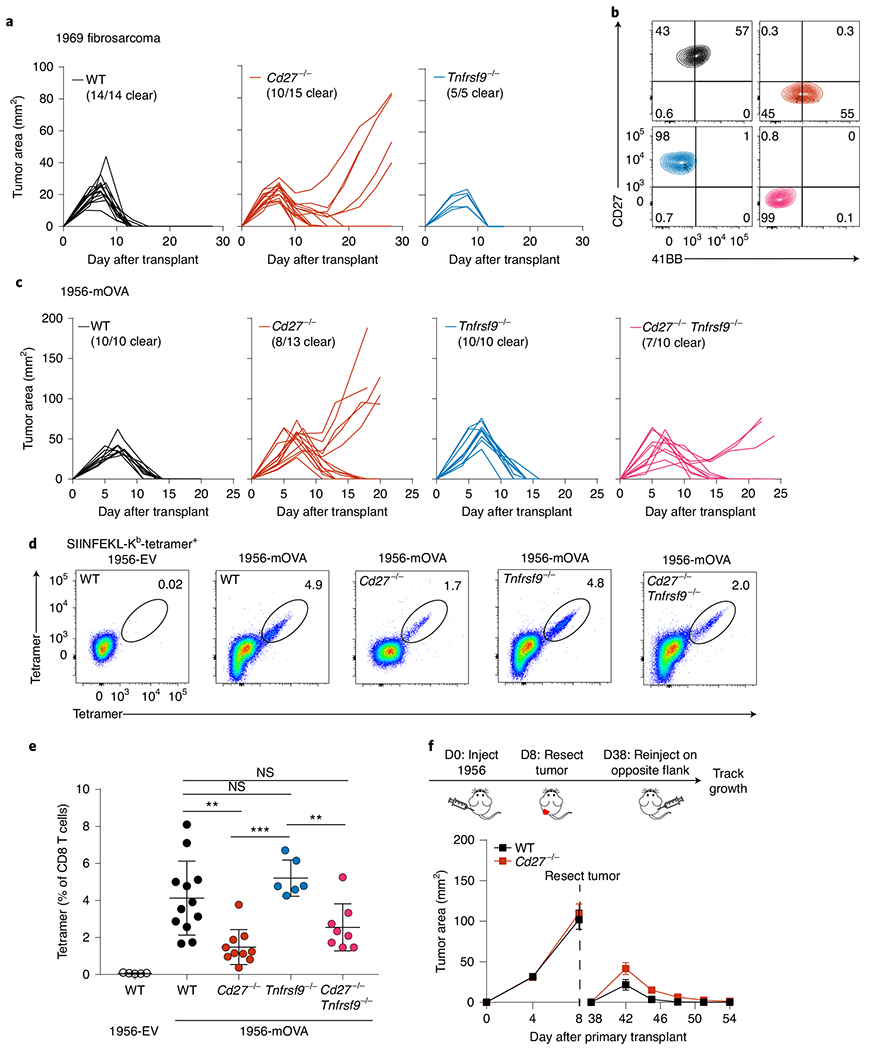
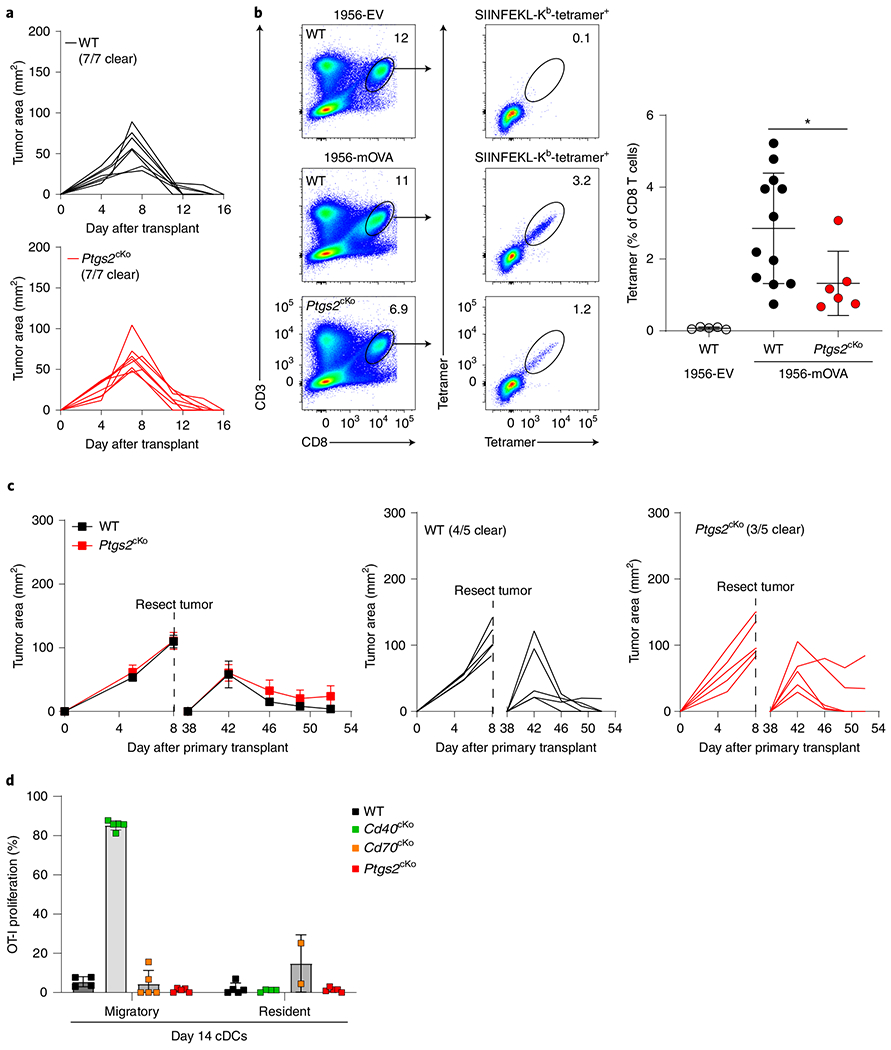
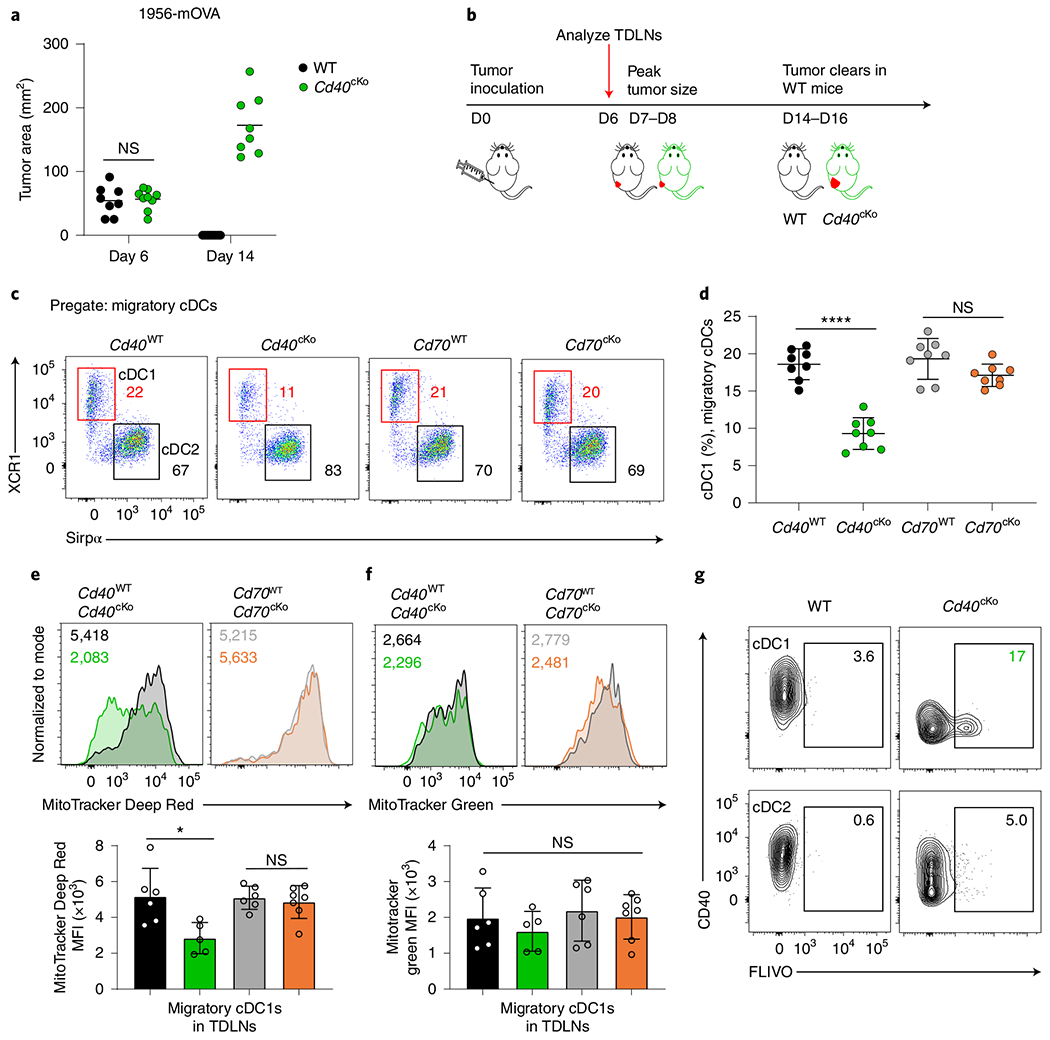
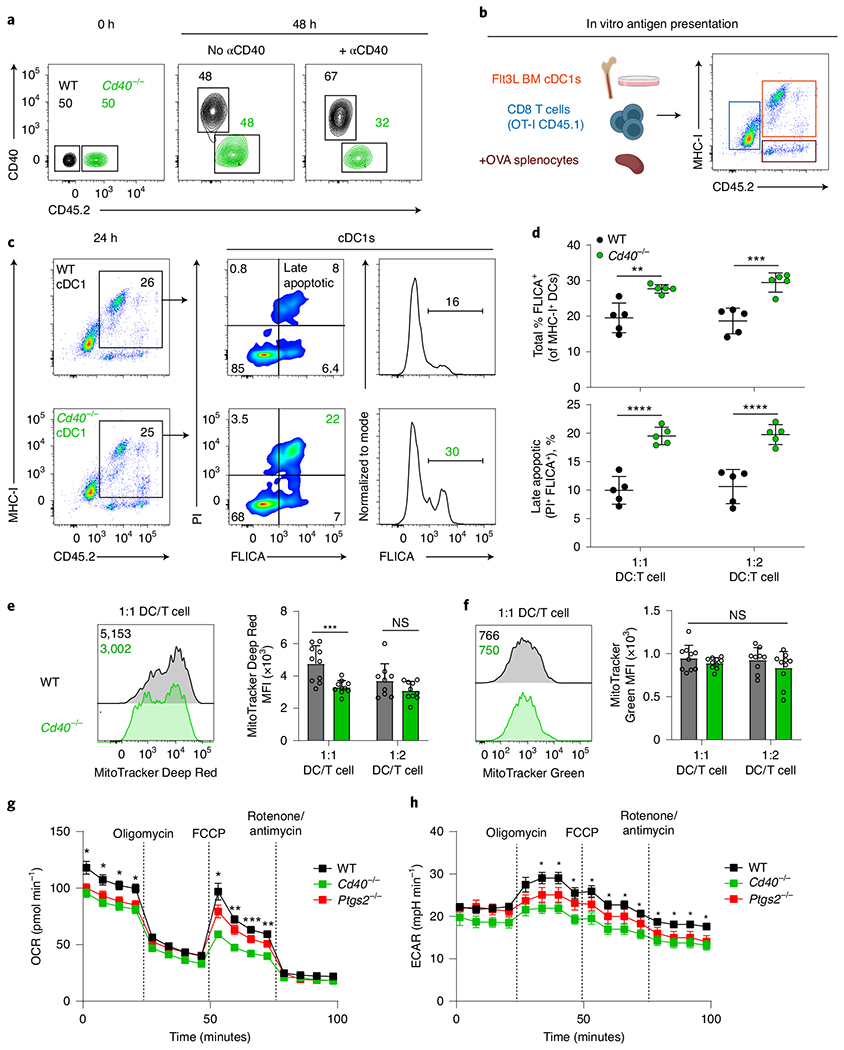
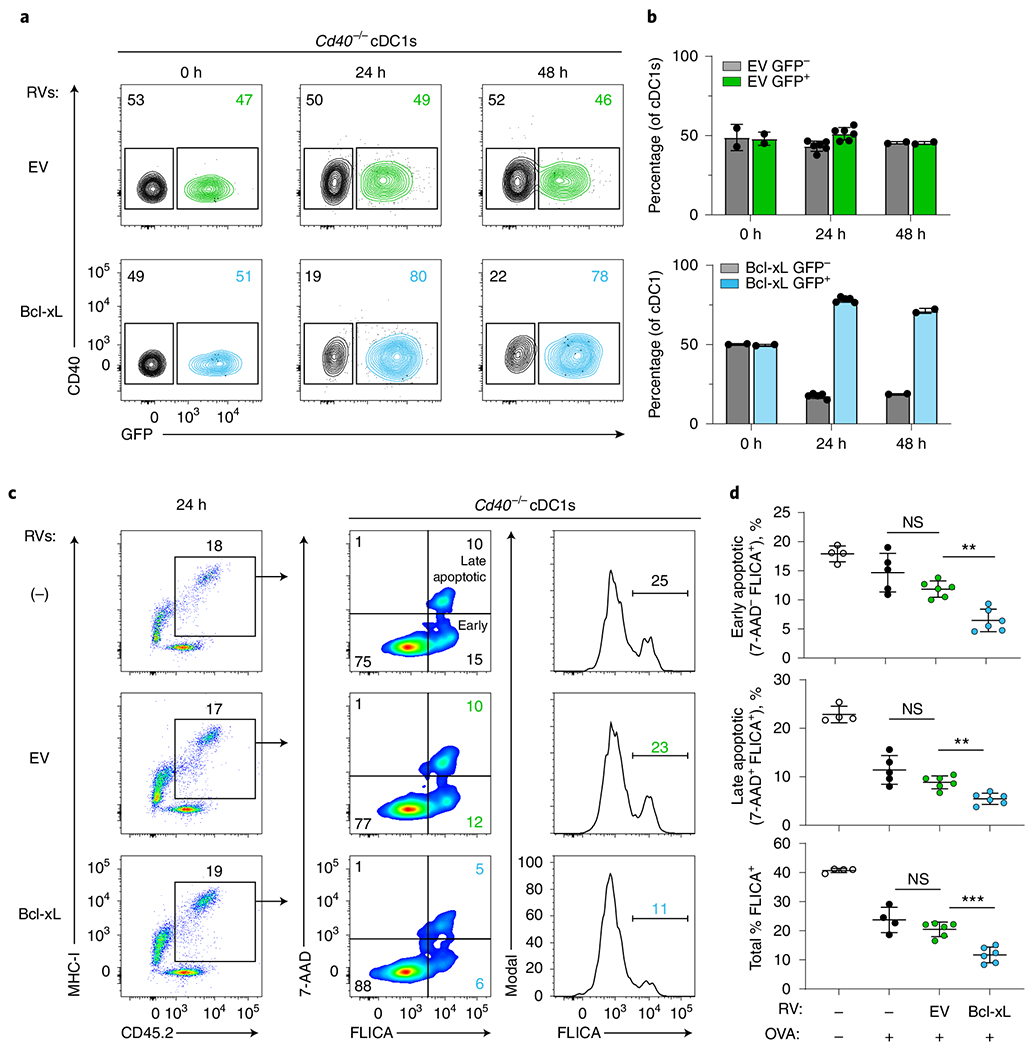
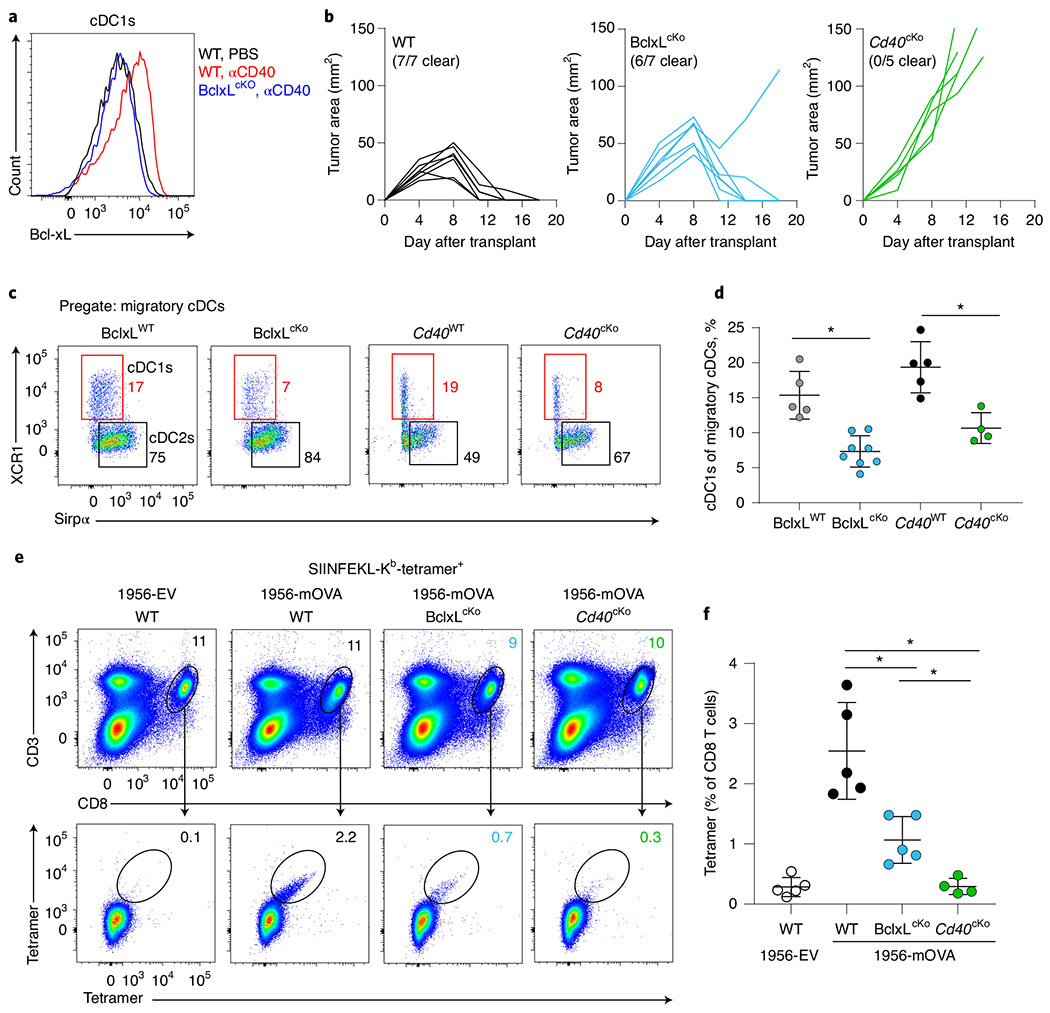
CD40 signaling in classical type 1 dendritic cells (cDC1s) is required for CD8 T cell-mediated tumor rejection, but the underlying mechanisms are incompletely understood. Here, we identified CD40-induced genes in cDC1s, including Cd70, Tnfsf9, Ptgs2 and Bcl2l1, and examined their contributions to anti-tumor immunity. cDC1-specific inactivation of CD70 and COX-2, and global CD27 inactivation, only partially impaired tumor rejection or tumor-specific CD8 T cell expansion. Loss of 4-1BB, alone or in Cd27-/- mice, did not further impair anti-tumor immunity. However, cDC1-specific CD40 inactivation reduced cDC1 mitochondrial transmembrane potential and increased caspase activation in tumor-draining lymph nodes, reducing migratory cDC1 numbers in vivo. Similar impairments occurred during in vitro antigen presentation by Cd40-/- cDC1s to CD8+ T cells, which were reversed by re-expression of Bcl2l1. Thus, CD40 signaling in cDC1s not only induces costimulatory ligands for CD8+ T cells but also induces Bcl2l1 that sustains cDC1 survival during priming of anti-tumor responses.


Figures

Extended Data Fig. 1 |
Extended Data Fig. 1 |. CD40 stimulation induces CD70 and 4-1BBL expression in cDCs.
a, Hierarchical clustering of 89 genes induced at least two-fold in SDLN cDC1s treated in vitro in the absence or presence of agonistic αCD40 antibody (results averaged from three independent experiments). b, Day 8 Flt3L-treated WT (B6) bone marrow cultures were treated with no stimulation, agonistic αCD40 antibody, poly(I:C), or both. cDC1 surface expression of CD40 (top), CD70 (middle) and 4-1BBL (bottom) was analyzed by flow cytometry after 24 h. Pre-gate: B220 Siglec H MHC class II+ CD11c+ XCR1+ Sirpα. Numbers represent the percentage of cells in the indicated gates. Data represent two independent experiments. c, d, f, WT mice were injected i.p. with PBS, agonistic αCD40 antibody, poly(I:C), or both. c, Spleens were harvested 24 h after injection and cDC1 were analyzed for surface expression of CD40 and CD70 by flow cytometry. Pre-gate: B220 F4/80 MHC class II+ CD11c+ XCR1+ Sirpα. Numbers represent the percentage of cells in the indicated gates. Data represent two independent experiments. d, SDLN were harvested 24 h after injection and cDC1 were analyzed for surface expression of CD40 and CD70 by flow cytometry. Pre-gate: B220 CD326 MHC class II+ CD11cint XCR1+ Sirpα. Numbers represent the percentage of cells in the indicated gates. Data represent two independent experiments. e, Day 8 Flt3L-treated bone marrow cultures were treated with no stimulation, agonistic αCD40 antibody, poly(I:C), or both. cDC2 surface expression of CD40 and CD70 were analyzed by flow cytometry after 24 h. Pre-gate: B220 Siglec H MHC class II+ CD11c+ XCR1Sirpα +. Numbers represent the percentage of cells in the indicated gates. Data represent two independent experiments. f, SDLN were harvested 24 h after injection and cDC2 were analyzed for surface expression of CD40 and CD70 by flow cytometry. Pre-gate: B220 CD326 MHC class IIhi CD11cint XCR1 Sirpα +. Numbers represent the percentage of cells in the indicated gates. Data represent two independent experiments.
Extended Data Fig. 2 |
Extended Data Fig. 2 |. Analysis of migratory and resident cDCs for tumor-antigen presentation.
a, Experimental setup for Fig. 1c, d and Extended Data Fig. 2c. Migratory and resident cDCs from TDLN of B6 WT day 4 tumor-bearing mice were isolated and cultured in vitro with naïive CTV-labeled OT-I CD8 T cells in the presence or absence of agonistic CD40 antibody. Proliferation of OT-Is was analyzed 72 hours later. b, Gating strategy for migratory and resident cDCs. c, Representative flow plots depicting CD44 surface expression and CTV dilution of OT-Is as described in a. d, Experimental setup for Fig. 4d and Extended Data Fig. 2e to assess whether resident cDCs access tumor antigens at late stages of tumor challenge and prime naïive CD8 T cells. Migratory and resident cDCs were isolated from TDLNs of WT (black), Cd40cKO (Xcr1Cre/+ Cd40fl/fl, green), Cd70cKO (Xcr1Cre/+ Cd70fl/fl, orange), or Ptgs2cKO (red) mice that were injected with 106 1956-mOVA 14 days previously, although only Cd40cKO mice still had tumor, and cultured in vitro with naïive CTV-labeled OT-I CD8 T cells. Proliferation of OT-Is was analyzed 72 hours later. e, Representative flow plots depicting CD44 surface expression and CTV dilution of OT-Is as described in d.
Extended Data Fig. 3 |
Extended Data Fig. 3 |. CD70 deficiency does not impair cDC1 development.
a, Percentages of splenic cDCs (left) and T and B cells (right) between WT (Xcr1+/+ Cd70fl/fl, black circles) and Cd70cKO (Xcr1Cre/+ Cd70fl/fl, orange circles) mice at homeostasis. b, Representative flow plots depicting CD70 expression in cDC1 (left) and cDC2 (right) from Flt3L-treated BM cultures of WT (top) and Cd70cKO (bottom) stimulated with αCD40 + poly(I:C). c, Representative flow plots showing CD70 and CD40 expression in migratory cDC1s of naive SDLN (left) and day 6 TDLNs (1969 fibrosarcoma, top; 1956-mOVA, bottom) of WT (Xcr1+/+ Cd40fl/fl) and Cd40cKO (Xcr1+/+ Cd40fl/fl) mice. d, Proliferation of CTV-labeled OT-I CD8 T cells adoptively transferred into WT (Xcr1+/+ Cd70fl/fl, black circles) or Cd70cKO (orange circles) mice was analyzed 72 h after immunization with OVA-loaded splenocytes. Data represent pooled biologically independent samples from two independent experiments (n = 4 for WT and Cd70cKO –OVA splenocytes, n = 5-6 for WT and Cd70cKO + OVA splenocytes). Data represented as mean +/− s.d. e, Cd40WT (Xcr1+/+ Cd40fl/fl), Cd40cKO, Cd70WT (Xcr1+/+ Cd70fl/fl), and Cd70cKO mice were injected with 106 1969 cells, and spleens were stained for the presence of mGpd2 tetramer+ CD8 T cells on day 10. Data represent pooled biologically independent samples from three independent experiments (n = 3 for naive, n = 5 for Cd40WT, n = 5 for Cd40cKO, n = 6 for Cd70WT, and n = 5 for Cd70cKO mice). f, Individual tumor curves of WT (Xcr1+/+ Cd70fl/fl), Cd40cKO, and Cd70cKO mice during primary and secondary implantation with 1956 progressor tumor. d: Brown–Forsythe and Welch ANOVA with Dunnett’s T3 multiple comparisons test.
Extended Data Fig. 4 |
Extended Data Fig. 4 |. Early and late CD8 T cell responses support anti-tumor immunity.
a, Schematic diagrams of the depletion of CD8 T cells at early (red) or late (blue) time point during tumor response. b, T cell populations in peripheral blood after early or late CD8 T cell depletion. c, Tumor growth curves of mice depleted of CD8 T cells early (red) or later (blue) in tumor response as described in a. Data represented pooled biologically independent samples from two independent experiments (n = 5 for no depletion, n = 3 for early depletion, and n = 5 for late depletion) Data represented as mean +/− s.d.
Extended Data Fig. 5 |
Extended Data Fig. 5 |. CD8 T cell responses in Cd27−/−, Tnfrsf9−/−, and Cd27−/− Tnfrsf9−/− mice.
a, Schematic diagram showing generation of Tnfrsf9−/− mice. CRISPR/Cas9 and sgRNAs were used to target the first coding exon, exon II, resulting in a Tnfrsf9 null gene via indel. b, WT, Cd27−/−, and Tnfrsf9−/− mice were injected with 106 1969 cells, and spleens were stained for the presence of mGpd2 tetramer+ CD8 T cells on day 10. Data represent pooled biologically independent samples from five independent experiments (n = 6 for naive, n = 9 for WT, n = 8 for Cd27−/−, n = 5 for Tnfrsf9−/− mice). Data are represented as mean values +/− s.d. **P = 0.0023; ns = not significant. c, CD127, CD44, and CD62L geometric mean MFI of SPLENIC SIINFEKL-Kb-tetramer+ CD8 T cells on d10 of 1956-mOVA in WT, Cd27−/−, Tnfrsf9−/−, and Cd27−/−Tnfrsf9−/− mice. Data represent pooled biologically independent samples from four independent experiments (n = 12 for WT, n = 10 for Cd27−/−, n = 6 for Tnfrsf9−/− mice, and n = 8 for Cd27−/−Tnfrsf9−/− mice). Data are represented as mean values +/− s.d. **P = 0.0094, ***P = 0.0004, ****P = < 0.0001, ns = not significant. d, Individual tumor curves of WT (Cd27−/−) and Cd27−/− mice during primary and secondary implantation with 1956 progressor tumor. b,c: Brown–Forsythe and Welch ANOVA with Dunnett’s T3 multiple comparisons test.
Extended Data Fig. 6 |
Extended Data Fig. 6 |. cDC1s during homeostasis and tumor challenge in Cd40cKO and Cd70cKO mice.
a, Quantification of migratory cDC1 number in TDLNs of tumor-bearing Cd40WT (Xcr1+/+ Cd40fl/fl, Cd40cKO (Xcr1Cre/+ Cd40fl/fl), Cd70WT (Xcr1+/+ Cd70fl/fl), and Cd70cKO (Xcr1Cre/+ Cd70fl/fl) mice as depicted in Fig. 5c. Data represent pooled biologically independent samples from five independent experiments (n = 7-8 for all groups). Data are represented as mean values +/− s.d. **P = 0.0022; ns, not significant. b, Left, Representative flow plots of resident cDC1s (red boxes) and cDC2s (black boxes) in TDLNs of day 6 1956-mOVA-bearing Cd40WT (Xcr1+/+ Cd40cKO), Cd40cKO (Xcr1Cre/+ Cd40fl/fl), Cd70WT (Xcr1+/+ Cd70fl/fl), and Cd70cKO (Xcr1Cre/+ Cd70fl/fl) mice. Cells are pregated as B220 CD326MHC-II+ CD11chi. Numbers are percentages of cells in the indicated gates. Right, quantification of cDC1s as a percentage of resident cDCs. Data represent pooled biologically independent samples from five independent experiments (n = 8 for all groups). Data are represented as mean values +/− s.d. c, Quantification of cDC1s as a percentage of splenic (left), SDLN migratory (middle), and SDLN resident (right) cDCs in WT (Xcr1+/+ Cd40fl/fl) and Cd40cKO mice at homeostasis. Data represent pooled biologically independent samples from five independent experiments (n = 7 for all groups). Data are represented as mean values +/− s.d. ns, not significant. d, Day 6 and Day 14 tumor areas of WT (Xcr1+/+ Cd70fl/fl) and Cd70cKO mice injected with 106 1956-mOVA cells. Data represent pooled biologically independent samples from three independent experiments (n = 6-8 for WT and n = 10 Cd70cKO mice). ns, not significant. e, Mitotracker Deep Red FM (right) and Mitotracker Green FM (right) geometric mean MFI in TDLN migratory cDC2s of d6 1956-mOVA-bearing Cd40WT,Cd40cKO, Cd70WT, and Cd70cKO mice. Data represent pooled biologically independent samples from two independent experiments (n = 4 for all groups). Data are represented as mean values +/− s.d. ns, not significant. f, WT (Xcr1+/+ Cd40fl/fl) and Cd40cKO mice were injected with 106 1956-mOVA cells. On day 6, mice were injected with the fluorescent activated poly-caspase probe FAM-FLIVO, and then TDLNs were harvested after 1 h. Quantification of FLIVO + cells in migratory and resident cDC1s of WT and Cd40cKO mice. Data represent pooled biologically independent samples from four independent experiments (n = 7 for WT and n = 8 for Cd40cKO mice). Data are represented as mean values +/− s.d. *P = 0.0340, ns = not significant. g-h, Basal (g) and maximal (h) OCR from extracellular flux analysis of cDC1s from WT (black), Cd40−/− (green), and Ptgs2cKO (red) Flt3L-treated bone marrow cultures. Data represent mean values of four biologically independent experiments. Data are represented as mean values +/− s.d. *P < 0.05. i, Enrichment analysis of mitochondrial complex I biogenesis genes in cDC1 in the absence (red) or presence (blue) of CD40 stimulation. a-b, d-g: Brown–Forsythe and Welch ANOVA with Dunnett’s T3 multiple comparisons test. c: Mann–Whitney test.
Extended Data Fig. 7 |
Extended Data Fig. 7 |. Bcl-xL rescue of CD40 deficiency in cDC1.
a, Flt3L-treated BM cultures from Cd40−/− mice were transduced with Bcl-xL, and cDC1s were sorted on day 10 of culture. Representative FACS plots depicting the full gating strategy (top) and the post-sort analysis for Bcl-xL-GFP+ expressing cDC1s (middle)and untransduced Bcl-xL-GFP cDC1s (bottom) and. b, Flt3L-treated BM cultures from Cd40−/− mice were transduced with EV, and cDC1s were sorted on day 10 of culture. Representative FACS plots depicting the full gating strategy (top) and the post-sort analysis for EV-GFP+ expressing cDC1s (middle) and untransduced EV-GFP cDC1s (bottom).
Extended Data Fig. 8 |
Extended Data Fig. 8 |. Conditional loss of Bcl-xL impairs survival of migratory, but not resident, cDC1.
a, Representative histogram of Bcl-xL staining in cDC2 from mesenteric lymph nodes of WT and BclxLcKO mice injected i.p. with PBS (black) or agonistic CD40 antibody (red, blue). b, Representative histograms of CD40 and MHC-II surface expression in migratory cDC1 of TDLN from tumor-bearing WT (Xcr1+/+ Bclxfl/fl), Cd40cKO (Xcr1Cre/+ Cd40fl/fl), and BclxLcKO (Xcr1Cre/+ Bclxfl/fl) mice. c-d, Quantification of migratory cDC1 as a percentage (c) and number (d) from TDLNs of day 6 tumor-bearing BclxLWT, BclxLcKO, Cd40WT, Cd40cKO, and Ptgs2cKO (Xcr1Cre/+ Ptgs2fl/fl) mice. Data represent pooled biologically independent samples from two independent experiments (n = 4-5 for BclxLWT, n = 8 for BclxLcKO, n = 5 for Cd40WT, n = 4 for Cd40cKO, and n = 2 for Ptgs2cKO). Data are represented as mean values +/− s.d. *P = 0.0249, 0.0240; ***P = 0.0001; *P = 0.0257; ns, not significant. e, Representative flow plots of resident cDC1s (red boxes) and cDC2s (black boxes) in TDLNs of day 6 1956-mOVA-bearing BclxLWT, BclxLcKO, Cd40WT, Cd40cKO and Ptgs2cKO mice. Cells are pregated as B220 CD326MHC-II+ CD11chi. Numbers are percentages of cells in the indicated gates. Data represent pooled biologically independent samples from two independent experiments. f-g, Quantification of resident cDC1s in e as a percentage (f) and number (g) from TDLNs of day 6 tumor-bearing BclxLWT, BclxLcKO, Cd40WT, Cd40cKO, and Ptgs2cKO mice. Data represent pooled biologically independent samples from two independent experiments (n = 4-5 for BclxLWT, n = 8 for BclxLcKO, n = 5 for Cd40WT, n = 4 for Cd40cKO, and n = 2 for Ptgs2cKO). Data are represented as mean values +/− s.d. ns, not significant. c,d,f,g: Brown–Forsythe and Welch ANOVA with Dunnett’s T3 multiple comparisons test.
Fig. 1 |
Fig. 1 |. Transcriptional targets of CD40 signaling in cDC1s.
a, Representative flow histograms of CD40 expression in homeostatic XCR1+ cDC1 from Flt3L-treated BM cultures, spleens and SDLNs of WT (Cd40+/+, red) and Cd40−/− mice (gray). BM cells are pregated as B220 Siglec H, spleen cells as B220 F4/80, and SDLN cells as B220 CD326. In top and middle panels, black numbers indicate the percentage of cells in the indicated gates; in the bottom panel, red and gray numbers indicate geometric mean fluorescence intensity (MFI) for CD40 expression in cells from WT and Cd40−/− mice, respectively (representing three independent experiments, n = 3 mice). b, Log2 expression of genes with the highest fold increase (at least threefold) between SDLN cDC1s treated in the presence or absence of agonistic αCD40 mAb (results averaged from three independent experiments). c,d, Percentages (c) and number (d) of proliferated OT-I CD8 T cells cultured with migratory or resident cDCs sorted from tumor-draining lymph nodes (TDLNs) of B6 WT tumor-bearing mice in the presence (red) or absence (gray) of agonistic CD40 antibody for 72 h. Data represent replicates from two biologically independent experiments (n = 5 for migratory and n = 4 for resident cDCs). Data are represented as mean values ± standard deviation (s.d.). ****P < 0.0001; NS, not significant. c,d, Brown–Forsythe and Welch analysis of variance (ANOVA) with Dunnett’s T3 multiple comparisons test.
Fig. 2 |
Fig. 2 |. CD70 expression in cDC1s partially contributes to CD40-dependent responses to tumors.
a, Schematic diagram of the mouse Cd70 allele targeted simultaneously by two CRISPR gRNAs and two single-stranded (ss) oligomers to generate a Cd70 conditional knockout allele. Filled and open boxes denote coding and noncoding exons of Cd70, respectively. HA, homology arm. b, Representative flow plots depicting CD70 and CD40 expression in cDC1s from Flt3L-treated BM cultures of WT (Xcr1+/+ Cd70fl/fl, top) and Cd70cKO (Xcr1Cre/+ Cd70fl/fl, bottom) mice, untreated (left) or treated with agonistic CD40 antibody + poly(I:C) (right). c, Tumor growth curves of Cd40WT (Xcr1+/+ Cd40fl/fl, Cd40cKO (Xcr1Cre/+ Cd40fl/fl, green), Cd70WT (Xcr1+/+Cd70fl/fl, gray) and Cd70cKO (Xcr1Cre/+ Cd70fl/fl, orange) mice (left to right) injected subcutaneously with 2 × 10⁶ 1969 fibrosarcoma cells. d, Tumor growth curves of Cd40WT, Cd40cKO (green) Cd70WT (gray) and Cd70cKO (orange) mice (left to right) injected subcutaneously with 106 1956-mOVA cells. e,f, WT (Xcr1+/+Cd70fl/fl), Cd40cKO and Cd70cKO mice were injected with 106 1956-EV or 1956-mOVA cells, and spleens were stained for the presence of SIINFEKL-Kb tetramer+ CD8 T cells on day 10. e, Representative flow plots of percentages of tetramer+ CD8 T cells. f, Quantification of data in panel e depicting tetramer+ CD8+ T cells as a percentage of all CD8 T cells. Data represent pooled biologically independent samples from three independent experiments (n = 4 for WT 1956-EV, n = 8 for WT, n = 3 for Cd40cKO and n = 7 for Cd70cKO mice). Data are represented as mean values ± s.d. *P = 0.0101; **P = 0.0080. g, Top panel shows a schematic diagram of tumor implantation to assess anti-tumor memory. Bottom panel shows tumor growth curves of WT (Xcr1+/+Cd70fl/fl), Cd40cKO and Cd70cKO mice during the primary (1') and secondary implantation of 1956 progressor tumors. Data represent mean ± standard error of the mean (s.e.m.) of pooled biologically independent samples from three independent experiments (n = 11 for WT, n = 4 for Cd40cKO and n = 9 for Cd70cKO). D, day. f, Brown–Forsythe and Welch ANOVA with Dunnett’s T3 multiple comparisons test.
Fig. 3 |
Fig. 3 |. Costimulatory CD27 and 4-1BB signaling do not fully mediate CD40 help.
a, Tumor growth curves of WT (Cd27+/+Tnfrsf9+/+), Cd27−/−, and Tnfrsf9−/− mice (left to right) injected with 2 × 10⁶ 1969 fibrosarcoma cells. b, Representative flow plots depicting CD27 and 4-1BB surface expression of splenic CD8 T cells from WT (black), Cd27−/− (red), Tnfrsf9−/− (blue), and Cd27−/−Tnfrsf9−/− (pink) mice stimulated in vitro with αCD3 and αCD28. c, Tumor growth curves of WT, Cd27−/−, Tnfrsf9−/−, and Cd27−/−Tnfrsf9−/− mice (left to right) injected with 106 1956-mOVA cells. d,e, WT, Cd27−/− (red), Tnfrsf9−/− (blue) and Cd27−/−Tnfrsf9−/− (pink) mice were injected subcutaneously with 106 1956-EV or 1956-mOVA cells, and spleens were stained for the presence of SIINFEKL-Kb tetramer+ CD8 T cells on day 10. d, Representative flow plots of percentages of tetramer+ CD8 T cells. e, Quantification of data in panel d depicting tetramer+ cells as a percentage of all CD8 T cells. Data represent pooled biologically independent samples from five independent experiments (n = 5 for WT 1956-EV, n = 12 for WT, n = 10 for Cd27−/−, n = 6 for Tnfrsf9−/− and n = 8 for Cd27−/−Tnfrsf9−/− mice). Data are represented as mean values ± s.d. **P = 0.0026, WT versus Cd27−/− ***P = 0.0001; **P = 0.0046, Cd27−/−Tnfrsf9 versus Tnfrsf9−/; NS, not significant. f, Top panel shows a schematic diagram of tumor implantation to assess anti-tumor memory. Bottom panels shows tumor growth curves of WT (Cd27+/+) and Cd27−/− (red) mice during the primary and secondary implantation of 1956 progressor tumors. Data represent mean ± s.e.m. of pooled biologically independent samples from three independent experiments (n = 10 for WT and n = 10 for Cd27−/− mice). D, day. e, Brown–Forsythe and Welch ANOVA with Dunnett’s T3 multiple comparisons test.
Fig. 4 |
Fig. 4 |. Ptgs2 signaling in cDC1s contributes to CD8+ T cell expansion, but not tumor rejection.
a, Tumor growth curves of WT Xcr1+/+ Ptgs2fl/fl, top) and Ptgs2cKO (Xcr1Cre/+ Ptgs2fl/fl, bottom, red) injected with 106 1956-mOVA cells. b, WT and Ptgs2cKO mice were injected with 106 1956-EV or 1956-mOVA cells, and spleens were stained for the presence of SIINFEKL-Kb tetramer+ CD8 T cells on day 10. Left panel shows representative flow plots of percentages of tetramer+ CD8 T cells. Right panel shows quantification of tetramer+ CD8 T cells as a percentage of all CD8 T cells. Data represent pooled biologically independent samples from three independent experiments (n = 5 for WT 1956-EV, n = 12 for WT, n = 6 for Ptgs2cKO (red) mice). Data are represented as mean values ± s.d. *P = 0.0232. c, Tumor growth curves of WT and Ptgs2cKO mice during the primary and secondary implantation of 1956 progressor tumors. Data represent mean ± s.e.m. of pooled biologically independent samples from two independent experiments (left) (n = 5 for WT, n = 5 for Ptgs2cKO (red) mice) or individual tumor growth curves (right). d, Proliferation of CTV-labeled OT-I CD8 T cells cultured for 72 h in vitro with migratory or resident cDCs from TDLNs of WT (black), Cd40cKO (Xcr1Cre/+ Cd40fl/fl, green), Cd70cKO (Xcr1Cre/+ Cd70fl/fl, orange) or Ptgs2cKO (red) mice that were injected with 106 1956-mOVA 14 days previously. Data represent pooled samples from two biologically independent experiments (n = 4–5 for migratory and n = 2–5 for resident cDCs). Data are represented as mean values ± s.d. b, Unpaired, two-tailed Mann–Whitney test. d, Brown–Forsythe and Welch ANOVA with Dunnett’s T3 multiple comparisons test.
Fig. 5 |
Fig. 5 |. CD40 signaling in cDC1s mediates cDC1 survival during tumor challenge.
a, Day 6 and day 14 tumor areas of WT (Xcr1+/+ Cd40fl/fl) and Cd40cKO (Xcr1Cre/+ Cd40fl/fl) mice injected with 106 1956-mOVA cells. Data represent pooled biologically independent samples from three experiments (n = 8 for WT and n = 8 for Cd40cKO). b, Experimental setup for panels c–f. c, Representative flow plots showing migratory cDC1s (red) and cDC2s (black) from TDLNs of tumor-bearing Cd40WT (Xcr1+/+ Cd40fl/fl), Cd40cKO, Cd70WT (Xcr1+/+ Cd70fl/fl) and Cd70cKO (Xcr1Cre/+ Cd70fl/fl) mice (left to right). Cells are pregated as B220 CD326MHC-II+ CD11cint. Numbers are percentages of cells in indicated gates. d, Quantification of panel c. Data represent pooled biologically independent samples from five experiments (n = 8 for all groups). Data represented as mean ± s.d. ****P < 0.0001. e, Top panel representative histograms of migratory cDC1s from TDLNs of Cd40WT (black), Cd40cKO (green), Cd70WT (gray) and Cd70cKO (orange) tumor-bearing mice stained with MitoTracker Deep Red FM. Numbers are the geometric MFI of MitoTracker Deep Red for samples in the similar color. Bottom panel shows a graph of the data above. Data represent pooled biologically independent samples from four experiments (n = 6 for Cd40WT, n = 5 for Cd40cKO, n = 6 for Cd70WT and n = 7 Cd70cKO). Data represented as mean ± s.d. *P = 0.0399. f, Top panel shows representative histograms of migratory cDC1s from TDLNs of Cd40WT (black), Cd40cKO (green), Cd70WT (gray) and Cd70cKO (orange) tumor-bearing mice stained with MitoTracker Green. Numbers are the geometric MFI of MitoTracker Green for samples in the similar color. Bottom panel shows a graph of the data above. Data represent pooled biologically independent samples from four experiments (n = 6 for Cd40WT, n = 5 for Cd40cKO, n = 6 for Cd70WT and n = 7 for Cd70cKO). Data represented as mean ± s.d. g, Representative flow plots showing activated caspase staining (FLIVO) and CD40 expression in migratory cDC1s (top) and cDC2s (bottom) of WT (Xcr1+/+ Cd40fl/fl) (left) and Cd40cKO (right) mice. Numbers are the percentages of cells in the indicated gates. Data represent pooled biologically independent samples from four experiments (n = 8 for WT and n = 8 for Cd40cKO). a,d,e,f, Brown–Forsythe and Welch ANOVA with Dunnett’s T3 multiple comparisons test.
Fig. 6 |
Fig. 6 |. CD40 signaling mediates cDC1 survival during antigen presentation.
a, cDC1s were sorted from WT (Cd40+/+ CD45.2, black) or Cd40−/− (CD45.2+, green) Flt3L-treated BM and cultured with CD8 T cells in the presence or absence of agonistic αCD40. Competitive survival was analyzed 48 h later. Numbers are percentages of cells in the indicated gates. b, Schematic diagram for experimental design used in panels c–f. Representative flow plot showing how cells can be distinguished by MHC-I and CD45.2 expression (cDC1s, MHC-I+ CD45.2+). Created with Biorender.com. c, Representative flow plots showing WT (top) and Cd40−/− (bottom) cDC1s. After 24 h culture as described in b, cells were incubated with FLICA and propidium iodide (PI), and cDC1 were analyzed by flow cytometry one hour later for PI and FLICA staining. Numbers are the percentages of cells in the indicated gates. Data represent two biologically independent experiments. d, Quantification of data shown in c at different cDC1:OT-I ratios (WT cDC1, black; Cd40−/− cDC1, green). Top, quantification of active caspase activity as a percent of MHC-I+ cDC1s. **P = 0.0016, ***P = 0.0001. Bottom, quantification of late apoptotic cells (FLICA+ Propidium iodide+) as a percent of MHC-I+ cDC1s. ****P < 0.0001. Data represent pooled independent samples from two biologically independent experiments (n = 5 for all groups). Data are represented as mean values ± s.d. e,f, Left graph shows representative two-color histograms of MitoTracker Deep Red FM (e) or MitoTracker Green FM (f) staining in WT (black) or Cd40−/− (green) cDC1s after 24 h culture described in panel b. Numbers are the geometric MFI of MitoTracker. Right graph shows data presented as individual samples. Data represent pooled independent samples from two biologically independent experiments (n = 9–10 for all groups). Data are represented as mean values ± s.d. ***P = 0.008. g,h, Extracellular flux analysis of cDC1s from WT (black), Cd40−/− (green) and Ptgs2cKO (red) Flt3L-treated BM. OCRs (g) or ECARs (h) before and after addition of pharmacological inhibitors are shown. Mean values of technical replicates ± s.e.m. of a representative experiment are shown. Plot representative of four biologically independent experiments. *P < 0.05; **P = 0.0020 and 0.0026; ***P = 0.0004. d–h, Two-way ANOVA with Šídák’s multiple comparisons test.
Fig. 7 |
Fig. 7 |. CD40 help induces Bcl-xL for cDC1 survival for antigen presentation.
a,b, Flt3L-treated BM from Cd40−/− mice was transduced to express EV (empty vector, green) or Bcl-xL (blue) retrovirus (RV). On day 10, transduced (GFP+) and untransduced (GFP) cDC1s were sorted and co-cultured at a 50:50 ratio for 24 or 48 h. a, Representative flow plots comparing survival of Cd40−/− cDC1s untransduced (GFP) and transduced (GFP+) with EV (top) or Bcl-xL (bottom) at 0 h, 24 h and 48 h. Numbers are the percentages of cells in the indicated gates. b, Quantification of data in panel a. Percentage of EV-expressing (green, top) or Bcl-xL-expressing (blue, bottom) cDC1s versus uninfected cDC1s (gray bars). Data represent pooled independent samples from two biologically independent experiments (n = 2 for 0 h and 48 h, n = 6 for EV at 24 h and n = 5 for Bcl-xL at 24 h). Data are represented as mean values ± s.d. c,d, Flt3L-treated BM from Cd40−/− mice was retrovirally transduced to express EV (green) or Bcl-xL (blue). On day 10, transduced (GFP+) cDC1s were sorted and cultured with OVA-loaded splenocytes and OT-I CD8 T cells for antigen processing and presentation. After 24 h, cells were incubated with FLICA and 7-AAD for 1 h before analysis by flow cytometry. c, Representative flow plots showing untransduced Cd40−/− cDC1s (top) and Cd40−/− cDC1s retrovirally expressing EV (middle) or Bcl-xL (bottom). d, Quantification of data shown in panel c comparing caspase activity and apoptosis among untransduced Cd40−/− cDC1s in the absence (clear) and presence (black) of antigen and Cd40−/− cDC1s expressing EV (green) or Bcl-xL (blue). Top, early apoptotic cells (FLICA+ 7-AAD) as a percentage of MHC-I+ cDC1s. **P = 0.0011. Middle, late apoptotic cells (FLICA+ 7-AAD+) as a percentage of MHC-I+ cDC1s. **P = 0.0023. Bottom, quantification of cells with activated caspases as a percentage of MHC-I+ cDC1s, ***P = 0.0005. Data represent pooled independent samples from two biologically independent experiments (n = 4 for RV-OVA, n = 4-5 for RV OVA+, n = 6 for EV OVA+, and n = 6 for Bcl-xL OVA+ groups). Data are represented as mean values ± s.d. d, Brown–Forsythe and Welch ANOVA with Dunnett’s T3 multiple comparisons test.
Fig. 8 |
Fig. 8 |. Loss of Bcl-xL in cDC1s reduces cDC1 and CD8+ T cell expansion during tumor challenge.
a, Representative histogram of Bcl-xL staining in cDC1 from mesenteric lymph nodes of WT and BclxLcKO mice injected intraperitoneally (i.p.) with phosphate-buffered saline (PBS) (black) or agonistic CD40 antibody (red, blue). b, Tumor growth curves of WT (Xcr1+/+ Bclxfl/fl), BclxLcKO (Xcr1Cre/+ Bclxfl/fl) and Cd40cKO (Xcr1Cre/+ Cd40fl/fl) mice (left to right) injected subcutaneously with 106 1956-mOVA cells. c, Representative flow plots showing migratory cDC1s (red boxes) and cDC2s (black boxes) from TDLNs of tumor-bearing BclxLWT, BclxLcKO, Cd40WT (Xcr1+/+ Cd40fl/fl) and Cd40cKO mice (left to right). Cells are pregated as B220 CD326MHC-II+ CD11cint. Numbers are percentages of cells in the indicated gates. d, Quantification of data in panel c. Data represent pooled biologically independent samples from two independent experiments. (n = 5 for BclxLWT, n = 8 for BclxLcKO n = 5 for Cd40WT and n = 4 for Cd40cKO). Data are represented as mean values ± s.d. *P < 0.05. e,f, WT (Xcr1+/+Bclxfl/fl), BclxLcKO and Cd40cKO mice were injected with 106 1956-EV or 1956-mOVA cells, and spleens were stained for the presence of SIINFEKL-Kb tetramer+ CD8 T cells on day 10. e, Representative flow plots of percentages of tetramer+ CD8 T cells. f, Quantification of data in panel e depicting tetramer+ CD8 + T cells as a percentage of all CD8 T cells. Data represent pooled biologically independent samples from two independent experiments (n = 5 for WT 1956-EV, n = 5 for WT, n = 5 for BclxLcKO and n = 4 for Cd40cKO mice). Data are represented as mean values ± s.d. *P < 0.05. d,f, Brown–Forsythe and Welch ANOVA with Dunnett’s T3 multiple comparisons test.

Comment in

References

    1. Cantor H & Boyse EA Functional subclasses of T lymphocytes bearing different Ly antigens. II. Cooperation between subclasses of Ly+ cells in the generation of killer activity. J. Exp. Med 141, 1390–1399 (1975). - PMC - PubMed
    1. Clark EA & Ledbetter JA Activation of human B cells mediated through two distinct cell surface differentiation antigens, Bp35 and Bp50. Proc. Natl Acad. Sci. USA 83, 4494–4498 (1986). - PMC - PubMed
    1. Armitage RJ et al. Molecular and biological characterization of a murine ligand for CD40. Nature 357, 80–82 (1992). - PubMed
    1. Spriggs MK et al. Recombinant human CD40 ligand stimulates B cell proliferation and immunoglobulin E secretion. J. Exp. Med 176, 1543–1550 (1992). - PMC - PubMed
    1. Hollenbaugh D et al. The human T cell antigen gp39, a member of the TNF gene family, is a ligand for the CD40 receptor: expression of a soluble form of gp39 with B cell co-stimulatory activity. EMBO J. 11, 4313–4321 (1992). - PMC - PubMed

Publication types