

Retinal Shape-Based Classification of Retinal Detachment and Posterior Vitreous Detachment Eyes
- PMID: 36271185
- PMCID: PMC9834476
- DOI: 10.1007/s40123-022-00597-6
Retinal Shape-Based Classification of Retinal Detachment and Posterior Vitreous Detachment Eyes
Abstract
Introduction: Retinal detachment is a sight-threatening emergency, with more than half of those affected suffering permanent visual impairment. A diagnostic test to identify eyes at risk before vision is threatened would enable exploration of prophylactic treatment. This report presents the use of irregularities in retinal shape, quantified from optical coherence tomography (OCT) images, as a biomarker for retinal detachment.
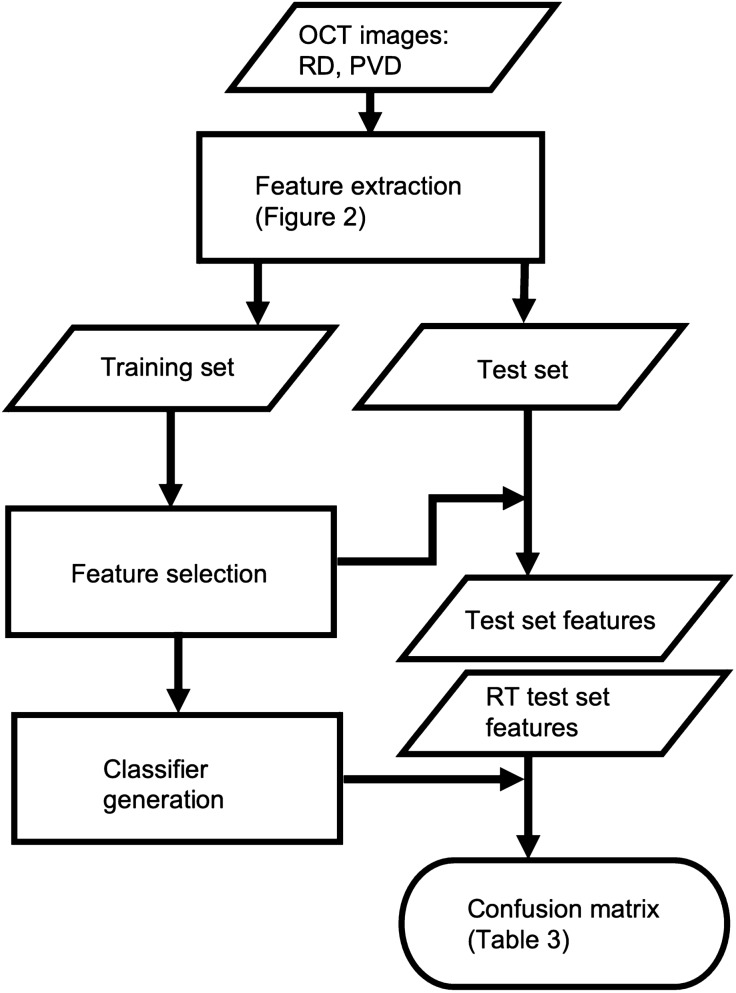
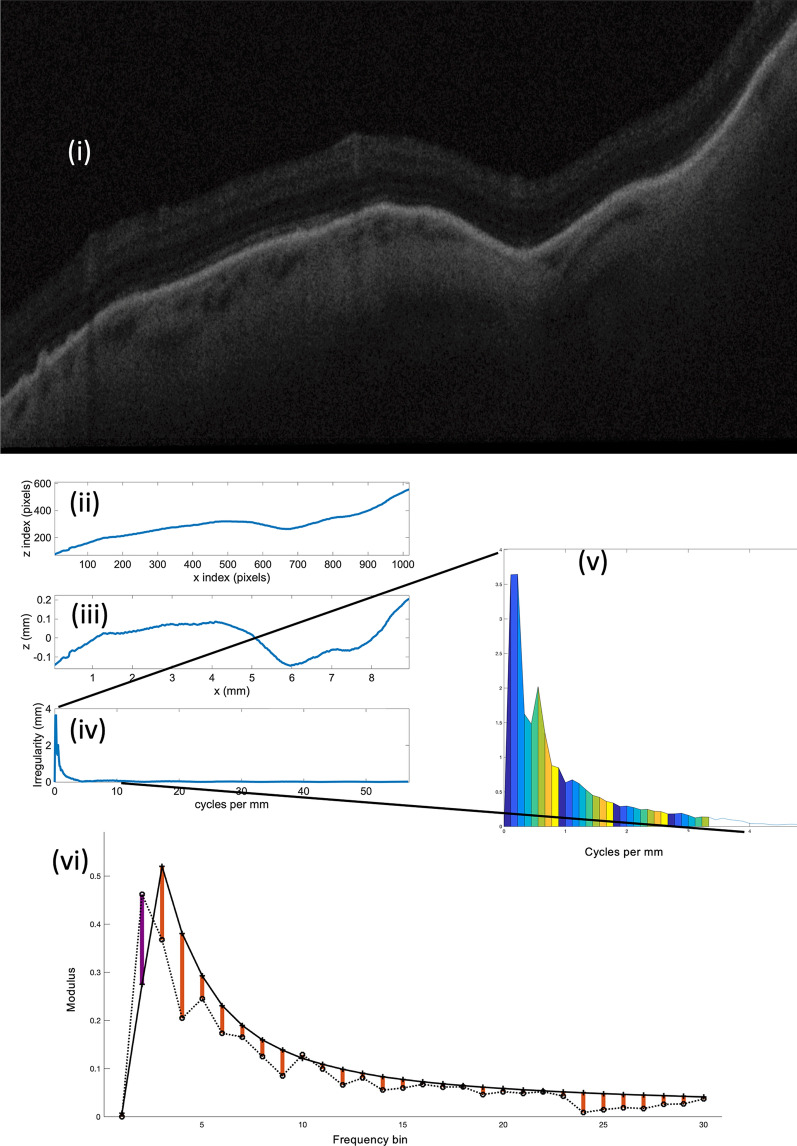
Methods: OCT images were taken from posterior and mid-peripheral retina of 264 individuals [97 after a posterior vitreous detachment (PVD), 99 after vitrectomy for retinal detachment and 68 after laser for a retinal tear]. Diagnoses were taken from history, examination and OCT. Retinal irregularity was quantified in the frequency domain, and the distribution of irregularity across the regions of the eye was explored to identify features exhibiting the greatest difference between retinal detachment and PVD eyes. Two of these features plus axial length were used to train a quadratic discriminant analysis classifier. Classifier performance was assessed by its sensitivity and specificity in identifying retinal detachment eyes and visualised with a receiver operating characteristic (ROC) curve.
Results: Validation set specificity was 84% (44/52 PVD eyes correctly labelled) and sensitivity 35% (23/64 retinal detachment eyes identified, p = 0.02). Area under the ROC curve was 0.75 (95% confidence intervals 0.58-0.85). Retinal detachment eyes were significantly more irregular than PVD eyes in the superior retina (0.70 mm versus 0.49 mm, p < 0.05) and supero-temporal retina (1.12 mm versus 0.80 mm, p < 0.05). Lower sensitivity (16/68, 24%) was seen for eyes with a retinal tear without detachment, that were intermediate in size between retinal detachment and PVD eyes. Axial length on its own was a poor classifier. Neither irregularity nor classification were affected by surgery for retinal detachment or the development of PVD.
Conclusions: The classifier identified 1/3 of retinal detachment eyes in this sample. In future work, these features can be evaluated as a test for retinal detachment prior to PVD.
Keywords: Fourier analysis; Machine learning; Optical coherence tomography; Retinal detachment; Vitreous detachment.
© 2022. The Author(s).
Figures


Similar articles
-
Swept-Source OCT Mid-Peripheral Retinal Irregularity in Retinal Detachment and Posterior Vitreous Detachment Eyes.Bioengineering (Basel). 2023 Mar 19;10(3):377. doi: 10.3390/bioengineering10030377. Bioengineering (Basel). 2023. PMID: 36978768 Free PMC article.
-
Spectral domain optical coherence tomography and B-scan ultrasonography in the evaluation of retinal tears in acute, incomplete posterior vitreous detachment.BMC Ophthalmol. 2016 May 23;16:60. doi: 10.1186/s12886-016-0242-0. BMC Ophthalmol. 2016. PMID: 27215604 Free PMC article.
-
Standard 6-mm Compared with Widefield 16.5-mm OCT for Staging of Posterior Vitreous Detachment.Ophthalmol Retina. 2020 Nov;4(11):1093-1102. doi: 10.1016/j.oret.2020.05.006. Epub 2020 May 19. Ophthalmol Retina. 2020. PMID: 32442535
-
[Noninvasive analysis of retinal microstructure and function: challenges and a promising future].Nippon Ganka Gakkai Zasshi. 2013 Mar;117(3):212-44; discussion 245. Nippon Ganka Gakkai Zasshi. 2013. PMID: 23631255 Review. Japanese.
-
Scleral buckling in the management of rhegmatogenous retinal detachment: patient selection and perspectives.Clin Ophthalmol. 2018 Aug 30;12:1605-1615. doi: 10.2147/OPTH.S153717. eCollection 2018. Clin Ophthalmol. 2018. PMID: 30214145 Free PMC article. Review.
Cited by
-
Swept-Source OCT Mid-Peripheral Retinal Irregularity in Retinal Detachment and Posterior Vitreous Detachment Eyes.Bioengineering (Basel). 2023 Mar 19;10(3):377. doi: 10.3390/bioengineering10030377. Bioengineering (Basel). 2023. PMID: 36978768 Free PMC article.
-
Artificial intelligence-assisted management of retinal detachment from ultra-widefield fundus images based on weakly-supervised approach.Front Med (Lausanne). 2024 Feb 6;11:1326004. doi: 10.3389/fmed.2024.1326004. eCollection 2024. Front Med (Lausanne). 2024. PMID: 38379556 Free PMC article.
References
-
- Mitry D, Charteris DG, Yorston D, Siddiqui MAR, Campbell H, Murphy A-L, et al. The Epidemiology and Socioeconomic Associations of Retinal Detachment in Scotland: A Two-Year Prospective Population-Based Study. Invest Ophthalmol Vis Sci. 2010;51(10):4963–8. Available from: http://dx.doi.org/10.1167/iovs.10-5400 - PubMed
-
- Howie AR, Darian-Smith E, Allen PL, Vote BJ. Whole population incidences of patients presenting with rhegmatogenous retinal detachments within Tasmania, Australia. Clin Experiment Ophthalmol. 2016;44(2):144–6. Available from: http://dx.doi.org/10.1111/ceo.12640 - PubMed
-
- Polkinghorne PJ, Craig JP. Northern New Zealand Rhegmatogenous Retinal Detachment Study: epidemiology and risk factors. Clin Experiment Ophthalmol. 2004 Jan 1;32(2):159–63. Available from: 10.1111/j.1442-9071.2004.00003.x - PubMed
-
- Shunmugam M, Shah AN, Hysi PG, Williamson TH. The Pattern and Distribution of Retinal Breaks in Eyes With Rhegmatogenous Retinal Detachment. Am J Ophthalmol. 2014 Jan 1;157(1):221–6. Available from: 10.1016/j.ajo.2013.09.011 - PubMed
LinkOut - more resources
Full Text Sources
