. 2022 Oct 21;12(1):17636.
doi: 10.1038/s41598-022-21514-8.

Mangroves provide blue carbon ecological value at a low freshwater cost

Affiliations

Mangroves provide blue carbon ecological value at a low freshwater cost

Ken W Krauss et al. Sci Rep. .

Abstract

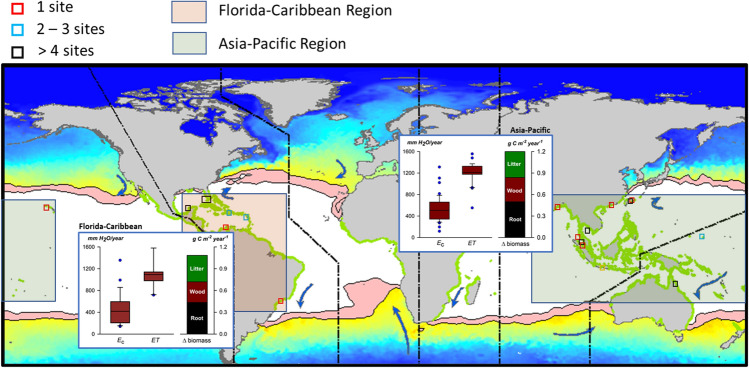
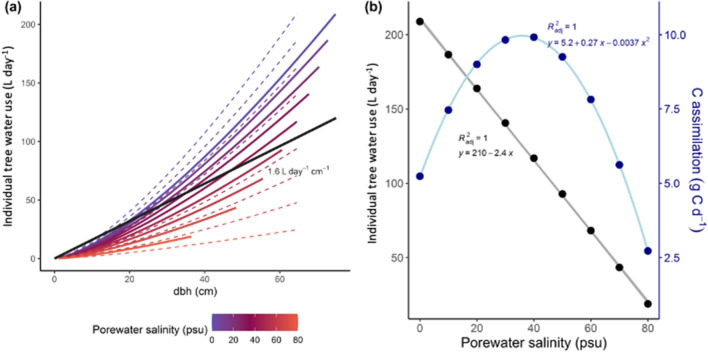
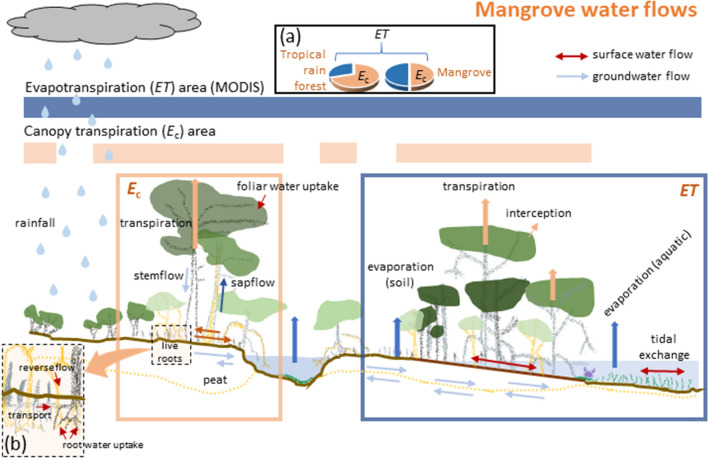
"Blue carbon" wetland vegetation has a limited freshwater requirement. One type, mangroves, utilizes less freshwater during transpiration than adjacent terrestrial ecoregions, equating to only 43% (average) to 57% (potential) of evapotranspiration ([Formula: see text]). Here, we demonstrate that comparative consumptive water use by mangrove vegetation is as much as 2905 kL H2O ha-1 year-1 less than adjacent ecoregions with [Formula: see text]-to-[Formula: see text] ratios of 47-70%. Lower porewater salinity would, however, increase mangrove [Formula: see text]-to-[Formula: see text] ratios by affecting leaf-, tree-, and stand-level eco-physiological controls on transpiration. Restricted water use is also additive to other ecosystem services provided by mangroves, such as high carbon sequestration, coastal protection and support of biodiversity within estuarine and marine environments. Low freshwater demand enables mangroves to sustain ecological values of connected estuarine ecosystems with future reductions in freshwater while not competing with the freshwater needs of humans. Conservative water use may also be a characteristic of other emergent blue carbon wetlands.


Conflict of interest statement

The authors declare no competing interests.

Figures

Figure 1
Figure 1
Leaf-intrinsic water use efficiency ( WUEint ) and individual tree water use for mangroves versus terrestrial woody vegetation. (a) WUEint for a mix of seedlings, saplings, and trees of upland species from arid, semi-arid, dry semi-arid, and humid environments versus mangrove, depicting median (center line and values), upper and lower quartiles (box limits), 1.5 × interquartile ranges (whiskers), and outliers (points) as box-and-whisker plots, and sample sizes depicted within parentheses. (b) Individual tree water use (median) from sap flow studies conducted on mangrove trees relative to diameter at breast height (dbh), with comparison to upland trees (from ref.).
Figure 2
Figure 2
Location of 71 mangrove study sites from the Florida-Caribbean and Indo-Pacific regions from which net primary productivity (NPP, kg C m-2 year−1) data were used to determine canopy transpiration (Ec). Polygons (pink) over the oceans represent 20 °C summer and winter isotherms influencing mangrove distributions (updated from Duke et al. 1998, Glob. Ecol. Biogeogr. Letts., v. 7, p. 27–47). Insets represent comparative average Ec, ET, and NPP values for litter, wood, and roots assuming a continuous mangrove coverage versus ET at a scale of 1 km2 for each of the two regions. Box plot depictions are the same as in Fig. 1. Base image created using ArcMAP 10 (Esri, Inc., Redlands, California, USA), https://desktop.arcgis.com/en/arcmap/ .
Figure 3
Figure 3
BETTINA model simulations applied to tree size and salinity vs. water use. (a) Individual tree water use from BETTINA modelling studies relative to dbh for different salinities within mangroves. Each solid line represents one tree over the time of simulation with trees adapting their allometry to variation in soil salinity (from blue for 0 psu to red for 80 psu). For comparison, dashed lines mark the water uptake at different salinities with no allometric adaptation (average tree allometry as growing at 40 psu); solid black line represents empirical individual tree water use estimated for mangroves in this study. (b) Simulated individual tree water use of each mangrove tree at an age of 200 years.
Figure 4
Figure 4
Water flows in mangrove forests associated with either evapotranspiration (ET) or canopy transpiration (Ec), and how areas from MODIS-derived ET data and Ec data would relate for mangroves, as well as generally from the literature for other ecosystems. (a) Inset represents a comparison of Ec-to-ET ratio for mangroves versus tropical rain forests, where most of the world’s mangroves associate. (b) Inset represents known water fluxes in mangrove root zones that contribute to Ec, and ultimately to ET.

References

    1. Vörösmatry CJ, et al. Global threats to human water security and river biodiversity. Nature. 2010;467:555–561. doi: 10.1038/nature09440. - DOI - PubMed
    1. Bhaduri A, et al. Achieving sustainable development goals from a water perspective. Front. Environ. Sci. 2016;4:64. doi: 10.3389/fenvs.2016.00064. - DOI
    1. Dynesius M, Nilsson C. Fragmentation and flow regulation of river systems in the northern third of the world. Science. 1994;266:753–762. doi: 10.1126/science.266.5186.753. - DOI - PubMed
    1. Mcleod E, et al. A blueprint for blue carbon: Toward an improved understanding of the role of vegetated coastal habitats in sequestering CO2. Front. Ecol. Environ. 2011;9:552–560. doi: 10.1890/110004. - DOI
    1. Lovelock CE, Duarte CM. Dimensions of blue carbon and emerging perspectives. Biol. Lett. 2019;15:20180781. doi: 10.1098/rsbl.2018.0781. - DOI - PMC - PubMed

Publication types