

Disease stages and therapeutic hypotheses in two decades of neurodegenerative disease clinical trials
- PMID: 36271285
- PMCID: PMC9587287
- DOI: 10.1038/s41598-022-21820-1
Disease stages and therapeutic hypotheses in two decades of neurodegenerative disease clinical trials
Abstract
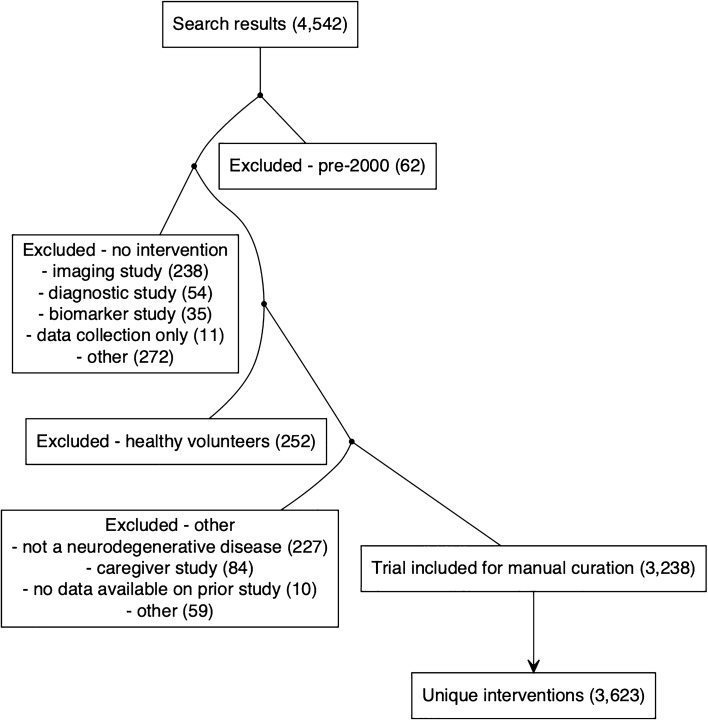
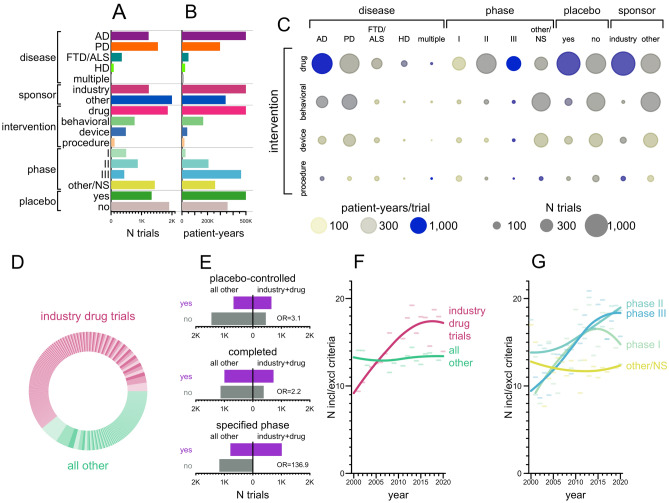
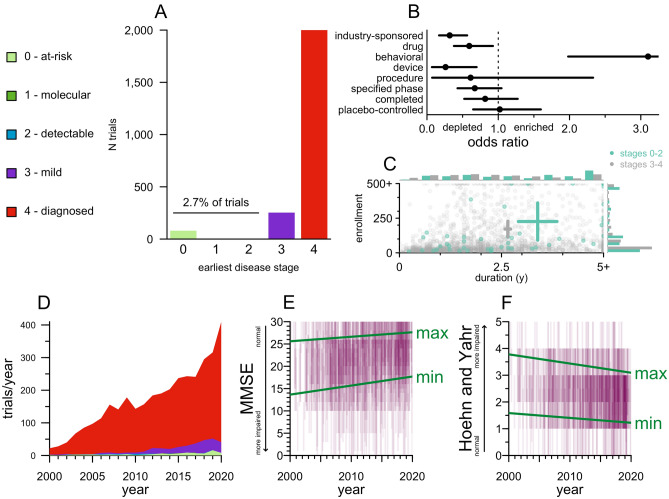
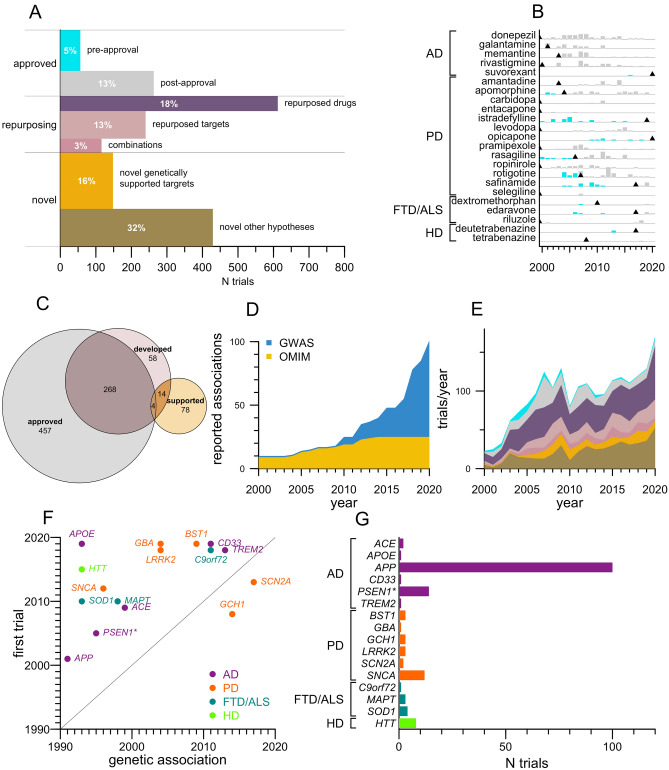
Neurodegenerative disease is increasingly prevalent and remains without disease-modifying therapies. Engaging the right target, at the right disease stage, could be an important determinant of success. We annotated targets and eligibility criteria for 3238 neurodegenerative disease trials registered at ClinicalTrials.gov from 2000 to 2020. Trials became more selective as the mean number of inclusion and exclusion criteria increased and eligible score ranges shrank. Despite a shift towards less impaired participants, only 2.7% of trials included pre-symptomatic individuals; these were depleted for drug trials and enriched for behavioral interventions. Sixteen novel, genetically supported therapeutic hypotheses tested in drug trials represent a small, non-increasing fraction of trials, and the mean lag from genetic association to first trial was 13 years. Though often linked to disease initiation, not progression, these targets were tested mostly at symptomatic disease stages. The potential for disease modification through early intervention against root molecular causes of disease remains largely unexplored.
© 2022. The Author(s).
Conflict of interest statement
MAM reports no disclosures. SMV has received speaking fees from Ultragenyx, Illumina, and Biogen, consulting fees from Invitae, and research support in the form of unrestricted charitable contributions from Ionis, Gate, and Charles River. EVM has received consulting fees from Deerfield and research support in the form of unrestricted charitable contributions from Ionis, Gate, and Charles River.
Figures
Similar articles
-
Perspectives on molecular targeted therapies and clinical trials for neurodegenerative diseases.J Neurol Neurosurg Psychiatry. 2012 Mar;83(3):329-35. doi: 10.1136/jnnp-2011-301307. J Neurol Neurosurg Psychiatry. 2012. PMID: 22323772 Review.
-
Short non-coding RNA biology and neurodegenerative disorders: novel disease targets and therapeutics.Hum Mol Genet. 2009 Apr 15;18(R1):R27-39. doi: 10.1093/hmg/ddp070. Hum Mol Genet. 2009. PMID: 19297399 Free PMC article. Review.
-
Clinical trials of disease-modifying therapies for neurodegenerative diseases: the challenges and the future.Nat Med. 2010 Nov;16(11):1223-6. doi: 10.1038/nm.2220. Epub 2010 Sep 21. Nat Med. 2010. PMID: 21052078
-
Gene therapy for neurodegenerative diseases.Trends Mol Med. 2015 Aug;21(8):504-12. doi: 10.1016/j.molmed.2015.06.001. Epub 2015 Jun 26. Trends Mol Med. 2015. PMID: 26122838 Review.
-
Parkinson's Disease Drug Therapies in the Clinical Trial Pipeline: 2022 Update.J Parkinsons Dis. 2022;12(4):1073-1082. doi: 10.3233/JPD-229002. J Parkinsons Dis. 2022. PMID: 35527571 Free PMC article. Review.
Cited by
-
Beyond the usual suspects: multi-factorial computational models in the search for neurodegenerative disease mechanisms.Transl Psychiatry. 2024 Sep 23;14(1):386. doi: 10.1038/s41398-024-03073-w. Transl Psychiatry. 2024. PMID: 39313512 Free PMC article. Review.
-
Refining the impact of genetic evidence on clinical success.Nature. 2024 May;629(8012):624-629. doi: 10.1038/s41586-024-07316-0. Epub 2024 Apr 17. Nature. 2024. PMID: 38632401 Free PMC article.
-
Search for a genetic cause of variably protease-sensitive prionopathy.PLoS Pathog. 2025 Aug 1;21(8):e1013343. doi: 10.1371/journal.ppat.1013343. eCollection 2025 Aug. PLoS Pathog. 2025. PMID: 40749074 Free PMC article.
-
A single-cell map of antisense oligonucleotide activity in the brain.Nucleic Acids Res. 2023 Aug 11;51(14):7109-7124. doi: 10.1093/nar/gkad371. Nucleic Acids Res. 2023. PMID: 37188501 Free PMC article.
-
Understanding Brain Diseases: From Receptor Dysregulation to Neurodegeneration, Neuroinflammation and Memory Impairment.Curr Neuropharmacol. 2023;21(2):162-163. doi: 10.2174/1570159X2102221212143233. Curr Neuropharmacol. 2023. PMID: 36859816 Free PMC article. No abstract available.
References
-
- Thomas, D. et al. Clinical Development Success Rates and Contributing Factors 2011–2020. 34 https://go.bio.org/rs/490-EHZ-999/images/ClinicalDevelopmentSuccessRates... (2021).
Publication types
MeSH terms
Grants and funding
LinkOut - more resources
Full Text Sources
Medical
