. 2022 Oct 21;14(1):158.
doi: 10.1186/s13195-022-01096-3.

Gossypetin ameliorates 5xFAD spatial learning and memory through enhanced phagocytosis against Aβ

Affiliations

Gossypetin ameliorates 5xFAD spatial learning and memory through enhanced phagocytosis against Aβ

Kyung Won Jo et al. Alzheimers Res Ther. .

Abstract

Background: Microglia are the resident immune cells found in our brain. They have a critical role in brain maintenance. Microglia constantly scavenge various waste materials in the brain including damaged or apoptotic neurons and Aβ. Through phagocytosis of Aβ, microglia prevent the accumulation of Aβ plaque in the brain. However, in Alzheimer's disease (AD) patients, chronic exposure to Aβ makes microglia to become exhausted, which reduces their phagocytic activity against Aβ. Since microglia play an important role in Aβ clearance, enhancing microglial phagocytic activity against Aβ is a promising target for AD treatment. Therefore, there is a great need for therapeutic candidate that enhances microglial Aβ clearance while inhibiting microglia's pathogenic properties.

Methods: In vivo studies were conducted with 5xFAD AD model mice by treating gossypetin for 13 weeks through intragastric administration. Their spatial learning and memory were evaluated through behavior tests such as Y-maze and Morris Water Maze test. Hippocampus and cortex were acquired from the sacrificed mice, and they were used for histological and biochemical analysis. Also, mouse tissues were dissociated into single cells for single-cell RNA sequencing (scRNA-seq) analysis. Transcriptome of microglial population was analyzed. Mouse primary microglia and BV2 mouse microglial cell line were cultured and treated with fluorescent recombinant Aβ to evaluate whether their phagocytic activity is affected by gossypetin.

Results: Gossypetin treatment improved the spatial learning and memory of 5xFAD by decreasing Aβ deposition in the hippocampus and cortex of 5xFAD. Gossypetin induced transcriptomic modulations in various microglial subpopulations, including disease-associated microglia. Gossypetin enhanced phagocytic activity of microglia while decreasing their gliosis. Gossypetin also increased MHC II+ microglial population.

Conclusions: Gossypetin showed protective effects against AD by enhancing microglial Aβ phagocytosis. Gossypetin appears to be a novel promising therapeutic candidate against AD.

Keywords: Alzheimer’s disease; Beta-amyloid (Aβ); Disease-associated microglia; Gossypetin; Phagocytosis; Single-cell RNA sequencing.


Conflict of interest statement

The authors declare competing financial interests; D.L. is employed by Novmetapharma.

Figures
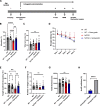
Fig. 1
Fig. 1
Gossypetin ameliorates spatial learning and memory of 5xFAD mice. A Timeline of gossypetin administration for 5xFAD mice (n = 17 ~ 21 per group). B, C 5xFAD mice were tested with Y-maze alteration test measuring percentage of alteration (B) and number of total arm entry (C). DG 5xFAD mice were trained for 5 days for Morris Water Maze test, and escape latency was recorded each day of training. Probe test was conducted on the 6th day (D). In probe test, percentage of target (platform) quadrant occupancy (E), number of target crossing (F), and total traveled distance were recorded (G). H Bar graph represents AChE activity inhibition percentage of gossypetin (100μM) with donepezil (1μM) as positive control. The error bars represent the mean ± SD (B-G) or mean ± SEM (H), **** p < 0.0001, **p < 0.01, *p < 0.05, ns = not significant, two-way ANOVA followed by Tukey’s multiple comparisons test (B, C, E, F, G), and Student’s t-test (H)
Fig. 2
Fig. 2
Gossypetin decreases Aβ level in 5xFAD mice. AE Representative image of Aβ plaques (6E10) in hippocampus and cortex of 5xFAD and gossypetin treated 5xFAD mice. Scale bar corresponds to 200μm (A). Bar graph represents quantification of Aβ plaque area (B) and number of Aβ plaque (C) in dentate gyrus of hippocampus (n = 10~12 mice per group, 3~11 slices per brain). Percentage of Aβ plaque area (D) and number of Aβ plaque (E) were measured in cortex as well (n = 10~12 mice per group, 3~10 slices per brain). F, G Level of Aβ oligomers (A11) were compared through dot blot assay (F). Bar graph represents quantification of relative level of Aβ oligomers (G). HJ Expression level of APP, Aβ and GAPDH in hippocampus were examined through Western blot analysis (H). Bar graph represents quantification of protein level of Aβ monomer (I) and APP (J) normalized by GAPDH. KN enzyme-linked immunosorbent assay (ELISA) was conducted to quantify the level of soluble Aβ40 (K), Aβ42 (L), insoluble Aβ40 (M), and Aβ42 (N) in the hippocampus (n = 11~12 mice per group). The error bars represent the mean ± SD (G, I-N) or mean ± SEM (B-E). ***p < 0.001, **p < 0.01, *p < 0.05, ns = not significant, Student’s t test
Fig. 3
Fig. 3
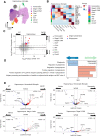
Single-cell characterization of altered transcriptome profiles of 5xFAD microglia by gossypetin administration. (A) Uniform manifold approximation and projection (UMAP) plots showing all microglial cells from hippocampus region. The cells are colored by their cell types. (B) Heatmap showing the Z-scores of average normalized expressions of representative DEGs for each cell type from hippocampus region. (C) Scatter plot showing biological processes of Gene Ontology (GOBP) terms that are upregulated or downregulated by 5xFAD or gossypetin administration for each microglial subtype from hippocampus. Among the significant (Fisher’s exact test, p < 0.01) terms, terms associated with antigen presentation and phagocytosis are colored by their biological keywords. (D) Bar plot displaying gene set enrichment analysis (GSEA)-calculated normalized enrichment score (NES) of GOBP terms for gossypetin administration condition against vehicle treatment within 5xFAD homeostatic microglia from hippocampus. (E) Volcano plot illustrating the differentially expressed genes selected by the comparison between wild type and 5xFAD (left-top) or vehicle and gossypetin (left-bottom, and right) cells from homeostatic microglia and disease-associated microglial population of hippocampus region. Significant (p < 0.05) and DAM-related genes are labeled
Fig. 4
Fig. 4
Gossypetin enhances microglial phagocytosis against Aβ. AD Representative images of Aβ (6E10), Iba-1, and CD68 staining in hippocampus (A) and cortex of 5xFAD and gossypetin treated 5xFAD mice (C). Scale bar corresponds to 100μm. Bar graph represents quantification of phagosome formation (colocalization of Iba-1 and CD68) in hippocampus of 5xFAD treated with vehicle or gossypetin (n = 9 per group, 3~9 slices per brain slice) (B) and cortex (n = 7 per group, 3 slices per brain) (D). E, F Representative images of primary microglia treated with 488-Aβ and stained with Hoechst and Iba-1. Gossypetin (25μM) was pretreated for 24 h before 488-Aβ (250nM) treatment. Scale bar corresponds to 10 μm. E Bar graph represents quantification of area of internalized 488-Aβ in microglia (n = 3 per group, 50~104 cells per sample). Cytochalasin D (Cyto D), which is a phagocytosis inhibitor, was treated as a negative control (F). The error bars represent the mean ± SEM. ****p < 0.0001, ***p < 0.001, **p < 0.01, *p < 0.05, ns = not significant, two-way ANOVA followed by Tukey’s multiple comparisons test (F), Student’s t test (B, D)
Fig. 5
Fig. 5
Gossypetin increases MHC II+ microglia. A, B Representative images of primary microglia stained with Hoechst, Iba-1, and MHC II. Primary microglia were pretreated with gossypetin (25 μM) for 24 h and treated with recombinant Aβ (1 μM). Scale bar corresponds to 50μm (A). Bar graph represents quantification of MHC II+ microglia percentage (n = 6~7, 88~203 cells per set) (B). C, D Representative images of hippocampus stained with Hoechst, Iba-1, and MHC II in 5xFAD and gossypetin treated 5xFAD mice. Scale bar corresponds to 50μm (C). Average number of MHC II+ microglia were counted (n = 6 per group, 3 slices per brain) (D). E, F Representative images of cortex stained with Hoechst, Iba-1, and MHC II in 5xFAD treated with vehicle or gossypetin. Scale bar corresponds to 50μm (E). Bar graph represents average number of MHC II+ microglia that were counted (n = 6 per group, 3 slices per brain) (F). The error bars represent the mean ± SEM. ****p < 0.0001, **p < 0.01, *p < 0.05, ns = not significant, two-way ANOVA followed by Tukey’s multiple comparisons test

References

    1. Panza F, Lozupone M, Logroscino G, Imbimbo BP. A critical appraisal of amyloid-beta-targeting therapies for Alzheimer disease. Nat Rev Neurol. 2019;15(2):73–88. - PubMed
    1. Cummings J, Lee G, Ritter A, Sabbagh M, Zhong K. Alzheimer’s disease drug development pipeline: 2020. Alzheimers Dement (N Y). 2020;6(1):e12050. - PMC - PubMed
    1. Sevigny J, Chiao P, Bussiere T, Weinreb PH, Williams L, Maier M, et al. The antibody aducanumab reduces Abeta plaques in Alzheimer’s disease. Nature. 2016;537(7618):50–6. - PubMed
    1. Lull ME, Block ML. Microglial activation and chronic neurodegeneration. Neurotherapeutics. 2010;7(4):354–65. - PMC - PubMed
    1. Ries M, Sastre M. Mechanisms of Abeta clearance and degradation by glial cells. Front Aging Neurosci. 2016;8:160. - PMC - PubMed

Publication types