. 2022 Sep 1;5(11):e202201568.
doi: 10.26508/lsa.202201568. Print 2022 Nov.

The human RNA polymerase I structure reveals an HMG-like docking domain specific to metazoans

Affiliations

The human RNA polymerase I structure reveals an HMG-like docking domain specific to metazoans

Julia L Daiß et al. Life Sci Alliance. .

Abstract

Transcription of the ribosomal RNA precursor by RNA polymerase (Pol) I is a major determinant of cellular growth, and dysregulation is observed in many cancer types. Here, we present the purification of human Pol I from cells carrying a genomic GFP fusion on the largest subunit allowing the structural and functional analysis of the enzyme across species. In contrast to yeast, human Pol I carries a single-subunit stalk, and in vitro transcription indicates a reduced proofreading activity. Determination of the human Pol I cryo-EM reconstruction in a close-to-native state rationalizes the effects of disease-associated mutations and uncovers an additional domain that is built into the sequence of Pol I subunit RPA1. This "dock II" domain resembles a truncated HMG box incapable of DNA binding which may serve as a downstream transcription factor-binding platform in metazoans. Biochemical analysis, in situ modelling, and ChIP data indicate that Topoisomerase 2a can be recruited to Pol I via the domain and cooperates with the HMG box domain-containing factor UBF. These adaptations of the metazoan Pol I transcription system may allow efficient release of positive DNA supercoils accumulating downstream of the transcription bubble.


Conflict of interest statement

The authors declare that they have no conflict of interest.

Figures

Figure 1.
Figure 1.. Homozygous sfGFP knock-in cell line generation and human Pol I purification.
(A) Western blot against RPA1 shows a shift to larger molecular weight in lysates of the POLR1A-sfGFP cell line, confirming exclusive expression of the modified protein. (B) Site-specific knock-in of the cleavable sfGPF fusion confirmed by PCR from genomic DNA (Sybr-Safe stained agarose gel). (C) Purification of human Pol I shows bands for all subunits in comparison to the Saccharomyces cerevisiae enzyme (silver-stained SDS–PAGE). (D) Confocal imaging shows the exclusive location of GFP-induced fluorescence in the nucleoli in aligned 3D stacks. Spots in the central cell may represent single rDNA genes. Magenta: DAPI stain; Green: sfGFP signal (fused to RPA1).
Figure S1.
Figure S1.. Human Pol I purification and negative stain EM.
(A) Coomassie-stained SDS–PAGE of human Pol I purification from lysates of the HeLa POLR1A-sfGFP cell line. (B) Silver-stained SDS–PAGE shows loss of subunits RPA34, RPA49, and initiation factor RRN3 from most polymerases during MonoQ ion exchange chromatography. (C) Exemplary negative stain EM micrograph of hPol I eluted from anti-GFP-nanobody beads. (D) Exemplary 2D classes of picked particles. (E) Processing of negative stain EM data set by 3D classification shows flexible particles and ∼21% of intact particles using this technique. Two orientations of each 3D class shown. Model of Saccharomyces cerevisiae Pol I shown for comparison (right panel).
Figure S2.
Figure S2.. Mass Spectrometry analysis of human Pol I.
(A) Coomassie-stained SDS–PAGE of human Pol I purification. (B) MS-results for the subunits and initiation factor RRN3 labeled in Panel (A) with Sequence coverages of at least 25%. Number of identified peptides and score indicated. (C) Schematic representation of sequence coverage, to scale from the N terminus to the C terminus. Black bars indicate covered sequences (gaps <20 residues).
Figure 2.
Figure 2.. Activity, domain architecture and cryo-EM reconstruction of human Pol I.
(A) Schematic representation of the assays and scaffold sequences used to determine hPol I activity in vitro. (B) Compared with Sc and Sp Pol I, cleavage activity of hPol I is reduced and only reaches the −1 position, whereas Sc and Sp enzymes can cleave up to three nucleotides from a matched hybrid. Elongation efficiency is comparable, although incorporation of mis-matched nucleotides is strongly increased in the case of hPol. (C) Schematic domain architecture of the Pol I subunits with largest differences to their yeast Pol I counterparts: RPA1, RPA2, RPA34, RPA43, and RPABC2. Subdomains and insertions/deletions of 10 or more residues indicated. (D) Cryo-EM density of human Pol I shows flexibilities in the clamp/stalk region of RPA1 and RPA43. Structure model shown below. (E) Enlarged view of RPA1 funnel helices, RPA2 External II and Hybrid Binding domains, and the RPAC1/2 assembly overlaid with sharpened cryo-EM density.
Figure S3.
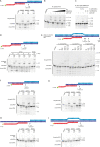
Figure S3.. Proofreading ability of human Pol I is reduced compared with the yeast enzymes.
Schematic scaffold representations and urea PAGE of elongation/cleavage assays show the activity of human Pol I compared with the Saccharomyces cerevisiae and Schizosaccharomyces pombe homologues. (A) Basic scaffold shows differences in elongation/cleavage pattern between S. pombe, S. cerevisiae and Homo sapiens enzymes. (B) Addition of recombinant human RPA49/34 does not abolish proofreading deficiency or induce deeper cleavage. (C) Human Pol I lacking the RPA49/34 heterodimer shows reduced activity. Complementation with recombinant human RPA49/34 or yeast A49/34.5 recovers elongation and cleavage activity but does not significantly change the pattern observed for complete hPol I (Panel A). Protein purification quality shown in Figs S1B and S6A and B. (D) Addition of the initiation factor Rrn3 does not impact elongation and cleavage functionality of Sc Pol I. (E, F, G, H, I) Experiments using different DNA/RNA scaffold sequences (top of each panel) show similar elongation patterns. Results from assays with scaffolds containing a complete nt-strand to create a mis-matched transcription bubble (E and I) underline the reduced backtracking ability of hPol I.
Figure S4.
Figure S4.. Human Pol I cryo-EM processing scheme.
Figure S5.
Figure S5.. Location of hPol I residues mutated in disease.
(A) Structural model of hPol I (grey ribbon, back view) with location of disease-related mutation indicated (color code in panel). (A, B, C, D, E, F, G, H) Close-up views of the residues outlined in (A). (I) The RPAC1 N-terminal region is flexible in hPol I compared with hPol III. (J) Interface of RPAC1 residues 105–109 with the second largest subunit in hPol I and hPol III.
Figure 3.
Figure 3.. Phylogenetic analysis of RNA polymerase I.
Phylogenetic tree calculated based on sequence homology of the three Pol I subunits RPA1 (core), RPA34 (RPA49/34 heterodimer), and RPA43 (stalk subcomplex); schematic. The subunit A14 is found in all Saccharomycotina in the class of Dikarya. This includes model organisms such as Saccharomyces cerevisiae and Schizosaccharomyces pombe, explaining the current paradigm that Pol I comprises 14 subunits. Conservation scores for the RPA1 foot insertion, the Expander (DNA-mimicking loop), and the C-terminal extension of RPA34 were calculated in each class. Blocks show the median length of each specific region (100 residue referenced above). Box reflects the median; error bars indicate SD; conservation scores are grouped into five categories: not conserved (0–3), weakly conserved (3–5), medium conserved (5–7), conserved (7–9), and strongly conserved (9–11).
Figure S6.
Figure S6.. Protein purification and DNA-binding of RPA49/34.
(A) Coomassie-stained SDS–PAGE of purified yeast Pol I versions. (B) Coomassie-stained SDS–PAGE of purified Saccharomyces cerevisiae and Homo sapiens RPA49/34 versions. (C) EMSAs show binding of Hs RPA49/34 and its subdomains to a 40 bp dsDNA-fragment.
Figure 4.
Figure 4.. An HMG box like domain is included into the largest subunit of human Pol I.
(A) Location of the structured insertion in RPA1 α27d-f on the downstream edge of subunit RPABC1 in human Pol I and enlarged view of the region. Overlaid experimental cryo-EM density for the helices α27c-f of subunit RPA1 (grey) and the N-terminal 65 residues of RPABC1 (purple) shown as transparent surface (right). (B) Structure-based sequence alignment of human and yeast Pol I foot insertions (for complete sequence, compare Supplemental Data 1). (C, D) Structure of the RPA1-foot insertion (C) compared with the canonical HMG box 2 of the human protein HMGB1 (D) from two views. The DNA-binding surface of the canonical HMG box 2 is occluded by RPABC1 in hPol I. (E) Structure-based sequence alignment of the RPA1-HMG insertion with the canonical HMG box 2 of HMGB1, and the boxes 1 and 5 of the Pol I transcription factor UBF. In the RPA1-HMG box, the N-terminal region is divergent and the third helix is truncated. Both of these parts are important for DNA-interaction. A loop insertion between the first two helices is part of the RPABC1 interface.
Figure S7.
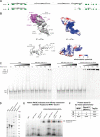
Figure S7.. The HMG box like dock II domain does not bind a dsDNA scaffold and transiently interacts with Top2a.
(A) Schematic representation of H.s. dock II in comparison with the yeast Pol I foot. (B) Electrostatic potential calculated in Chimera indicates an accessible basic patch. (C) EMSAs show low affinity of recombinant dock II to a 40-bp dsDNA fragment. Negative control: MBP-6xhis, positive control: S.c. “Core Factor.” (D) Coomassie-stained SDS–PAGE shows purified dock II-MBP fusion proteins and recombinant Top2a. (E) Native PAGE analysis shows a shift in the main Top2aΔCTD band in the presence of recombinant full-length MBP-dock II indicating a low-affinity interaction. The shift is not observed in a minimal dock II-MBP fusion or MBP-only lanes. (F) Mass spectrometry analysis for unshifted (#) and shifted (*) band of Top2a incubated with full-length MBP-dock II and for Top2a incubated with MBP-only (§) shows that Top2a is present in all bands. MBP and dock II is found in the shifted band and, in lower amounts, in the unshifted band of Top2a + MBP-dock II, but not in the Top2a band incubated with MBP-only.
Figure S8.
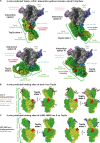
Figure S8.. In situ modelling identifies the dock II domain as potential Top2a–hPol I interaction site.
(A) Four different interaction options between Top2a in state 1 or 2 (subunits of homodimer shown in lemon and green, respectively; dsDNA in red) and hPol I subunit RPA1 predicted by HADDOCK are shown (hPol I core in grey; RPA43 stalk and RPA49/RPA34 heterodimer highlighted; dock II domain in sky blue; hPol I shown as front view tilted 60° towards top view). In situ modelling hence indicates that dock II may serve as interaction platform for Top2a. (B) In situ predicted binding sites of full-length dock II to Top2a (colors as in A) in state 1 and 2 (PDB 6zy7 and 6zy8, respectively) using HADDOCK (sky blue), Autodock (orange), ZDOCK (dark red), and PRISM (purple) are illustrated. (C) HMG box 5 of human UBF (blue) is also predicted to bind Top2a (colors as in A) in states 1 and 2 using ZDOCK.
Figure 5.
Figure 5.. Top2a localizes to the rDNA gene and interacts with UBF.
(A) Top2a is detected over the entire mouse rDNA gene regions occupied by UBF. Original raw data from reference was aligned and deconvoluted as previously described (101). Peaks over the 3′ region of the gene overlap with UBF peaks, indicating co-localization. Top2a overlaps binding peaks for the initiation factors RRN3, TAF1B and TBP, but specific correlations are not observed. Pol I signal marks the actively transcribed region. (B) UBF co-immunoprecipitates with Top2a: Top2a was immunoprecipitated from nuclear extract of U2OS cells using anti-Top2a antibodies (Abcam) immobilized on magnetic beads (DynaI). Immunoprecipitated proteins were analyzed by Western blot using anti-UBF, anti-RPA49, and anti-Top2a antibodies; Lane 1: 10% input, Lane 2: IP with IgG control, Lane 3: IP with anti-Top2a antibodies. (C) Purified Top2a co-precipitates with purified UBF at low salt concentrations. Recombinant fUBF was incubated with purified Top2a at three different salt concentrations (lanes 2–4). Lane 1: fUBF control (no IP), Lane 5: IP without Top2a, Lane 6: Top2a control (no IP), Lane 7: IP without fUBF addition, Lane 8: FLAG-bead only control.
Figure S9.
Figure S9.. DNA-dependent RNA polymerase structures from yeast and mammalia.
Front view of Pol I, II, and III from Saccharomyces cerevisiae (top row; PDB 4C2M, 1WCM, 5FJ8) and from mammals (bottom row; this study, PDB 5FLM, 7AST). Subunits as in Table 1; Color code as in Fig 2: RPA1/RPB1/RPC1: grey; RPA2/RPB2/RPC2: wheat; RPAC1/RPB3: red; RPAC19/RPB11: yellow; RPABC1: magenta; RPABC2: hafnium; RPABC3: green; RPABC4: lemon; RPABC5: density; RPA43/RPB7/RPC8: slate; RPA12/RPB9/RPC10: orange; RPA49/RPC5: light blue; RPA34/RPC4: pink; A14/RPB4/RPC9: hot pink; RPC3: cyan; RPC6: olive green; RPC7: light green.
Figure 6.
Figure 6.. Possible roles of Top2a in human Pol I transcription.
Three hypotheses are likely scenarios: (1) Top2a may support initiation by resolving supercoils generated during dsDNA melting. (2) Top2a may travel with Pol I in an elongation factor like manner to resolve positive supercoils upon their accumulation. (3) Supported by direct and indirect evidence, we speculate that UBF and Top2a cooperate to form “torsion release hubs” at the 3′ region of the rDNA gene.
Figure S10.
Figure S10.. Taxonomic distribution of UBF versions.
Schematic phylogenetic tree based on Pol I subunit sequence homology (compare Fig 3). HMG box domains (IPR009071) are present in HMO1 as also in UBF versions. As in both proteins, a minimum of two consecutive boxes are present, the analyzed entries were restricted on such specific architecture. UBF-like proteins show five or six consecutive HMG boxes. Thus, the distribution of UBF proteins was restricted on the availability of the HMG box 5 (IPR029215). Taxonomic distribution of both entries was analyzed. A minimum of two consecutive HMG boxes can be found thoroughly over all organisms within our phylogenetic tree (green bar). The more specific HMG box 5 (UBF versions) is found in only 29% of the organisms (proportions shown in pie chart) clustering within the higher order group of Metazoa (blue box and blue bar; Cryptophyceae placed within Metazoa but belongs originally to the division of Cryptophyta). Ecdysozoa (within CE) seem to be more diverged from the group of Metazoa as only 1.5% of the sequences are annotated to have an HMG box 5. Red bar: organisms classes in which the dock II domain was identified.

Similar articles

Cited by

References

    1. Roeder RG, Rutter WJ (1969) Multiple forms of DNA-dependent RNA polymerase in eukaryotic organisms. Nature 224: 234–237. 10.1038/224234a0 - DOI - PubMed
    1. Vannini A, Cramer P (2012) Conservation between the RNA polymerase I, II, and III transcription initiation machineries. Mol Cell 45: 439–446. 10.1016/j.molcel.2012.01.023 - DOI - PubMed
    1. Falcon KT, Watt KEN, Dash S, Zhao R, Sakai D, Moore EL, Fitriasari S, Childers M, Sardiu ME, Swanson S, et al. (2022). Dynamic regulation and requirement for ribosomal RNA transcription during mammalian development. Proc Natl Acad Sci U S A 119: e2116974119. 10.1073/pnas.2116974119 - DOI - PMC - PubMed
    1. Goodfellow SJ, Zomerdijk JCBM (2013) Basic mechanisms in RNA polymerase I transcription of the ribosomal RNA genes. SubCell Biochem 61: 211–236. 10.1007/978-94-007-4525-4_10 - DOI - PMC - PubMed
    1. Klinge S, Woolford JL (2019) Ribosome assembly coming into focus. Nat Rev Mol Cell Biol 20: 116–131. 10.1038/s41580-018-0078-y - DOI - PMC - PubMed

Publication types

LinkOut - more resources