. 2022 Sep 8;5(11):e202201481.
doi: 10.26508/lsa.202201481. Print 2022 Nov.

Mechanistic and pharmacodynamic studies of DuoBody-CD3x5T4 in preclinical tumor models

Affiliations

Mechanistic and pharmacodynamic studies of DuoBody-CD3x5T4 in preclinical tumor models

Kristel Kemper et al. Life Sci Alliance. .

Abstract

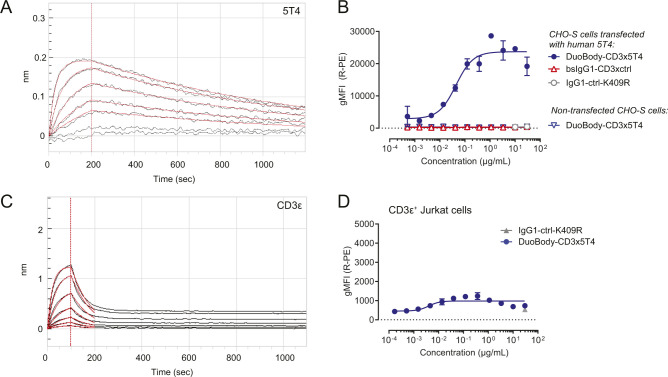
CD3 bispecific antibodies (bsAbs) show great promise as anticancer therapeutics. Here, we show in-depth mechanistic studies of a CD3 bsAb in solid cancer, using DuoBody-CD3x5T4. Cross-linking T cells with tumor cells expressing the oncofetal antigen 5T4 was required to induce cytotoxicity. Naive and memory CD4+ and CD8+ T cells were equally effective at mediating cytotoxicity, and DuoBody-CD3x5T4 induced partial differentiation of naive T-cell subsets into memory-like cells. Tumor cell kill was associated with T-cell activation, proliferation, and production of cytokines, granzyme B, and perforin. Genetic knockout of FAS or IFNGR1 in 5T4+ tumor cells abrogated tumor cell kill. In the presence of 5T4+ tumor cells, bystander kill of 5T4- but not of 5T4-IFNGR1- tumor cells was observed. In humanized xenograft models, DuoBody-CD3x5T4 antitumor activity was associated with intratumoral and peripheral blood T-cell activation. Lastly, in dissociated patient-derived tumor samples, DuoBody-CD3x5T4 activated tumor-infiltrating lymphocytes and induced tumor-cell cytotoxicity, even when most tumor-infiltrating lymphocytes expressed PD-1. These data provide an in-depth view on the mechanism of action of a CD3 bsAb in preclinical models of solid cancer.


Conflict of interest statement

K Kemper, EN van den Brink, R Rademaker, D Verzijl, PJ Engelberts, and ECW Breij are inventors on granted or filed patents pertaining to DuoBody-CD3x5T4. All authors are employees and shareholders of Genmab. DuoBody-CD3x5T4 was co-developed by Genmab and AbbVie Inc (NCT04424641 [closed]).

Figures

Figure S1.
Figure S1.. 5T4 is highly prevalent in solid cancer indications.
(A) TPBG (5T4) mRNA expression from the The Cancer Genome Atlas expression database across different tumor indications. Data are shown with each single dot representing a single tumor and with the mean fragments per kilobase million ± SD for each indication. (B, C) 5T4 protein expression was evaluated by IHC in tumor TMAs. (B) One representative tissue core is shown from each of the evaluated cancer indications. In the top row, the scale bar indicates either 500 μm (breast, bladder, uterine, lung, and esophageal cancer) or 1 mm (HNSCC and prostate), whereas in the bottom row, the scale bar corresponds to 50 μm. (C) The percentage of 5T4+ tumor cells in each tumor type, as well as the median ± min/max values (error bars) and the quartiles (box) for each indication as determined by IHC analysis. The gray shading represents the cutoff (≥10% of tumor cells that are 5T4+) used to determine the prevalence of 5T4 expression (Table S1).
Figure S2.
Figure S2.. Binding characteristics of DuoBody-CD3x5T4.
(A) Binding of DuoBody-CD3x5T4 to recombinant 5T4 as determined by BLI. (B) CHO-S cells, transiently transfected with human 5T4, were stained with DuoBody-CD3x5T4 or negative control antibodies bsIgG1-CD3xctrl and IgG1-ctrl-K409R. Non-transfected CHO-S cells were included as negative control for binding of DuoBody-CD3x5T4. Data shown are the geometric mean fluorescence intensity ± SD of duplicate wells from one representative flow cytometry experiment of three experiments performed. (C) Binding of DuoBody-CD3x5T4 to recombinant CD3ε as determined by BLI. (D) Jurkat T cells were stained with DuoBody-CD3x5T4. As a negative control, IgG1-ctrl-K409R (30 μg/ml) was included. Data shown are geometric mean fluorescence intensity ± SD of duplicate wells from one representative experiment of three flow cytometry experiments performed.
Figure S3.
Figure S3.. The kinetics of T cell–mediated cytotoxicity and T-cell activation induced by DuoBody-CD3x5T4.
(A) Schematic representation of the T cell–mediated cytotoxicity assay and its readouts. Cocultures were incubated for 72 h at an E:T ratio of 4:1, unless specified otherwise. (B, C) MDA-MB-468 tumor cells (∼32,000 5T4 molecules/cell as determined by quantitative flow cytometry) were incubated with purified T cells from three different donors at the indicated E:T ratios and DuoBody-CD3x5T4 or the control antibodies bsIgG1-ctrlx5T4 or bsIgG1-CD3xctrl for 72 h. (B) Data shown are mean percentage survival ± SD of duplicate wells from one representative donor of three donors included in three experiments. (C) Median IC50 (±range) of loss of tumor cell viability for all tested E:T ratios. (D, E, F, G, H) T cell–mediated cytotoxicity assay with MDA-MB-231 tumor cells (∼14,000 5T4 molecules/cell as determined by quantitative flow cytometry) was performed with purified T cells (E:T ratio = 4:1, n = 3 donors) and DuoBody-CD3x5T4 for 24, 48, and 72 h. Shown is a representative donor of three donors tested. (D) Mean percentages of viable tumor cells ± SD of duplicate wells is shown, illustrating the kinetics of DuoBody-CD3x5T4–induced T cell–mediated cytotoxicity of MDA-MB-231 cells. (E) Kinetics of CD4+ (left) and CD8+ (right) T-cell activation (CD69 expression) induced by DuoBody-CD3x5T4 when incubated with MDA-MB-231 cells. (F) Kinetics of IFNγ, IL-6, IL-8, and TNFα production induced by DuoBody-CD3x5T4 when cocultured with T cells and MDA-MB-231 cells, showing a representative donor of two donors tested. (G, H) Kinetics of granzyme B (G) and perforin (H) production induced by DuoBody-CD3x5T4 when cocultured with T cells and MDA-MB-231 cells, showing a representative donor of two donors tested. (I) MDA-MB-231 tumor cells were incubated with CFSE-labeled T cells (E:T ratio = 8:1) and DuoBody-CD3x5T4 or control antibodies for 72 h. CFSE dilution in T cells was analyzed by flow cytometry and the T-cell expansion index (i.e., how much the total T-cell population has expanded by proliferation) for CD4+ (left panel) and CD8+ (right panel) T cells is shown. Data shown are a representative donor of three donors tested.
Figure 1.
Figure 1.. Enriched naive and memory CD4+ and CD8+ T cells can mediate DuoBody-CD3x5T4–induced cytotoxicity in vitro.
(A) Schematic representation of the T cell–mediated cytotoxicity assay using enriched naive and memory CD4+ and CD8+ T cells in coculture with MDA-MB-468 tumor cells. (B) Kinetics of DuoBody-CD3x5T4–induced cytotoxicity mediated by the indicated T-cell subsets, showing a representative donor of three donors tested. (C, D) Kinetics of DuoBody-CD3x5T4–induced CD4+ (C) and CD8+ (D) T-cell activation for total, naive, or memory subsets, showing a representative donor of three donors tested. (E) Kinetics of DuoBody-CD3x5T4–induced cytokine and GZMB production by indicated T-cell subsets, showing a representative donor of two donors tested. (F) The transition of naive (CD45RA+RO) to memory-like (CD45RA+RO+) CD4+ and CD8+ T cells induced by 1 μg/ml DuoBody-CD3x5T4 at different time points, showing a representative donor of two donors tested. This was determined by flow cytometry as a percentage of total CD3+ T cells.
Figure S4.
Figure S4.. CD4+ and CD8+ memory T cells do not transition into CD45RA+RO+ double-positive cells after incubation with DuoBody-CD3x5T4.
(A) Purity of naive and memory T-cell subsets after enrichment ± SD of duplicate wells of a representative experiment. (B) T-cell composition of healthy donor PBMCs (mean of five donors ± SD), measured by flow cytometry. (C, D) MDA-MB-468 cells were incubated with the indicated enriched memory (CD45RO+) CD4+ and CD8+ T-cell subsets and DuoBody-CD3x5T4 for 24, 48, and 72 h (see Fig 1A). (C) The transition of naive (CD45RA+RO) to memory-like (CD45RA+RO+) CD4+ and CD8+ T cells induced by 1 μg/ml DuoBody-CD3x5T4 or no antibody control at different time points was determined by flow cytometry as exemplified. (D) The percentage of CD45RA+, CD45RO+, and CD45RA+CD45RO+ T cells in the T cell–mediated cytotoxicity assays was determined by flow cytometry, showing a representative donor of two donors tested. No loss of memory (CD45RO+) T cells was observed over time. The contaminating (still present after CD45RO+ enrichment) naive (CD45RA+) T cells however seem to transition into CD45RA+RO+ double-positive cells.
Figure 2.
Figure 2.. DuoBody-CD3x5T4–induced T cell–mediated cytotoxicity and T-cell activation are dependent on the presence of 5T4+ target cells.
(A) Expression of 5T4 in a panel of cancer cell lines of different indications, determined by quantitative flow cytometry (n = 2–4 per cell line). Shown here are the mean (horizontal line) and the range of expression detected. (B, C, D) Dose-dependent T cell–mediated cytotoxicity of different tumor cell lines in the presence of DuoBody-CD3x5T4 and purified T cells (E:T ratio = 4:1) after 72 h. Shown are mean survival percentages ± SD of duplicate wells derived from a representative donor of five (RL95-2) or three (SW780, SK-GT-4) donors tested. (E) Geomean IC50 values (and range) for DuoBody-CD3x5T4–induced loss of tumor cell viability of all tested tumor cell lines (n = 3–10 donors/cell line) plotted against the number of 5T4 molecules/cell (P ≤ 0.05; nonparametric Spearman correlation). (F) T cell–mediated cytotoxicity of MDA-MB-231 parental and 5T4 KO cells in the presence of DuoBody-CD3x5T4 and purified T cells (E:T ratio = 4:1) after 72 h, showing a representative donor of 4 donors tested.
Figure S5.
Figure S5.. DuoBody-CD3x5T4 can induce T cell–mediated cytotoxicity in a range of cancer cell lines.
(A, B, C, D, E, F, G, H, I, J, K, L) T cell–mediated cytotoxicity induced by DuoBody-CD3x5T4 when incubated with purified T cells from one representative donor (E:T ratio = 4:1) and a range of cancer cell lines with varying levels of 5T4 expression for 72 h: (A) SiHa (n = 6 donors tested), (B) NCI-H292 (n = 5 donors tested), (C) BxPc-3 (n = 3 donors tested), (D) MDA-MB-231 (n = 5 donors tested), (E) PANC-1 (n = 9 donors tested), (F) Fadu (n = 4 donors tested), (G) EPLC-272H (n = 3 donors tested), (H) Ca Ski (n = 5 donors tested), (I) RT-122 (n = 6 donors tested), (J) PC-3 (n = 3 donors tested), (K) SCC-9 (n = 4 donors tested), and (L) DU 145 (n = 5 donors tested). (M) 5T4 expression on MDA-MB-231 parental and 5T4 KO cells was measured by flow cytometry.
Figure 3.
Figure 3.. Fas and IFNGR1 expression contribute to the induction of T cell–mediated cytotoxicity by DuoBody-CD3x5T4.
(A) 5T4 and Fas expression on MDA-MB-231 parental and Fas KO cells was measured by quantitative flow cytometry with or without prior overnight incubation with IFNγ (100 ng/ml). (B, C, D, E) MDA-MB-231 parental and Fas KO cells were incubated with purified CD4+ (B, D) or CD8+ (C, E) T cells (E:T ratio = 4:1, n = 5 donors) and DuoBody-CD3x5T4 for 72 h. T-cell activation (B, C) and T cell–mediated cytotoxicity (D, E) were analyzed. (B, C) Activation of T cells from five donors at 1 μg/ml DuoBody-CD3x5T4 (*P ≤ 0.05, paired t test). (D, E) The left panels show dose-dependent T cell–mediated cytotoxicity in a representative experiment, and the right panels show tumor cell viability at 1 μg/ml DuoBody-CD3x5T4 from five donors (*P ≤ 0.05 and **P ≤ 0.01, paired t test). (F) 5T4, IFNGR1 and Fas expression on MDA-MB-231 parental and IFNGR1 KO cells was measured by flow cytometry. (G, H) MDA-MB-231 parental and IFNGR1 KO cells were incubated with purified T cells (E:T ratio = 4:1, n = 4 donors) and DuoBody-CD3x5T4 for 72 h. (G) The left panel shows dose-dependent T cell–mediated cytotoxicity in a representative experiment, and the right panel shows tumor cell viability at 1 μg/ml DuoBody-CD3x5T4 from four donors (***P ≤ 0.005, paired t test). (H) T-cell activation at 1 μg/ml DuoBody-CD3x5T4 from four donors.
Figure S6.
Figure S6.. Fas contributes to the induction of T cell–mediated cytotoxicity by DuoBody-CD3x5T4.
(A) MDA-MB-231 parental and Fas KO cells were incubated with purified CD4+ or CD8+ T cells (E:T ratio = 4:1, n = 5 donors) and DuoBody-CD3x5T4 for 72 h. T-cell activation was analyzed by measuring up-regulation of CD69. (B) 5T4 and Fas expression on NCI-H1299 parental and Fas KO cells was measured by flow cytometry with or without incubation with IFNγ (100 ng/ml). (C, D) NCI-H1299 parental and Fas KO cells were incubated with purified CD4+ (top panels) or CD8+ (bottom panels) T cells (E:T ratio = 4:1, n = 5–6 donors tested) and DuoBody-CD3x5T4 for 72 h. (C) The left panels show dose-dependent T cell–mediated cytotoxicity, and the right panels show T cell–mediated cytotoxicity at 1 μg/ml DuoBody-CD3x5T4. A paired t test was used to compare T cell–mediated cytotoxicity at 1 μg/ml, with *P ≤ 0.05 and **P ≤ 0.01. (D) The left panels show dose-dependent T-cell activation, and the right panels show T-cell activation at 5 μg/ml DuoBody-CD3x5T4. (E) MDA-MB-231 parental and IFNGR1 KO cells were incubated with purified T cells (E:T ratio = 4:1, n = 4 donors) and DuoBody-CD3x5T4 for 72 h, and T-cell activation was analyzed measuring up-regulation of CD69. A representative donor of four donors tested is shown.
Figure 4.
Figure 4.. DuoBody-CD3x5T4 can induce bystander kill which is dependent on IFNGR1 expression.
(A) Parental and 5T4 KO MDA-MB-231 tumor cells were mixed in different ratios, as indicated, and incubated with purified T cells (E:T ratio = 4:1, n = 2 donors) and DuoBody-CD3x5T4 for 72 h. T cell–mediated cytotoxicity of 5T4+ (left panel) and 5T4 (right panel) tumor cells was determined by flow cytometry, showing a representative donor of three donors tested. (B, C, D) Parental (5T4+) MDA-MB-231 tumor cells were cocultured with purified T cells (E:T = 4:1, n = 2 donors) and incubated with 10 μg/ml DuoBody-CD3x5T4 or bsIgG1-CD3xctrl for 72 h. As a positive control, T cells were incubated with anti-CD3/CD28 beads (but without tumor cells) for 72 h. (B) The supernatant (either with or without T cells) was transferred to MDA-MB-231 5T4 KO cells and incubated for 72 h (B). As negative control, MDA-MB-231 5T4 KO cells were incubated with fresh T cells and indicated antibodies for 72 h. (C, D) T cell–mediated cytotoxicity (C) and Fas expression (D) of MDA-MB-231 5T4 KO cells were determined by flow cytometry. A representative donor of two donors tested is shown. (E) 5T4, Fas, IFNGR1, and PD-L1 expression on MDA-MB-231 parental, 5T4/Fas KO, and 5T4/IFNGR1 KO cells was measured by flow cytometry with or without prior overnight incubation with IFNγ (100 ng/ml). (F, G, H, I) Parental and 5T4/Fas KO or 5T4/IFNGR1 MDA-MB-231 tumor cells were mixed in different ratios, as indicated, and incubated with purified T cells (E:T ratio = 4:1, n = 4–6) and 1 μg/ml DuoBody-CD3x5T4 for 72 h, after which T cell–mediated cytotoxicity (F), CD4+ (G) and CD8+ (H) T-cell activation, and IFNγ production (I) were analyzed. The predicted black line in (F) refers to the outcome of the assay when no bystander killing is expected, for example, if 50% of tumor cells are 5T4+, only 50% of tumor cells will be killed.
Figure S7.
Figure S7.. DuoBody-CD3x5T4 can induce bystander kill which is dependent on IFNGR1 expression.
(A, B) Parental (5T4+) MDA-MB-231 tumor cells were cocultured with purified T cells (E:T = 4:1, n = 2 donors) and incubated with 10 μg/ml DuoBody-CD3x5T4 or bsIgG1-CD3xctrl for 72 h. As a positive control, T cells were incubated with anti-CD3/CD28 beads (but without tumor cells) for 72 h. The supernatant (either with or without T cells) was transferred to MDA-MB-231 5T4 KO cells and incubated for 72 h. As negative control, MDA-MB-231 5T4 KO cells were incubated with fresh T cells and indicated antibodies for 72 h. (A, B) T cell–mediated cytotoxicity of MDA-MB-231 parental cells (A) and T-cell activation (B) were determined by flow cytometry. (C, D, E) Parental and 5T4, 5T4/Fas, or 5T4/IFNGR1 KO MDA-MB-231 tumor cells were mixed in different ratios, as indicated, and incubated with purified T cells (E:T ratio = 4:1) and DuoBody-CD3x5T4 for 72 h, after which T cell–mediated cytotoxicity (C, three representative donors of 4 [5T4/IFNGR1 KO] or six [5T4 and 5T4/Fas KO] analyzed), CD8+ T-cell activation (D, a representative donor of 4 [5T4/IFNGR1 KO] or six [5T4 and 5T4/Fas KO] analyzed), and IFNγ production (E, one representative donor of 4 [5T4/IFNGR1 KO] or six [5T4 and 5T4/Fas KO] analyzed) were determined.
Figure S8.
Figure S8.. DuoBody-CD3x5T4 demonstrates antitumor activity in vivo.
(A, B, C, D, E, F, G, H, I, J) The breast cancer CDX model was established by SC implantation of 5 × 10⁶ MDA-MB-231 cells and 5 × 10⁶ huPBMCs into NOD-SCID mice. (A, B, C, D, E) Immediately after tumor inoculation, mice were prophylactically treated with a single dose of DuoBody-CD3x5T4 (0.05, 0.5 or 5 mg/kg; IV; n = 10/group). PBS-treated mice were included as controls. (A, B, C) Tumor volume for individual mice in each treatment group over time. The dotted line indicates the cutoff for progression-free survival (500 mm3). The gray lines indicate tumor volumes of individual mice receiving PBS. (D) Tumor volumes in the different treatment groups at the last day where all treatment groups were complete. Data shown are the tumor volumes of individual mice in each treatment group, as well as mean tumor volume ± SEM per treatment group. An ordinary one-way ANOVA with a posttest for linear trend was used to compare log-transformed tumor volumes of the treatment groups to the PBS-treated group (P = 0.0002). (E) Progression-free survival, defined as the percentage of mice with tumor volume smaller than 500 mm3, is shown as a Kaplan–Meier curve. Mantel–Cox analysis with Bonferroni correction for multiple testing was used to compare progression-free survival between treatment groups, with **P ≤ 0.01 and ***P ≤ 0.001. (F, G, H, I, J) Treatment with DuoBody-CD3x5T4 (0.05, 0.5, 5, or 20 mg/kg; IV) or IgG1-ctrl (20 mg/kg) was initiated when tumors reached a volume of ∼100 mm3. (F, G, H, I) Tumor volume in individual mice in the 0.05 (F), 0.5 (G), 5 (H), and 20 (I) mg/kg DuoBody-CD3x5T4 treatment groups (n = 5/group) over time. The gray lines indicate tumor volumes of individual mice receiving 20 mg/kg IgG1-ctrl. The dotted line indicates the cutoff for progression-free survival (500 mm3). (J) Progression-free survival, defined as the percentage of mice with tumor volume <500 mm3, is shown as a Kaplan–Meier curve. Mantel–Cox analysis with Bonferroni correction for multiple testing was used to compare progression-free survival between treatment groups and control, but no significant differences were found. (K) In a pilot experiment, prostate cancer (DU-145) cells were inoculated in NCG mice. When tumors reached a volume of 70–100 mm3, mice (n = 5) were IV injected with 1 × 10⁷ PBMCs derived from human healthy donors. Tumor dissociates were analyzed by flow cytometry for T-cell infiltration 7, 14, and 21 d after PBMC injection. (L, M, N, O, P) The LU7336 patient-derived xenograft model was established by SC implantation into NOG-HIS mice, humanized with human CD34+ hematopoietic stem cells of three different donors. After tumor outgrowth (average tumor size of ∼150 mm3), mice were treated with DuoBody-CD3x5T4 (0.05, 0.5, or 5 mg/kg; IV; n = 4/group). PBS-treated mice (n = 3) were included as controls. Antitumor activity was only observed with one donor (other two donors are not shown). (L, M, N) Tumor volume for individual mice in each treatment group over time. The dotted red line indicates the cutoff for progression-free survival (500 mm3). The gray lines indicate tumor volumes of individual mice receiving PBS. (O) Tumor volumes of the DuoBody-CD3x5T4 and PBS groups at the last day where all treatment groups were complete. Data shown are the tumor volumes of individual mice in each treatment group, as well as mean tumor volume ± SEM per treatment group. An ordinary one-way ANOVA with posttest for linear trend was used to compare log-transformed tumor volumes of the treatment groups to the PBS-treated group (P = 0.2252). (P) Progression-free survival, defined as the percentage of mice with tumor volume smaller than 500 mm3, is shown as a Kaplan–Meier curve. Mantel–Cox analysis with Bonferroni correction for multiple comparisons was used to compare progression-free survival between treatment groups and the PBS-treated group, with *P ≤ 0.05.
Figure 5.
Figure 5.. DuoBody-CD3x5T4 demonstrates antitumor activity in vivo.
(A, B, C, D, E) When SC-implanted prostate cancer CDX (DU-145) tumors reached a volume of ∼75 mm3, huPBMCs were injected IV. (A) 7 d later, treatment with DuoBody-CD3x5T4 (0.5, 5, or 20 mg/kg; IV) or IgG1-ctrl (20 mg/kg) was initiated (A; n = 15 per treatment group). (B, C, D) Tumor volume for individual mice in the 0.5 (B), 5 (C), or 20 (D) mg/kg DuoBody-CD3x5T4 treatment groups over time. The gray lines indicate tumor volumes of individual mice receiving 20 mg/kg IgG1-ctrl. The dotted line indicates the cutoff for progression-free survival (500 mm3). (E) Progression-free survival, defined as the percentage of mice with tumor volume <500 mm3, is shown as a Kaplan–Meier curve. Mantel–Cox analysis with Bonferroni correction for multiple comparisons was used to compare progression-free survival between treatment groups and control, with ***P ≤ 0.001. (F, G, H, I, J, K) The breast cancer MDA-MB-231 CDX model was established by SC implantation of 5 × 10⁶ MDA-MB-231 cells into NSG-HIS mice. (F) When tumors reached an average volume of ∼200 mm3, mice were treated with DuoBody-CD3x5T4 (0.5, 5, and 20 mg/kg, n = 9/group) or IgG1-ctrl (20 mg/kg, n = 9) (F). (G, H, I) Tumor volume for individual mice in the 0.5 (G), 5 (H), or 20 (I) mg/kg DuoBody-CD3x5T4 treatment groups over time. The gray lines indicate tumor volumes of individual mice receiving 20 mg/kg IgG1-ctrl. The dotted line indicates the cutoff for progression-free survival (500 mm3). (J) Tumor volumes of the different groups on the last day (day 42 after tumor inoculation) where all groups were complete. An ordinary one-way ANOVA with a posttest for linear trend was used to compare log-transformed tumor volumes (P = 0.0007). (K) Progression-free survival, defined as the percentage of mice with tumor volume <1,000 mm3, is shown as a Kaplan–Meier curve. Mantel–Cox analysis with Bonferroni correction for multiple comparisons was used to compare progression-free survival between treatment groups and control, with **P ≤ 0.01 and ***P ≤ 0.001.
Figure 6.
Figure 6.. Antitumor efficacy of DuoBody-CD3x5T4 is associated with peripheral and intratumoral T-cell activation.
(A, B, C, D) The breast cancer MDA-MB-231 CDX model was established by SC implantation of 5 × 10⁶ MDA-MB-231 cells into NSG-HIS mice (as described in Fig 5F). (A) When tumors reached an average volume of ∼200 mm3, mice were treated with DuoBody-CD3x5T4 (0.5, 5, and 20 mg/kg, n = 9/group) or IgG1-ctrl (20 mg/kg, n = 9). Blood samples were taken at 24, 48, and 72 h after treatment. After 72 h, tumors were excised, dissociated, and analyzed for T-cell activation by flow cytometry. (B, C) CD8+ T-cell activation in the blood (B) and the tumor (C) was determined by flow cytometry. (B) Shown is the percentage of CD69+, CD25+, or PD-1+ CD8+ T cells. Ordinary one-way ANOVA with posttest for linear trend was used to compare the percentage activation marker-positive cells between the different treatment groups (CD69+, P = 0.002; CD25+, P = 0.027; PD-1+, P = 0.001). (C) Shown are the relative expression levels (mean fluorescence intensity) of CD69, CD25, and PD-1 on intratumoral CD8+ T cells. Ordinary one-way ANOVA with posttest for a linear trend was used to compare the mean fluorescence intensity between the different treatment groups (CD69, P = 0.561; CD25, P = 0.386; PD-1, P = 0.001). (D) Peripheral blood cytokine (IFNγ, IL-6, and IL-8) and GZMB levels were measured with a multiplex MSD assay. For the ordinary one-way ANOVA with posttest for a linear trend, cytokine concentrations were log-transformed. A significant trend was observed for IFNγ, IL-6, and IL-8 at 24 and 48 h (P ≤ 0.05). (E, F, G) Similar experiment as performed in (A); mice were treated with 0.5 mg/kg DuoBody-CD3x5T4 or IgG1-ctrl (n = 5/group) after a tumor volume of 300 mm3 was reached. Blood samples were taken 24 and 48 h after treatment (Fig S9C). (E, F) Tumors were analyzed 72 h after treatment by IHC and IF for T-cell infiltration (CD3+), activation (CD25+ and GZMB+), and proliferation (CD3+Ki67+). Scale bars in (E) correspond to 500 μm (upper rows) and 50 μm (lower rows). (G) Tumors were dissociated 72 h after treatment and the supernatant of the dissociated tumor cells was analyzed for the presence of GZMB and cytokines by a Luminex assay. Groups were compared using Mann–Whitney, with *P ≤ 0.05 and **P ≤ 0.01.
Figure S9.
Figure S9.. Antitumor activity of DuoBody-CD3x5T4 is associated with peripheral and intratumoral T-cell activation.
(A, B) The breast cancer MDA-MB-231 CDX model was established by SC implantation of 5 × 10⁶ MDA-MB-231 cells into NSG-HIS mice. When tumors reached an average volume of ∼200 mm3, mice were treated with DuoBody-CD3x5T4 (0.5, 5, and 20 mg/kg, n = 10/group) or IgG1-ctrl (20 mg/kg, n = 10). Blood samples were taken at 72 h after treatment for analysis of T-cell activation in the blood. After 72 h, mice were euthanized, and tumors were dissociated and analyzed for intratumoral T-cell activation by flow cytometry. (A) CD4+ T-cell activation in the blood was expressed as percentage of CD69+, CD25+, or PD-1+ T cells, as determined by flow cytometry. Ordinary one-way ANOVA with posttest for linear trend was used to compare the percentage activation marker-positive cells between the different treatment groups (CD69+, P = 0.025; CD25+, P = 0.870; PD-1+, P = 0.289). (B) Relative expression levels (mean fluorescence intensity) of the T-cell activation markers CD69+, CD25+, or PD-1+ on intratumoral CD4+ T cells were determined by flow cytometry. Ordinary one-way ANOVA with posttest for linear trend was used to compare the mean fluorescence intensity between the different treatment groups (CD69, P = 0.103; CD25, P = 0.013; PD-1, P = 0.058). (C, D, E, F) Similar experiment as performed in (A, B); mice were treated with 0.5 mg/kg DuoBody-CD3x5T4 or IgG1-ctrl (n = 5/group) after tumor volume of 300 mm3 was reached. (C) Plasma samples were taken 24 and 48 h after treatment for cytokine analysis. (D) After 72 h, mice were euthanized, and tumors were dissociated and analyzed for T-cell activation by flow cytometry. Groups were compared using Mann–Whitney analysis, with *P ≤ 0.05 and **P ≤ 0.01. (E) Spatial distribution of tumor-infiltrating CD3+ T cells at 72 h after treatment as determined by IHC (corresponding to Fig 6E). Scale bar corresponds to 1 mm. (F) Tumor infiltration of CD4+ and CD8+ T cells at 72 h after treatment as determined by flow cytometry of dissociated tumors.
Figure 7.
Figure 7.. DuoBody-CD3x5T4 induces T cell–mediated cytotoxicity in dissociated patient-derived solid tumor samples ex vivo.
(A) Experimental outline of the evaluation of T cell–mediated tumor cell killing by DuoBody-CD3x5T4 in dissociated patient-derived solid tumor samples ex vivo. (B) 5T4 and CD3 expression in ovarian tumor samples OV1 and OV2, as determined by IHC. The scale bars in the top row correspond to 500 μm, and the scale bars in the bottom row correspond to 50 μm (OV1) or 20 μm (OV2). (C) Binding of DuoBody-CD3x5T4 or isotype control (bsIgG1-CD3xctrl) to dissociated patient-derived solid tumor cells (CD45 population) was evaluated by flow cytometry. LU, lung cancer; OV, ovarian cancer; UT, uterine cancer. (D) The percentage of CD3+ T cells in the dissociated patient-derived solid tumor samples. (E, F, G, H) T cell–mediated cytotoxicity ± SEM (E), T-cell activation (F; %CD25+ and PD-1+), and cytokine (G) and GZMB (H) production ± SD of duplicate wells induced by DuoBody-CD3x5T4 versus control (bsIgG1-CD3xctrl) in four dissociated patient-derived solid tumor samples ex vivo.

References

    1. Al-Taei S, Salimu J, Lester JF, Linnane S, Goonewardena M, Harrop R, Mason MD, Tabi Z (2012) Overexpression and potential targeting of the oncofoetal antigen 5T4 in malignant pleural mesothelioma. Lung Cancer 77: 312–318. 10.1016/j.lungcan.2012.03.008 - DOI - PubMed
    1. Alam SMK, Jasti S, Kshirsagar SK, Tannetta DS, Dragovic RA, Redman CW, Sargent IL, Hodes HC, Nauser TL, Fortes T, et al. (2018) Trophoblast glycoprotein (TPGB/5T4) in human placenta: Expression, regulation, and presence in extracellular microvesicles and exosomes. Reprod Sci 25: 185–197. 10.1177/1933719117707053 - DOI - PMC - PubMed
    1. Ali A, Langdon J, Stern P, Partridge M (2001) The pattern of expression of the 5T4 oncofoetal antigen on normal, dysplastic and malignant oral mucosa. Oral Oncol 37: 57–64. 10.1016/s1368-8375(00)00057-9 - DOI - PubMed
    1. Appleton KM, Elrod AK, Lassahn KA, Shuford S, Holmes LM, DesRochers TM (2021) PD-1/PD-L1 checkpoint inhibitors in combination with olaparib display antitumor activity in ovarian cancer patient-derived three-dimensional spheroid cultures. Cancer Immunol Immunother 70: 843–856. 10.1007/s00262-021-02849-z - DOI - PMC - PubMed
    1. Arenas EJ, Martinez-Sabadell A, Rius Ruiz I, Roman Alonso M, Escorihuela M, Luque A, Fajardo CA, Gros A, Klein C, Arribas J (2021) Acquired cancer cell resistance to T cell bispecific antibodies and CAR T targeting HER2 through JAK2 down-modulation. Nat Commun 12: 1237. 10.1038/s41467-021-21445-4 - DOI - PMC - PubMed