

PA-X protein of H1N1 subtype influenza virus disables the nasal mucosal dendritic cells for strengthening virulence
- PMID: 36271710
- PMCID: PMC9629126
- DOI: 10.1080/21505594.2022.2139474
PA-X protein of H1N1 subtype influenza virus disables the nasal mucosal dendritic cells for strengthening virulence
Abstract
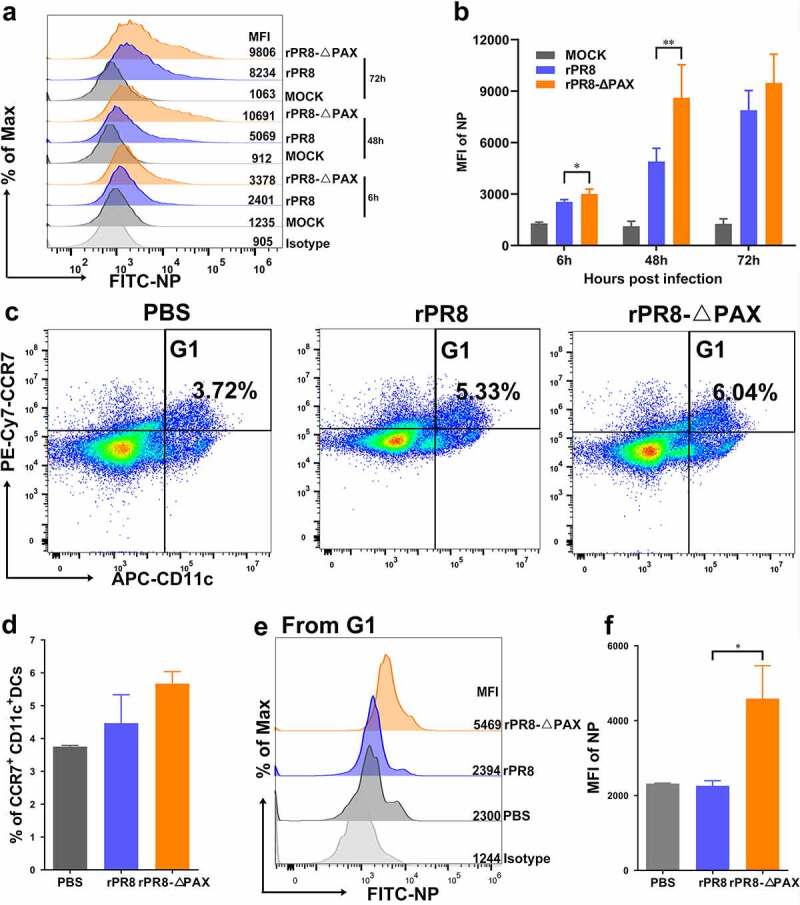
PA-X protein arises from a ribosomal frameshift in the PA of influenza A virus (IAV). However, the immune regulatory effect of the PA-X protein of H1N1 viruses on the nasal mucosal system remains unclear. Here, a PA-X deficient H1N1 rPR8 viral strain (rPR8-△PAX) was generated and its pathogenicity was determined. The results showed that PA-X was a pro-virulence factor in mice. Furthermore, it reduced the ability of H1N1 viruses to infect dendritic cells (DCs), the regulator of the mucosal immune system, but not non-immune cells (DF-1 and Calu-3). Following intranasal infection of mice, CCL20, a chemokine that monitors the recruitment of submucosal DCs, was downregulated by PA-X, resulting in an inhibition of the recruitment of CD11b+ DCs to submucosa. It also attenuated the migration of CCR7+ DCs to cervical lymph nodes and inhibited DC maturation with low MHC II and CD40 expression. Moreover, PA-X suppressed the maturation of phenotypic markers (CD80, CD86, CD40, and MHC II) and the levels of secreted pro-inflammatory cytokines (IL-1β, IL-6, and TNF-α) while enhancing endocytosis and levels of anti-inflammatory IL-10 in vitro, suggesting an impaired maturation of DCs that the key step for the activation of downstream immune responses. These findings suggested that the PA-X protein played a critical role in escaping the immune response of nasal mucosal DCs for increasing the virulence of H1N1 viruses.
Keywords: H1N1; Influenza A virus; PA-X protein; dendritic cells; innate immunity; virulence.
Conflict of interest statement
No potential conflict of interest was reported by the author(s).
Figures


Similar articles
-
PA-X protein assists H9N2 subtype avian influenza virus in escaping immune response of mucosal dendritic cells.Transbound Emerg Dis. 2022 Sep;69(5):e3088-e3100. doi: 10.1111/tbed.14665. Epub 2022 Aug 3. Transbound Emerg Dis. 2022. PMID: 35855630
-
Differential Modulation of Innate Immune Responses in Human Primary Cells by Influenza A Viruses Carrying Human or Avian Nonstructural Protein 1.J Virol. 2019 Dec 12;94(1):e00999-19. doi: 10.1128/JVI.00999-19. Print 2019 Dec 12. J Virol. 2019. PMID: 31597767 Free PMC article.
-
Influenza A Virus Protein PA-X Contributes to Viral Growth and Suppression of the Host Antiviral and Immune Responses.J Virol. 2015 Jun;89(12):6442-52. doi: 10.1128/JVI.00319-15. Epub 2015 Apr 8. J Virol. 2015. PMID: 25855745 Free PMC article.
-
Modulation of Innate Immune Responses by the Influenza A NS1 and PA-X Proteins.Viruses. 2018 Dec 12;10(12):708. doi: 10.3390/v10120708. Viruses. 2018. PMID: 30545063 Free PMC article. Review.
-
PA-X: a key regulator of influenza A virus pathogenicity and host immune responses.Med Microbiol Immunol. 2018 Nov;207(5-6):255-269. doi: 10.1007/s00430-018-0548-z. Epub 2018 Jul 4. Med Microbiol Immunol. 2018. PMID: 29974232 Free PMC article. Review.
Cited by
-
Pathogenicity and virulence of influenza.Virulence. 2023 Dec;14(1):2223057. doi: 10.1080/21505594.2023.2223057. Virulence. 2023. PMID: 37339323 Free PMC article. Review.
-
Effect of Mixed Probiotics on Alleviating H1N1 Influenza Infection and Regulating Gut Microbiota.Foods. 2024 Sep 27;13(19):3079. doi: 10.3390/foods13193079. Foods. 2024. PMID: 39410114 Free PMC article.
-
The emergence of new antigen branches of H9N2 avian influenza virus in China due to antigenic drift on hemagglutinin through antibody escape at immunodominant sites.Emerg Microbes Infect. 2023 Dec;12(2):2246582. doi: 10.1080/22221751.2023.2246582. Emerg Microbes Infect. 2023. PMID: 37550992 Free PMC article.
-
Interaction among inflammasome, PANoptosise, and innate immune cells in infection of influenza virus: Updated review.Immun Inflamm Dis. 2023 Sep;11(9):e997. doi: 10.1002/iid3.997. Immun Inflamm Dis. 2023. PMID: 37773712 Free PMC article. Review.
-
PA and PA-X: two key proteins from segment 3 of the influenza viruses.Front Cell Infect Microbiol. 2025 Mar 14;15:1560250. doi: 10.3389/fcimb.2025.1560250. eCollection 2025. Front Cell Infect Microbiol. 2025. PMID: 40160474 Free PMC article. Review.
References
-
- Klemm C, Boergeling Y, Ludwig S, et al. Immunomodulatory nonstructural proteins of influenza a viruses. Trends Microbiol. 2018;26(7):624–636. - PubMed
-
- Dave K, Lee PC. Global geographical and temporal patterns of seasonal influenza and associated climatic factors. Epidemiol Rev. 2019;41(1):51–68. - PubMed
-
- Pavia A. One hundred years after the 1918 pandemic: new concepts for preparing for influenza pandemics. Curr Opin Infect Dis. 2019;32(4):365–371. - PubMed
Publication types
MeSH terms
Substances
LinkOut - more resources
Full Text Sources
Other Literature Sources
Research Materials
Miscellaneous