. 2023 Jan;164(2):226-241.
doi: 10.1111/jnc.15714. Epub 2022 Nov 11.

Neurochemical correlates of synapse density in a Huntington's disease mouse model

Affiliations

Neurochemical correlates of synapse density in a Huntington's disease mouse model

Nicole Zarate et al. J Neurochem. 2023 Jan.

Abstract

Striatal medium spiny neurons are highly susceptible in Huntington's disease (HD), resulting in progressive synaptic perturbations that lead to neuronal dysfunction and death. Non-invasive imaging techniques, such as proton magnetic resonance spectroscopy (1 H-MRS), are used in HD mouse models and patients with HD to monitor neurochemical changes associated with neuronal health. However, the association between brain neurochemical alterations and synaptic dysregulation remains unknown, limiting our ability to monitor potential treatments that may affect synapse function. We conducted in vivo longitudinal 1 H-MRS in the striatum followed by ex vivo analyses of excitatory synapse density of two synaptic circuits disrupted in HD, thalamo-striatal (T-S), and cortico-striatal (C-S) pathways, to assess the relationship between neurochemical alterations and changes in synapse density. We used the zQ175(Tg/0) HD mouse model as well as zQ175 mice lacking one allele of CK2α'(zQ175(Tg/0) :CK2α'(+/-) ), a kinase previously shown to regulate synapse function in HD. Longitudinal analyses of excitatory synapse density showed early and sustained reduction in T-S synapses in zQ175 mice, preceding C-S synapse depletion, which was rescued in zQ175:CK2α'(+/-) . Changes in T-S and C-S synapses were accompanied by progressive alterations in numerous neurochemicals between WT and HD mice. Linear regression analyses showed C-S synapse number positively correlated with 1 H-MRS-measured levels of GABA, while T-S synapse number positively correlated with levels of phosphoethanolamine and negatively correlated with total creatine levels. These associations suggest that these neurochemical concentrations measured by 1 H-MRS may facilitate monitoring circuit-specific synaptic dysfunction in the zQ175 mouse model and in other HD pre-clinical studies.

Keywords: 1H-MRS; CK2 alpha prime; Huntington's disease; neurochemicals; synapse density; zQ175.


Conflict of interest statement

Dr. Öz consults for IXICO Technologies Limited and uniQure biopharma B.V., serves on the Scientific Advisory Board of BrainSpec Inc. and receives research support from Biogen.

Figures
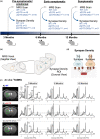
FIGURE 1
FIGURE 1
Diagram of experimental design and timeline. (a) Genotypes and number of animals used for each analysis are annotated. A cohort of WT, zQ175 and zQ175:CK2α’(+/−) mice were scanned longitudinally on a 9.4 T magnet (MRS) and a subset of mice were killed for synapse density analyses by immunohistochemistry at each time point. (b) Diagrams indicate the brain region covered by MRS and synapse analysis. Yellow box indicates voxel range (Volume = 8.2 μl), blue box indicates synapse density ROI within the voxel range. Synapse density was analyzed as described in the Methods and Materials section by conducting PSD‐95 and VGlut1 or VGlut2 co‐localization analyses from at least n = 6–9 images corresponding to n = 3 coronal sections. Graphics were created with Biorender.com (c) Localized proton MR spectra measured from the mouse dorsolateral striatum in WT, zQ175(Tg/0) and zQ175(Tg/0):CK2α’(+/−) mice at 3, 6, and 12 months old. The volume of interest is shown on T2‐weighted images and alterations in neurochemicals visible in the spectra are shown.
FIGURE 2
FIGURE 2
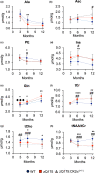
Age and genotype‐dependent neurochemical alterations in the mouse dorsolateral striatum. Longitudinal metabolite profile in WT, zQ175, and zQ175:CK2α’(+/−) mice. Only neurochemicals that showed significant differences between genotypes are shown (see Table 1). Error bars represent mean ± SD. One‐way ANOVA with Tukey's post hoc test. *p < 0.05 WT versus zQ175, #p < 0.05 WT versus zQ175:CK2α’(+/−), ♦p < 0.05 zQ175 versus zQ175:CK2α’(+/−). Abbreviations can be found in the methods section. For 3‐month WT n = 13, zQ175 n = 16, zQ175:CK2α’(+/−) n = 16. 6‐month WT n = 9, zQ175 n = 12, zQ175:CK2α’(+/−) n = 13. 12‐month WT n = 5, zQ175 n = 8, zQ175:CK2α’(+/−) n = 7.
FIGURE 3
FIGURE 3
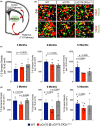
Onset of thalamo‐striatal (T‐S) synapse loss precedes cortico‐striatal synapse deficits in zQ175 mice and it is delayed in zQ175:CK2α’(+/−) mice. (a) Diagram of the striatal excitatory circuitry. (b) Colocalization (white arrows) of pre‐synaptic (VGlut1/2) and post‐synaptic (PSD‐95) markers in WT, zQ175, and zQ175:CK2α’(+/−) mice. Representative images from 6 months, total area analyzed was 15.42 mm2. Scale bar: 5 μm. (c, d) Quantification of raw C‐S and T‐S synapse density number, respectively, at 3, 6, and 12 months old between genotypes. At each time point, WT n = 3–6, zQ175 n = 3–8, zQ175:CK2α’(+/−) n = 3–4. Data points represent biological replicates. Statistics were calculated using n = 6–9 images per animal. Error bars represent mean ± SD. *p < 0.05, **p < 0.01, ***p < 0.001, ****p < 0.0001, one‐way ANOVA with Tukey's post hoc test.
FIGURE 4
FIGURE 4
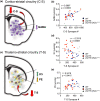
Selective neurochemical alterations differentially correlate with striatal synaptic circuits. (a) Illustration of C‐S correlation with metabolites (GABA). (b) Correlation analysis of C‐S synapse density versus GABA where raw synapse numbers are plotted against corresponding neurochemical levels. (c) Illustration T‐S correlation with metabolites (tCr and PE). (d, e) Correlation analysis of neurochemicals versus T‐S synapse density. r value represents Pearson's correlation. Data from WT n = 12, zQ175 n = 15, zQ175:CK2α’(+/−) n = 9 corresponding to all three time points (3, 6 and 12 months) is shown.

References

    1. Adanyeguh, I. M. , Monin, M.‐L. , Rinaldi, D. , Freeman, L. , Durr, A. , Lehéricy, S. , Henry, P.‐G. , & Mochel, F. (2018). Expanded neurochemical profile in the early stage of Huntington disease using proton magnetic resonance spectroscopy. NMR Biomed, 31. 10.1002/nbm.3880 - DOI - PMC - PubMed
    1. Agarwal, S. , Schaefer, M. L. , Krall, C. , & Johns, R. A. (2022). Isoflurane disrupts postsynaptic density‐95 protein interactions causing neuronal synapse loss and cognitive impairment in juvenile mice via canonical NO‐mediated protein Kinase‐G signaling. Anesthesiology, 137, 212–231. - PMC - PubMed
    1. Behrens, P. F. , Franz, P. , Woodman, B. , Lindenberg, K. S. , & Landwehrmeyer, G. B. (2002). Impaired glutamate transport and glutamate–glutamine cycling: downstream effects of the Huntington mutation. Brain, 125, 1908–1922. - PubMed
    1. Cepeda, C. , Wu, N. , André, V. M. , Cummings, D. M. , & Levine, M. S. (2007). The corticostriatal pathway in Huntington's disease. Progress in Neurobiology, 81, 253–271. - PMC - PubMed
    1. Deng, Y. P. , Wong, T. , Wan, J. Y. , & Reiner, A. (2014). Differential loss of thalamostriatal and corticostriatal input to striatal projection neuron types prior to overt motor symptoms in the Q140 knock‐in mouse model of Huntington's disease. Frontiers in Systems Neuroscience, 8, 198. - PMC - PubMed

Publication types