. 2022 Nov 10;185(23):4448-4464.e17.
doi: 10.1016/j.cell.2022.09.035. Epub 2022 Oct 21.

Spatially resolved epigenomic profiling of single cells in complex tissues

Affiliations

Spatially resolved epigenomic profiling of single cells in complex tissues

Tian Lu et al. Cell. .

Erratum in

Abstract

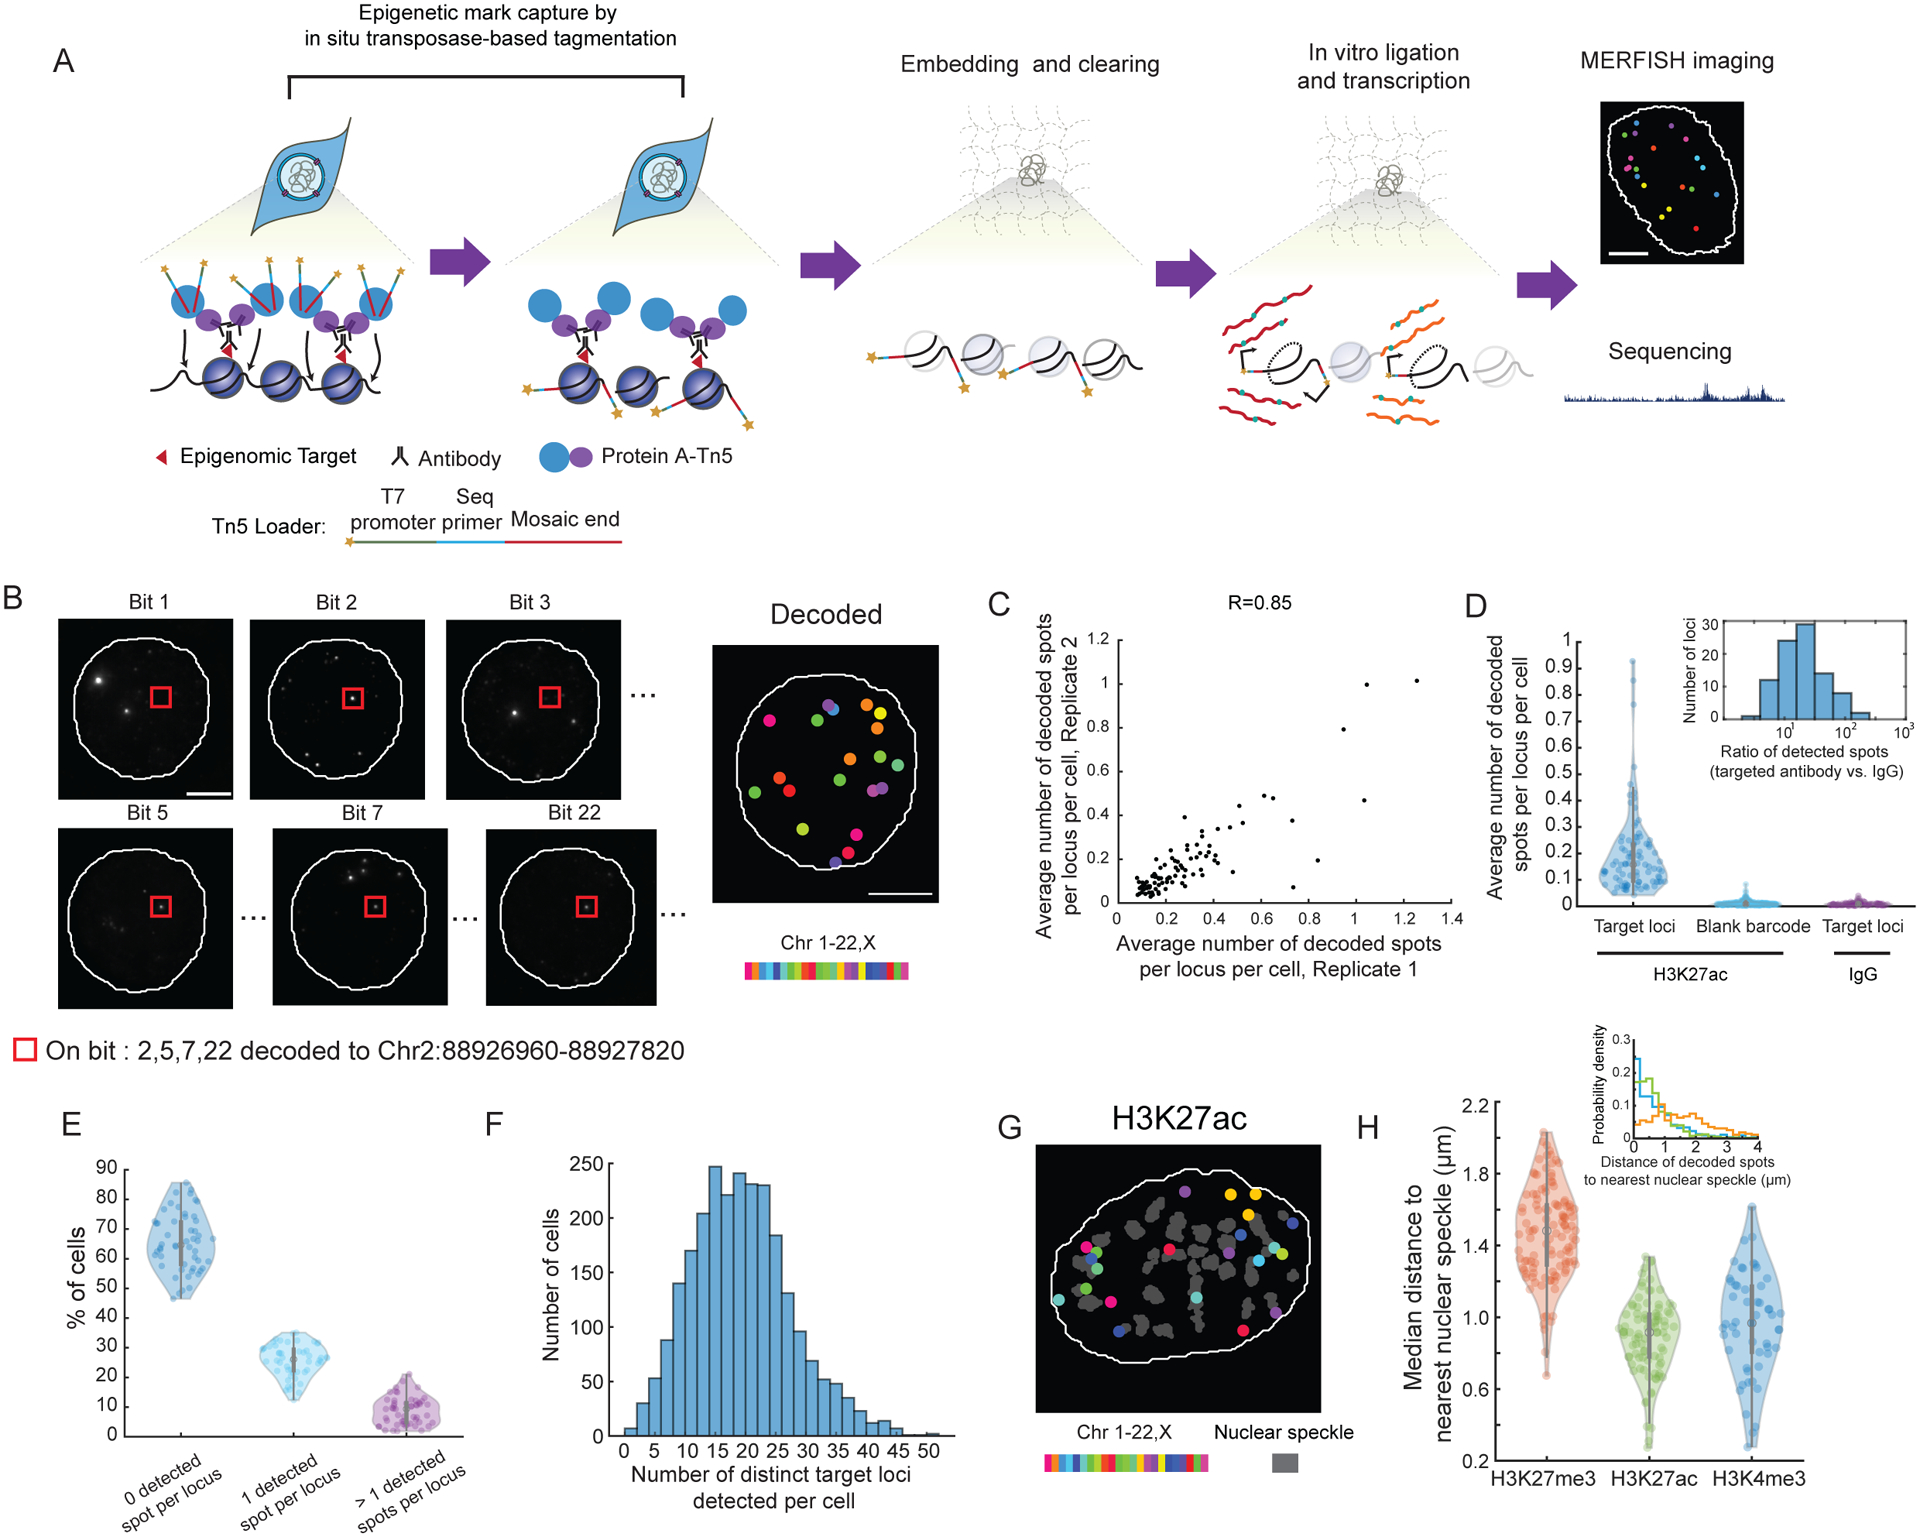
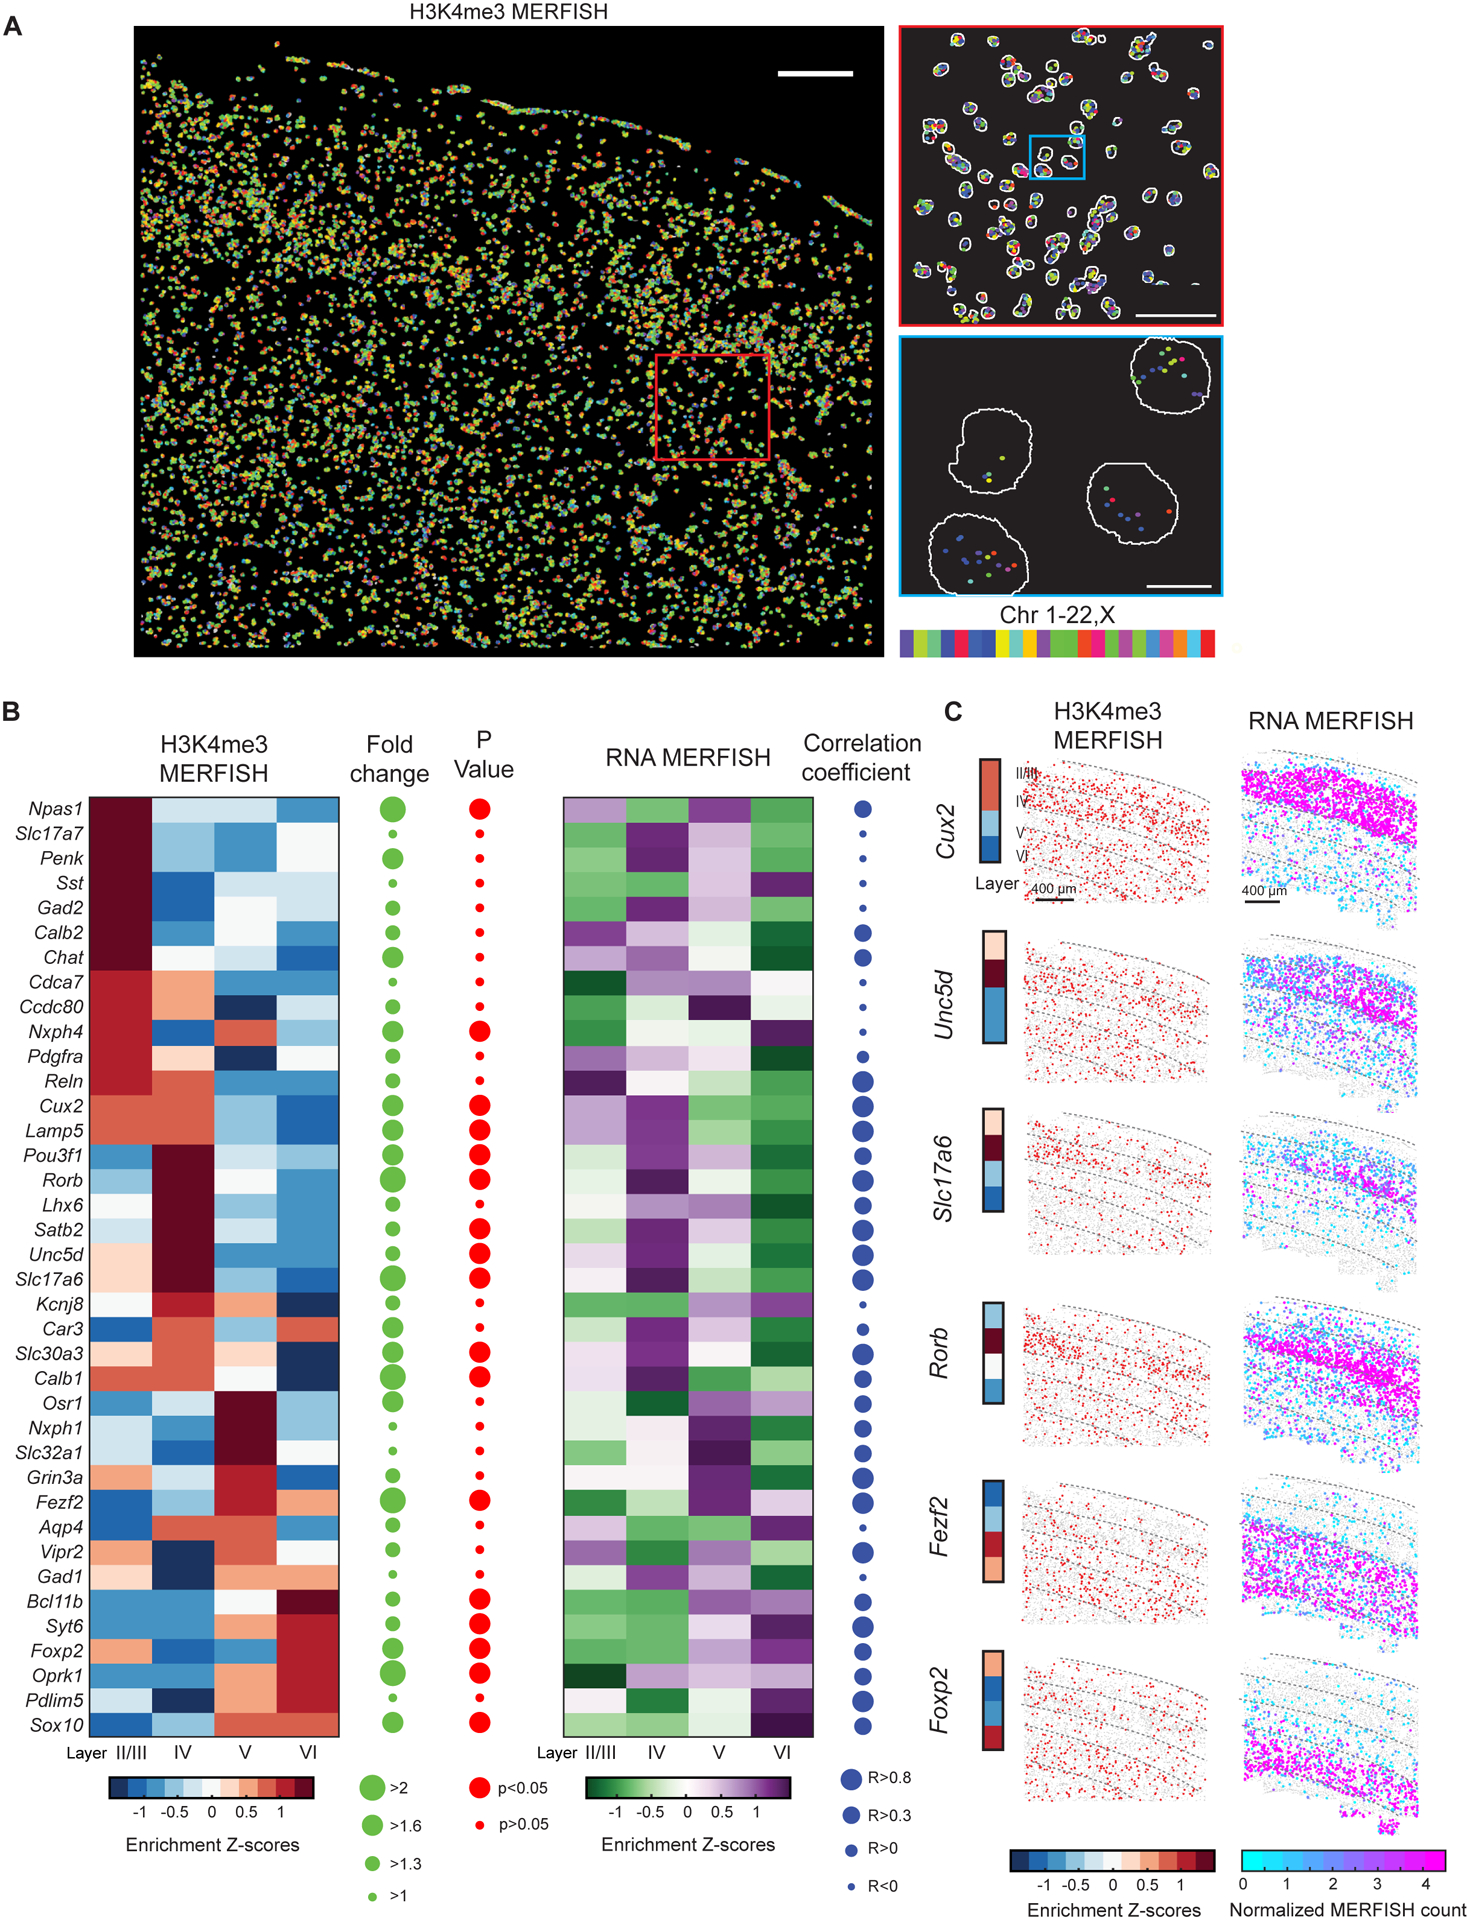
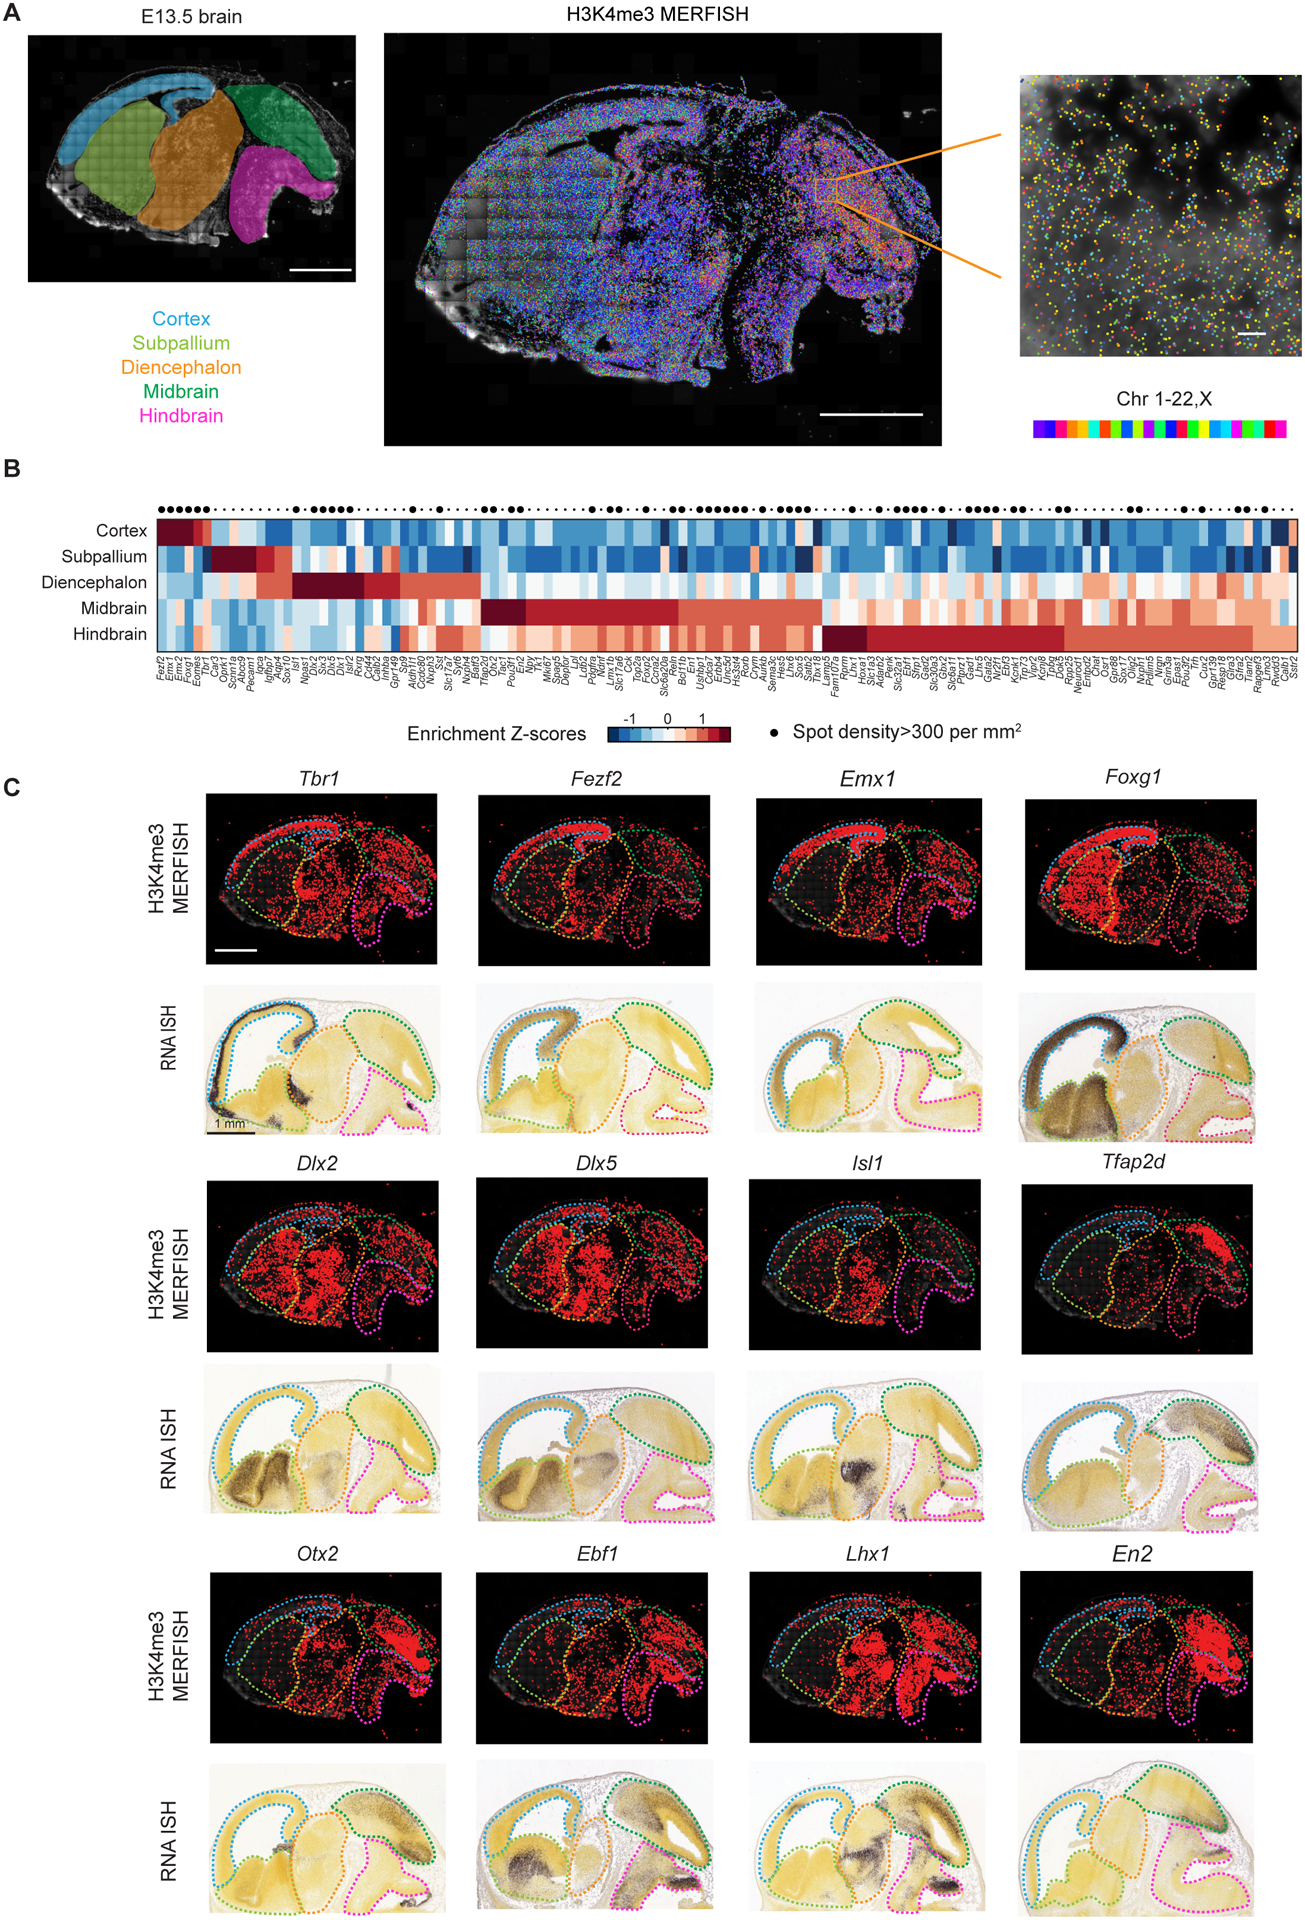
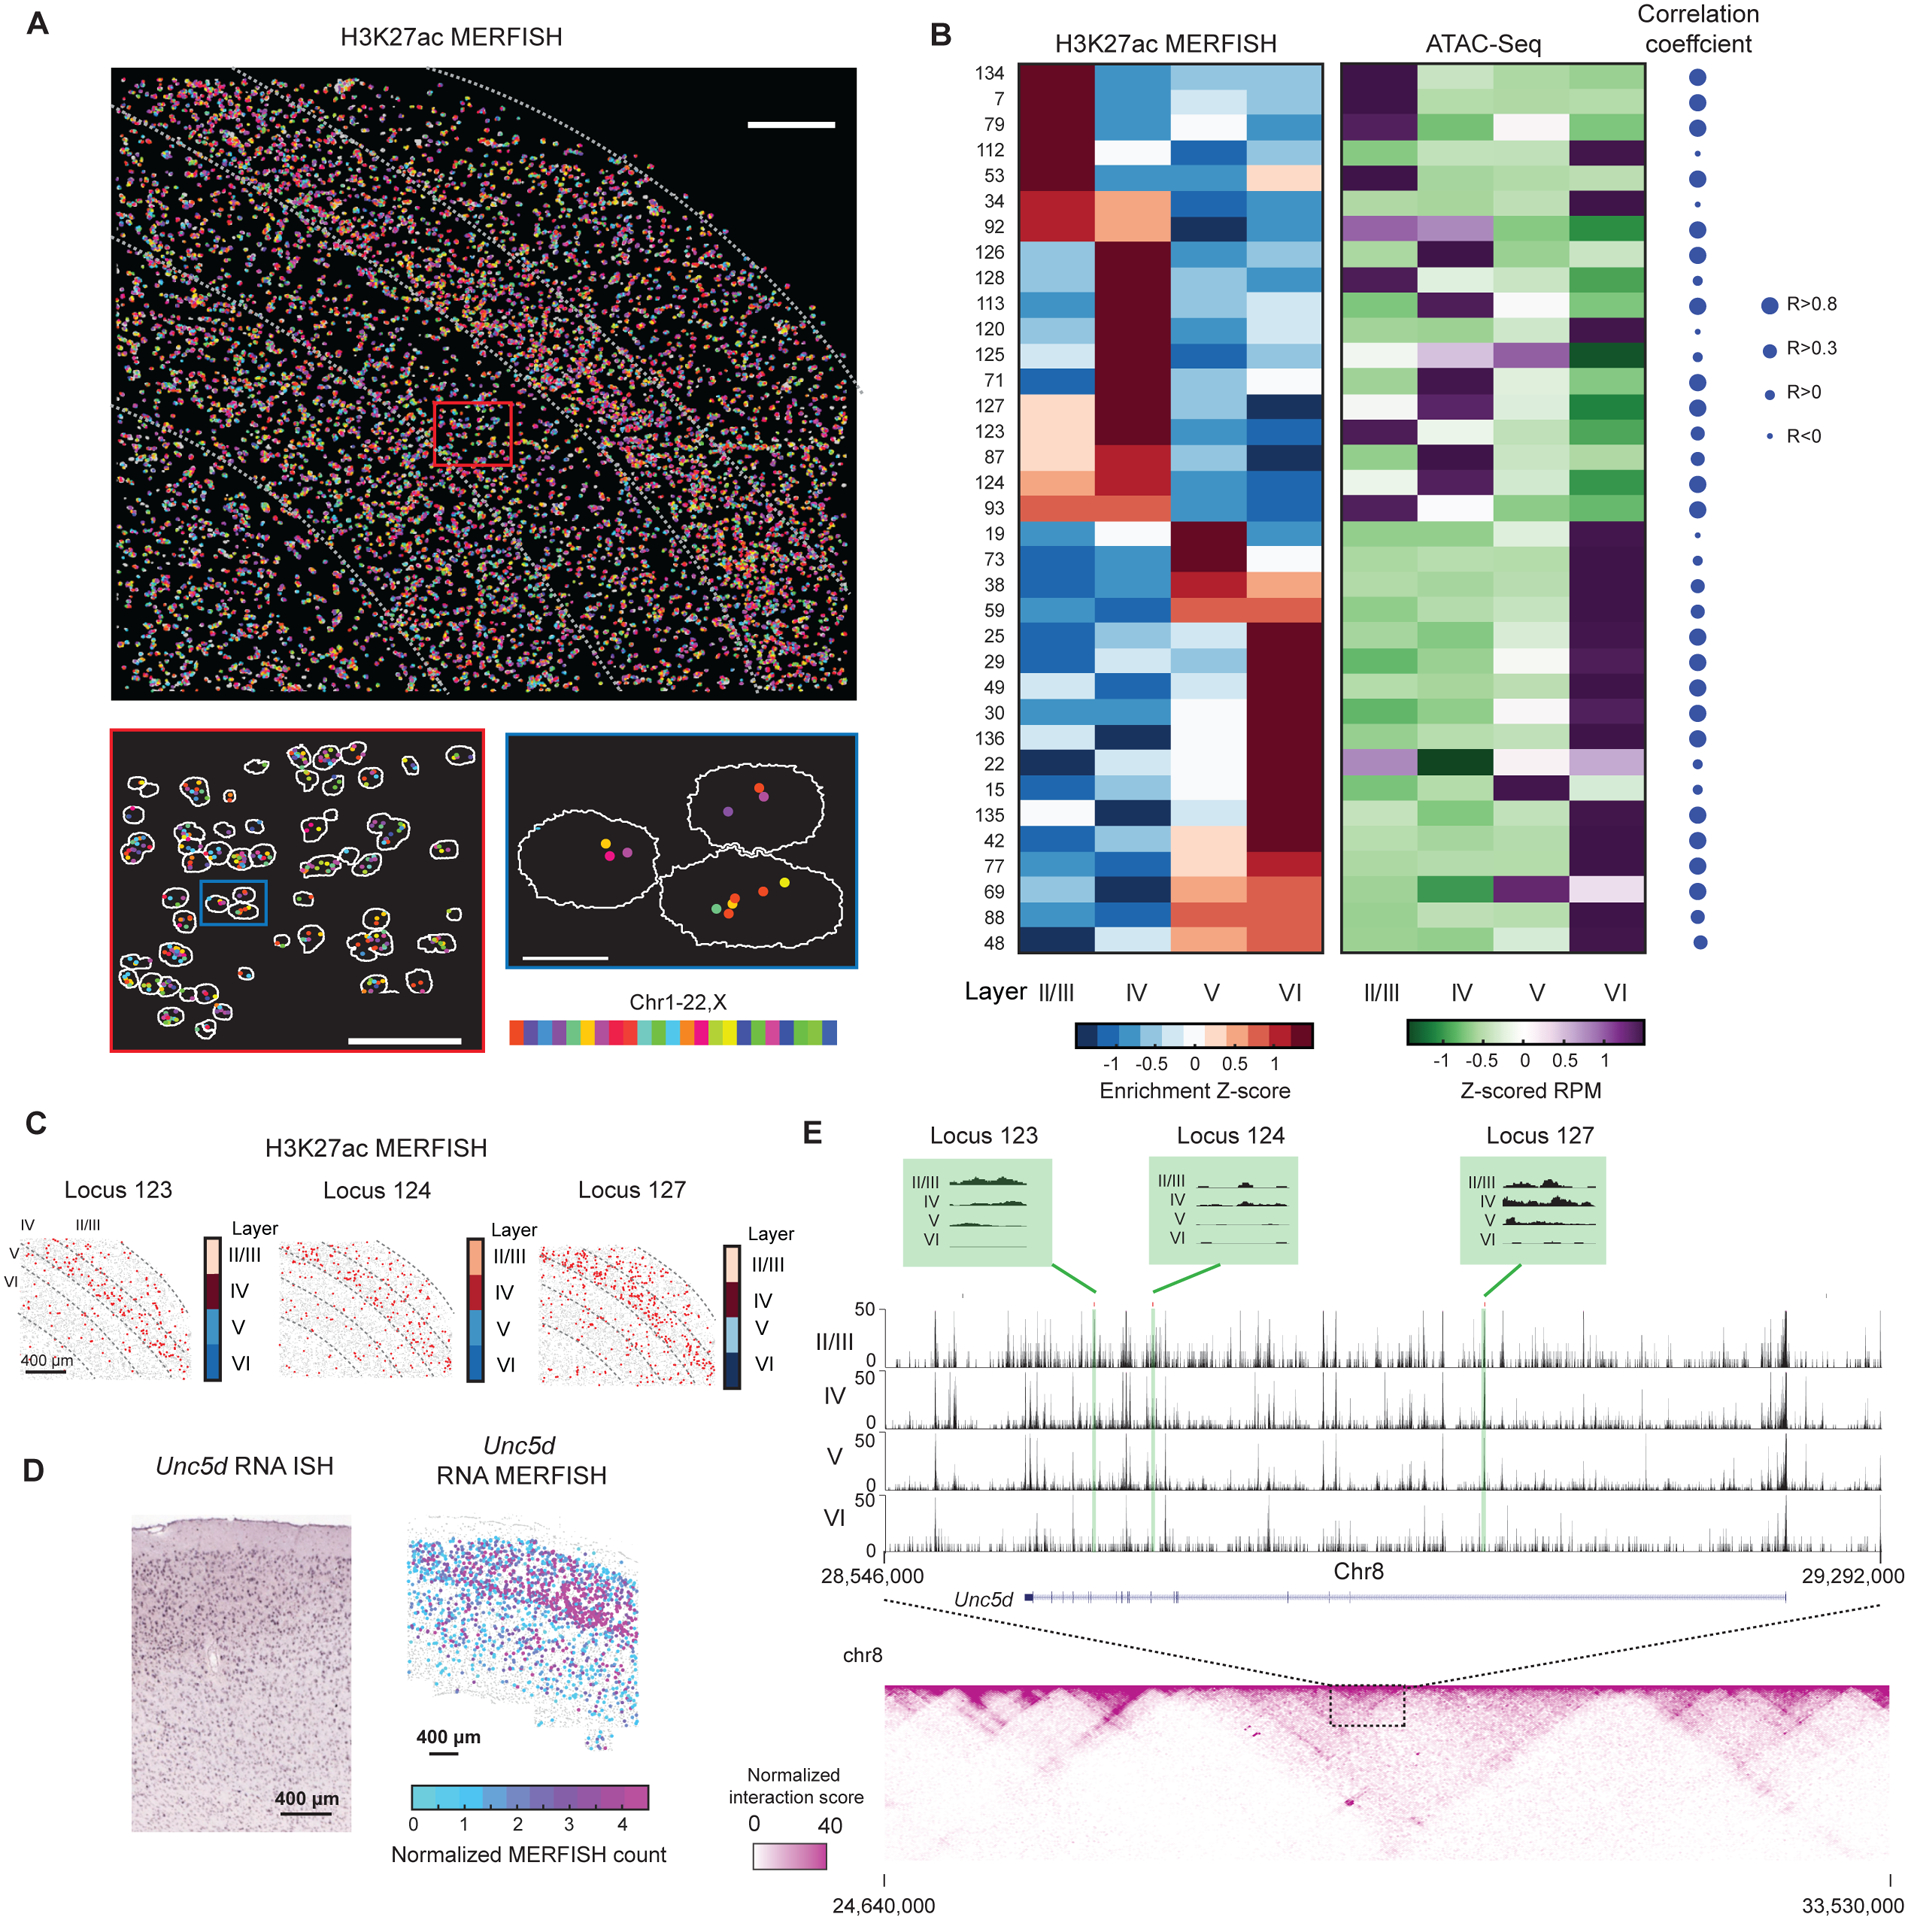
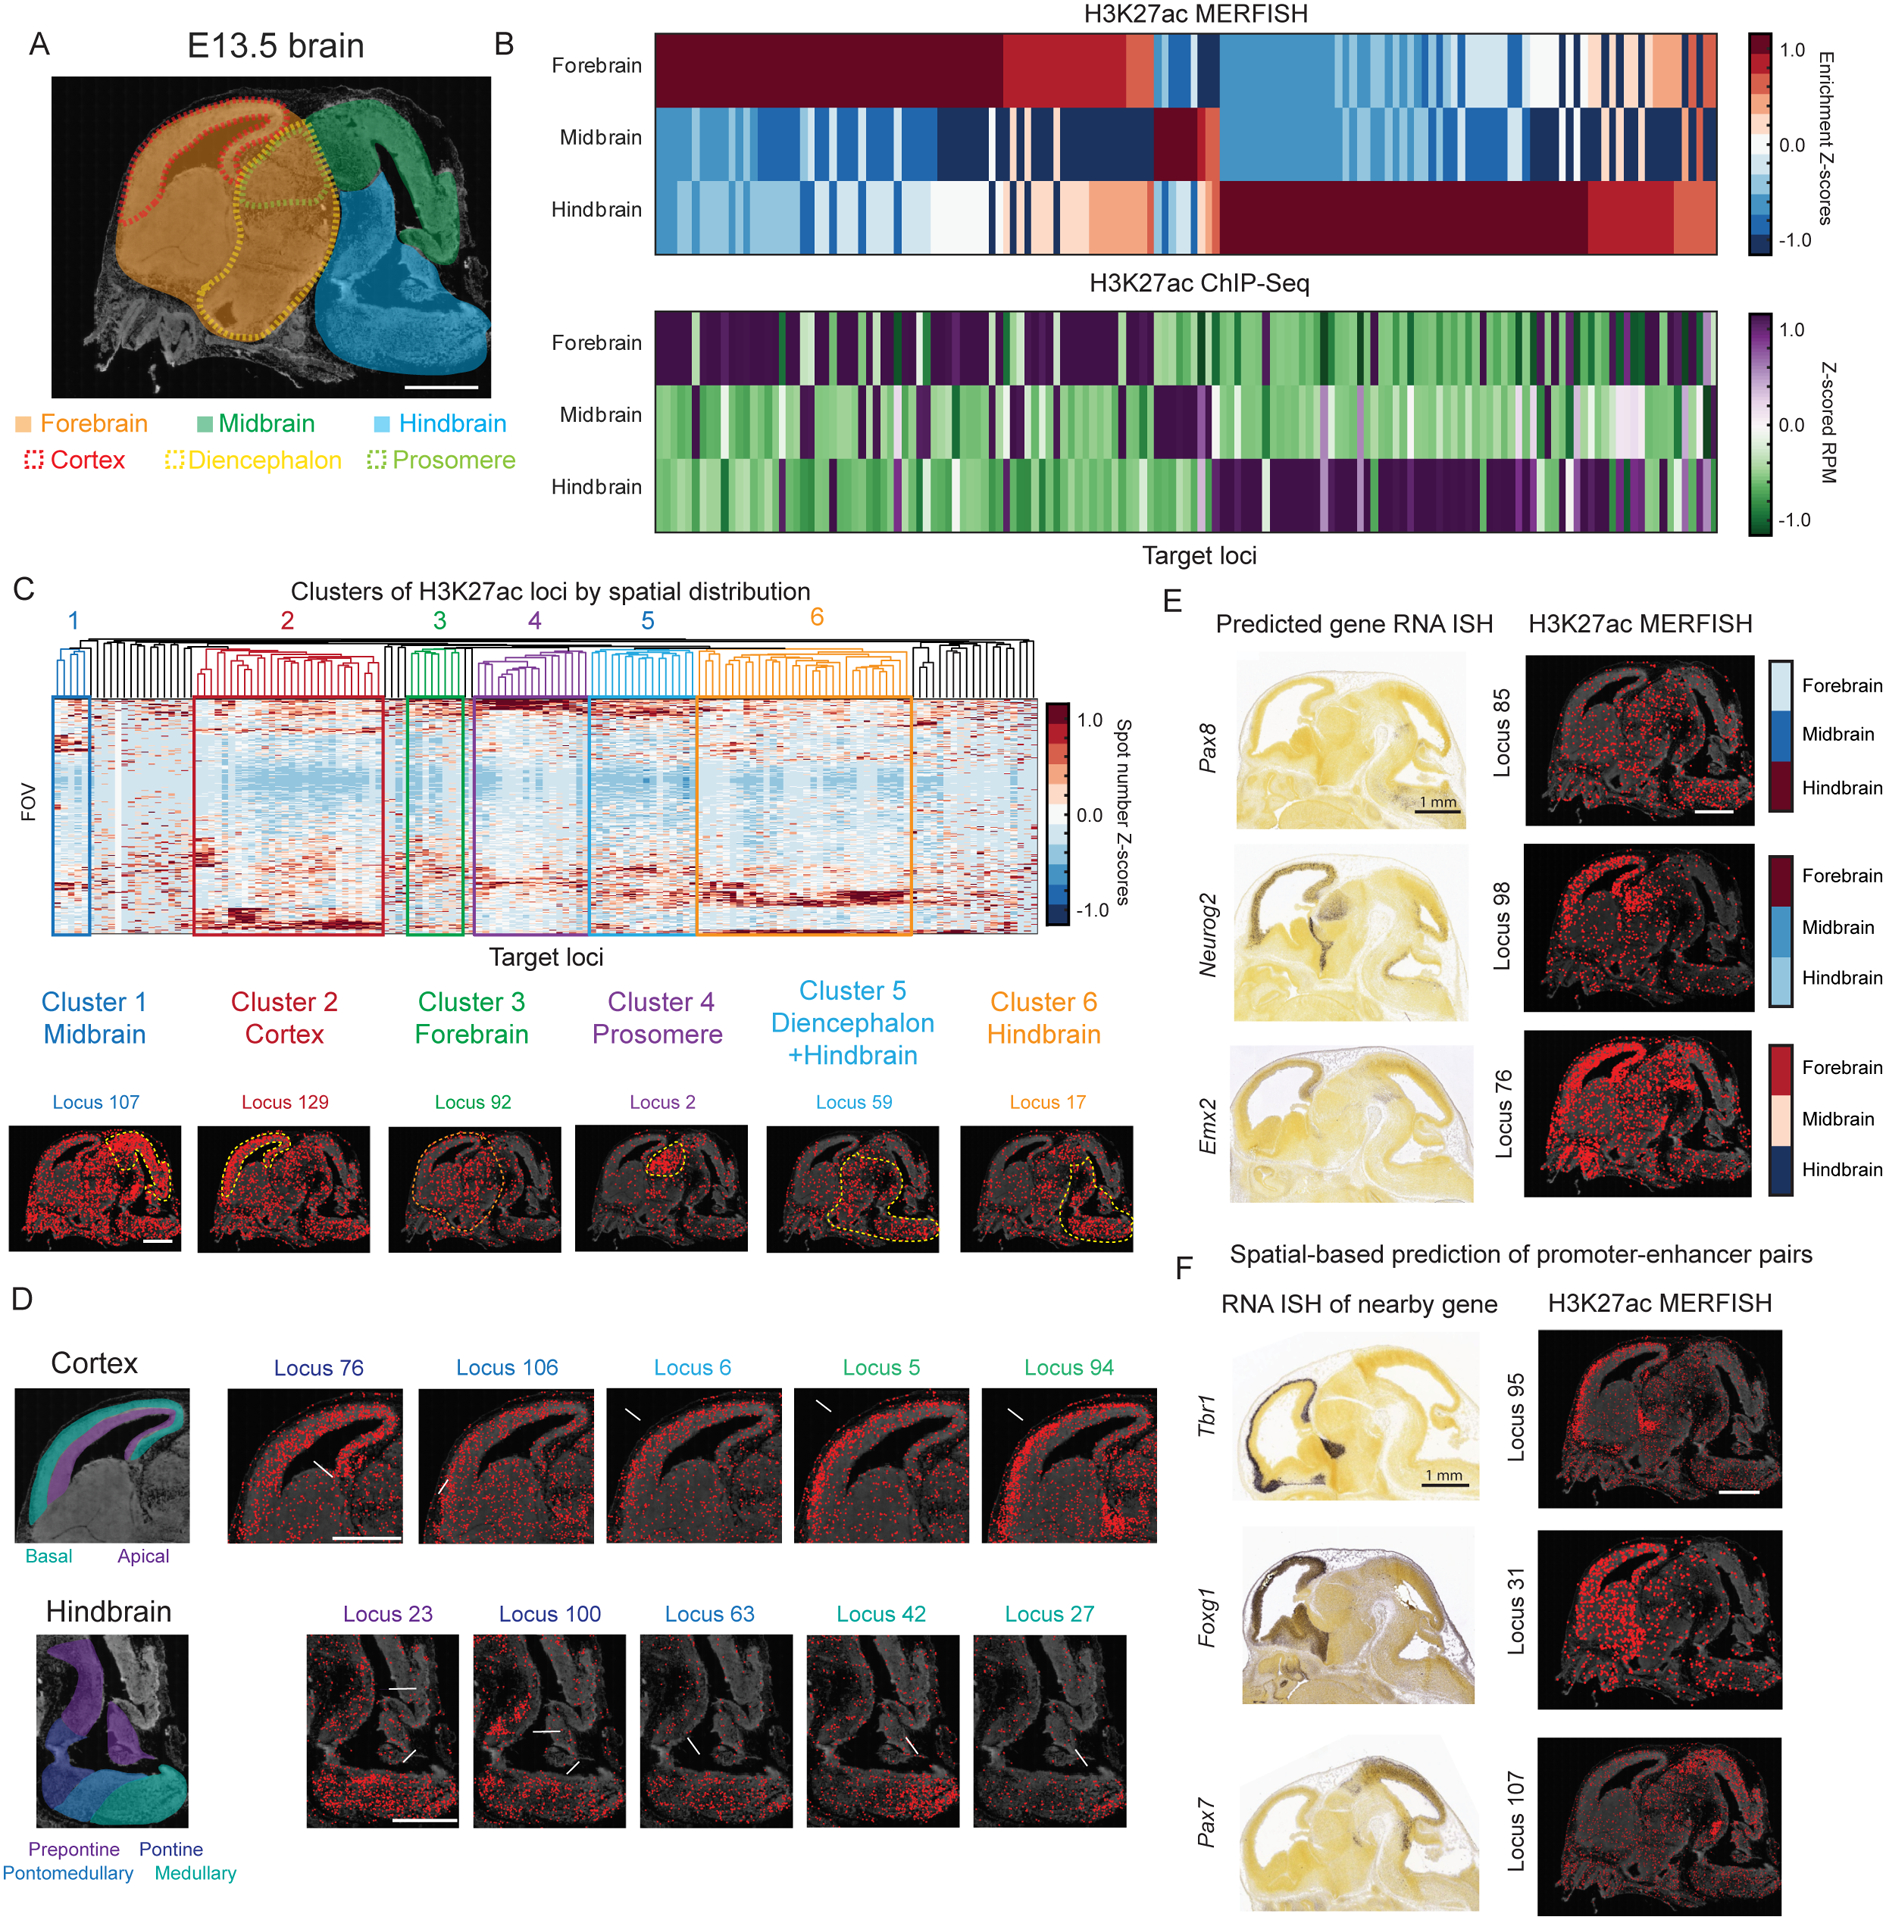
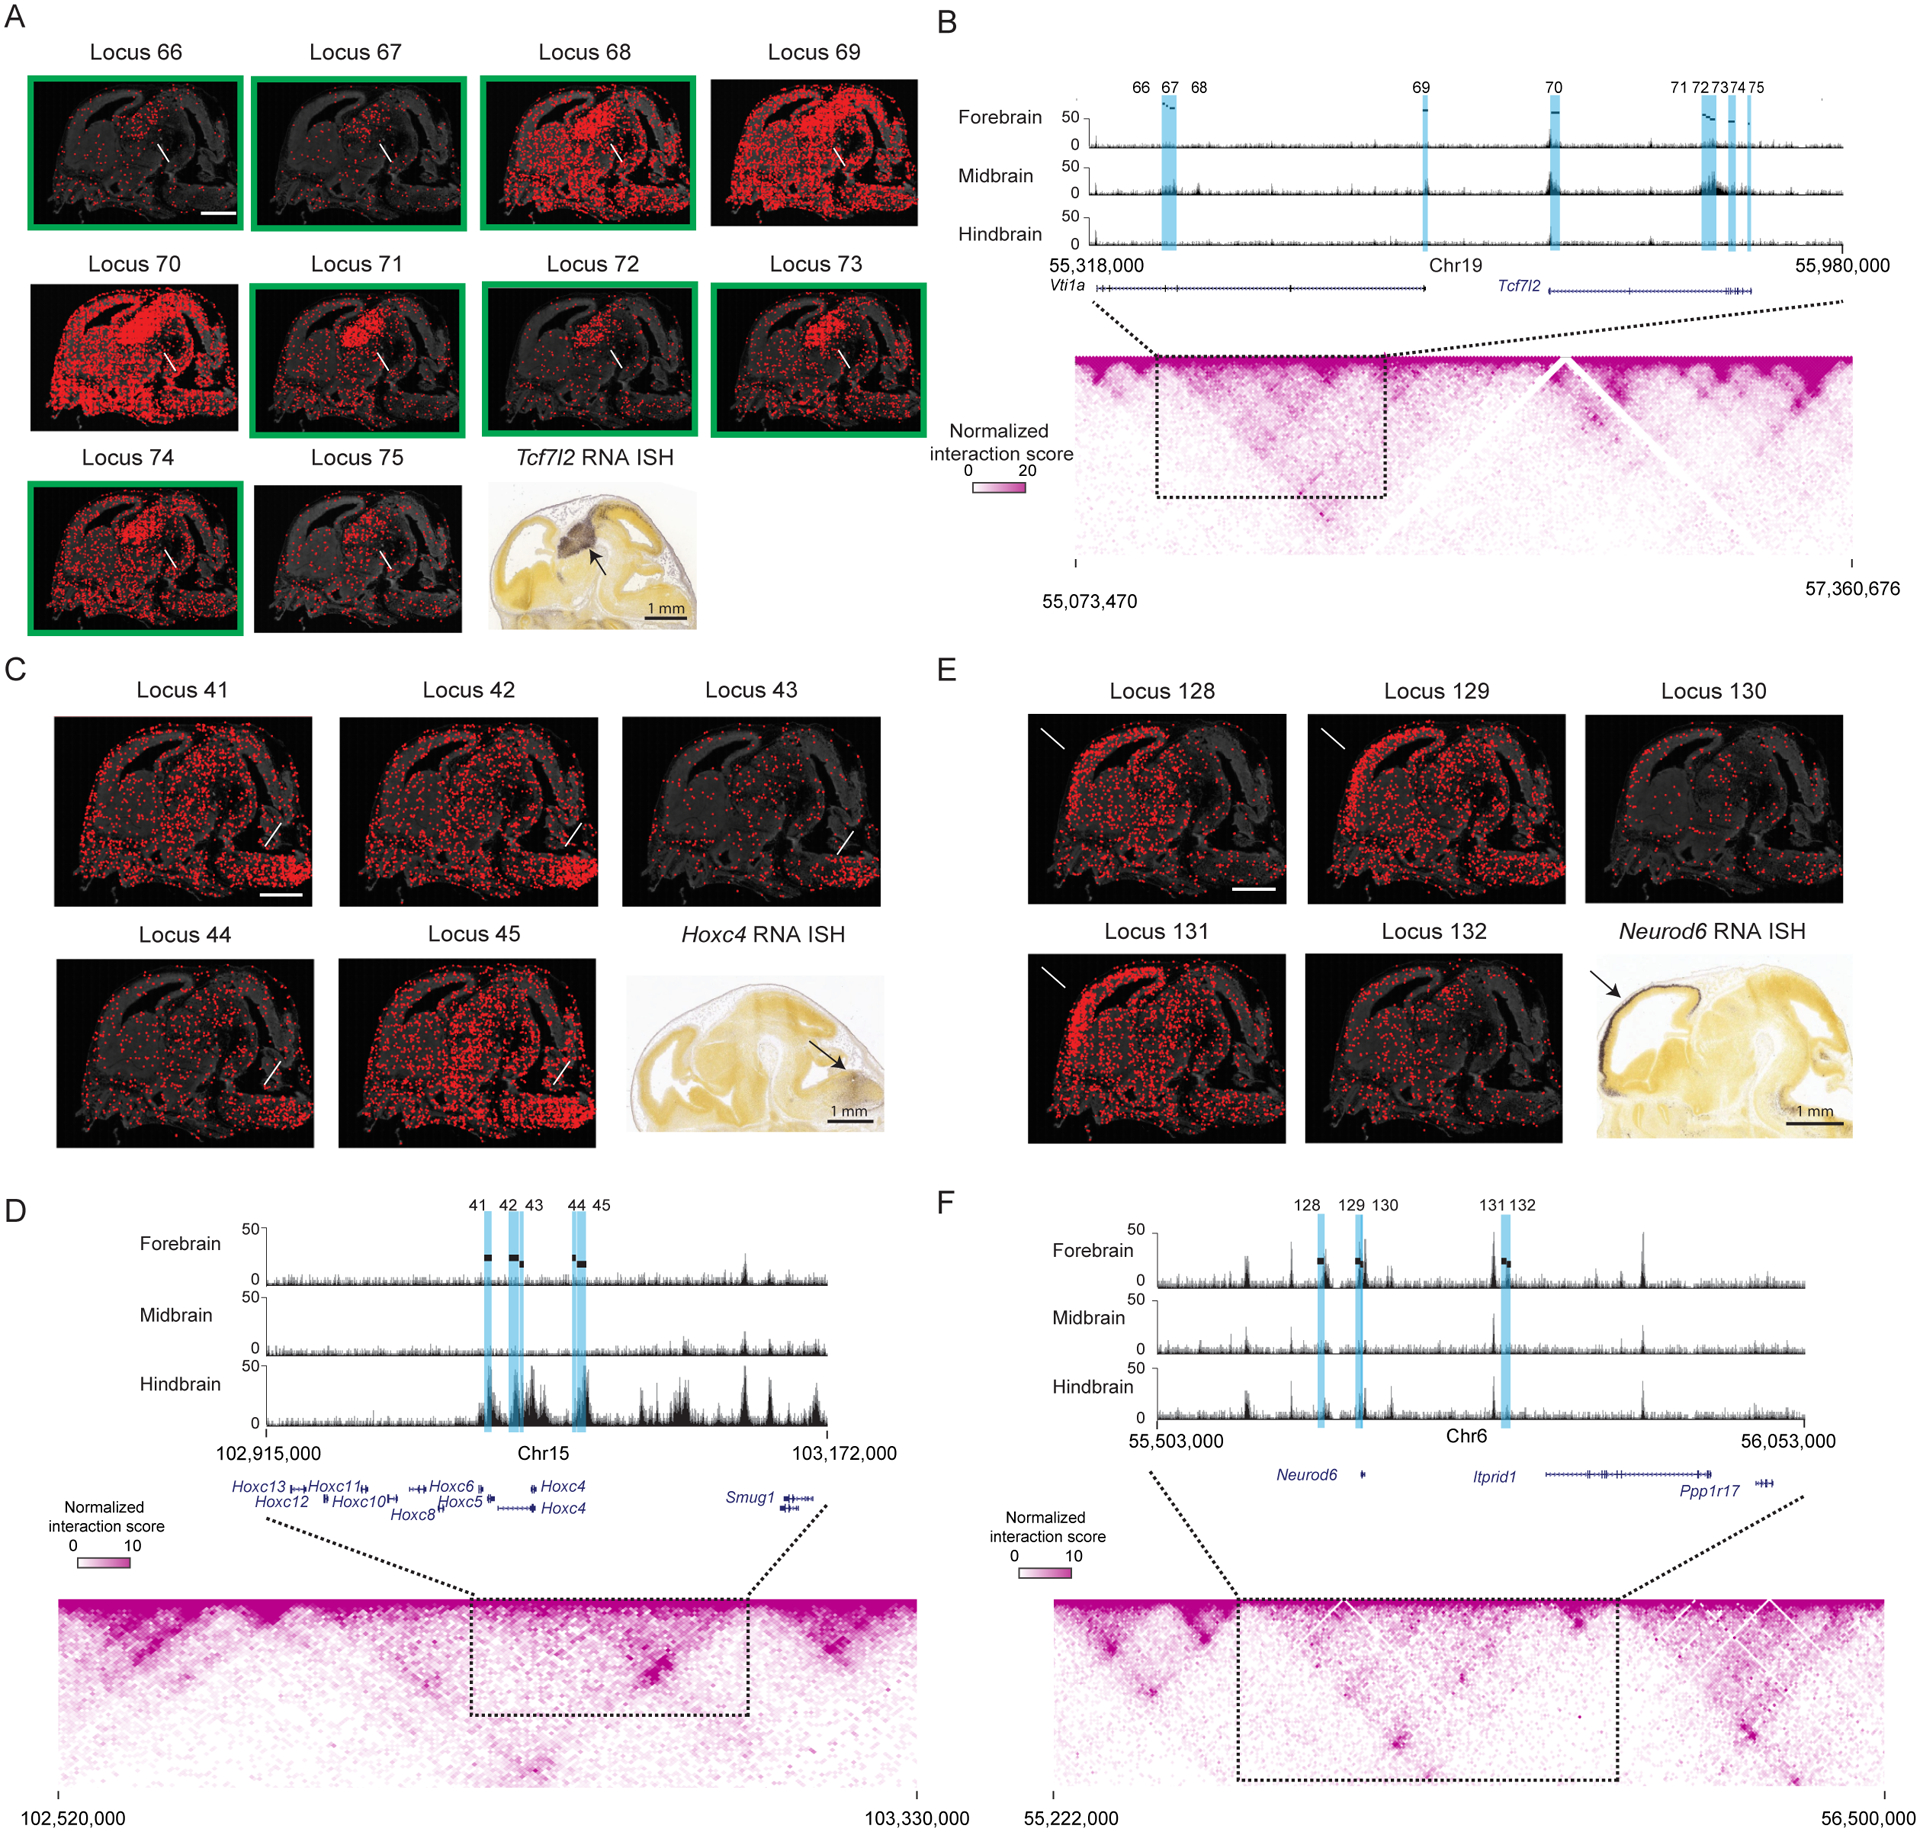
The recent development of spatial omics methods has enabled single-cell profiling of the transcriptome and 3D genome organization with high spatial resolution. Expanding the repertoire of spatial omics tools, a spatially resolved single-cell epigenomics method will accelerate understanding of the spatial regulation of cell and tissue functions. Here, we report a method for spatially resolved epigenomic profiling of single cells using in situ tagmentation and transcription followed by multiplexed imaging. We demonstrated the ability to profile histone modifications marking active promoters, putative enhancers, and silent promoters in individual cells, and generated high-resolution spatial atlas of hundreds of active promoters and putative enhancers in embryonic and adult mouse brains. Our results suggested putative promoter-enhancer pairs and enhancer hubs regulating developmentally important genes. We envision this approach will be generally applicable to spatial profiling of epigenetic modifications and DNA-binding proteins, advancing our understanding of how gene expression is spatiotemporally regulated by the epigenome.

Keywords: MERFISH; brain; development; enhancer; enhancer hub; enhancer-promoter interaction; epigenomic MERFISH; promoter; single-cell epigenomics; spatial epigenomic.


Conflict of interest statement

Declaration of interests X.Z. is an inventor of patents applied for by Harvard University related to MERFISH, a co-founder and consultant of Vizgen, Inc, and a member of the Cell advisory board.

Figures

Figure 1.
Figure 1.. Spatially resolved single-cell profiling of epigenetic modifications by epigenomic MERFISH
(A) Schematic of epigenomic MERFISH. Cells were treated with primary antibodies recognizing the epigenetic modifications of interest, secondary antibodies, and protein A coupled transposase (PA-Tn5) to generate DNA fragments tagged with T7 promoter and sequencing primers. The sample was embedded into polyacrylamide gel and cleared, with the tagged DNA crosslinked to the gel. The tagged DNA fragments were then transcribed into RNAs by T7 polymerase. The resulting RNA was either detected by MERFISH imaging or subjected to sequencing. Scale bar: 5 μm. (B) Epigenomic MERFISH image of 90 target H3K27ac loci in a single cell. The images from individual bits are shown on the left. The decoded image is shown on the right, with individual spots color-coded based on the chromosomal identities of the loci. Scale bars: 5 μm. (C) Correlation between two biological replicates of H3K27ac imaging. Each dot corresponds a single H3K27ac locus. The Pearson correlation coefficients are 0.85 between replicates 1 and 2, 0.71 between replicates 1 and 3, and 0.75 between replicates 2 and 3. (D) Violin plots showing the average number of decoded spots per cell for each target H3K27ac locus (left) and each blank barcode (middle) when H3K27ac antibody is used to capture the epigenetic mark, as well as the average number of decoded spots per cell for each target H3K27ac locus when a control IgG is used instead (right). Each dot corresponds to a single H3K27ac locus or a blank barcode. Inset: Histogram of the ratio between the number of decoded spots per cell detected with H3K27ac antibody and that detected with IgG for individual H3K27ac loci. Results here are aggregates of three replicates. (E) Violin plots showing the percentage of cells with 0, 1, or >1 detected spots for individual target H3K4me3 loci corresponding to the promoters of 52 essential genes. Each dot corresponds to a single H3K4me3 locus. For a given locus, ~35% (median percentage across 52 loci) of cells showed at least one detected spot. Results here are aggregates of three replicates. (F) Histogram of the number of distinct H3K4me3 loci detected per cell. The median number of distinct loci detected per cell is 18, which is ~35% of the 52 total target loci. Results here are aggregates of three replicates. (G) Decoded epigenomic MERFISH image of 90 target H3K27ac loci and nuclear speckles in a single cell. Individual colored spots correspond to detected H3K27ac loci color-coded based on the chromosomal identities of the loci. Grey shapes correspond to the segmented boundaries of nuclear speckles. Scale bar: 5 μm. (H) Violin plots showing the median distances (across all imaged cells) between the detected H3K4me3, H3K27ac and H3K27me3 loci and the nearest nuclear speckles. Each dot corresponds to a single locus. Inset: Histograms of the spatial distances of three example H3K4me3 (blue), H3K27ac (green) and H3K27me3 (red) loci to the nearest nuclear speckles in individual cells. See also Figure S1.
Figure 2.
Figure 2.. Spatially resolved single-cell profiling of layer-specific active promoters in adult mouse cortex
(A) Left: Epigenomic MERFISH image of 127 target H3K4me3 loci in the somatosensory cortex region of a coronal slice of an adult mouse brain. Scale bar: 200 μm. Top right: A magnified view of the red-boxed region from the left panel. Scale bar: 75 μm. Bottom right: A magnified view of the blue-boxed region from the top right panel. Segmentation of individual nuclei are shown in white and decoded spots are color-coded by the chromosomal identities of the loci. Scale bar: 10 μm. (B) Left: Layer enrichment z-scores for the promoter H3K4me3 signals measured by epigenomic MERFISH for the indicated genes. For each promoter locus, the enrichment in a specific layer is calculated as the z-score of the fraction of cells in the layer that is H3K4me3-positive for this locus. The fold change in the fraction of H3K4me3-positive cells between the layers with the maximum and minimum enrichment (green) and the statistical significance (p-value) of the layer-specific enrichment (red) are shown on the right. Results from replicate 1 is shown here and comparison between replicates 1 and 2 is shown in Figure S3A. Right: Layer enrichment z-scores for the RNA expression level measured by RNA MERFISH for the indicated genes (Zhang et al., 2021). For each gene, the enrichment in a specific layer is calculated as the z-score of the fraction of cells in the layer that express this gene. The Pearson correlation coefficient of layer enrichment between the epigenomic MERFISH and RNA MERFISH data is shown on the right. (C) Left: Epigenomic MERFISH images showing layer enrichment of H3K4me3 signals for the promoters of six indicated genes. Each dot in the images represent a cell and red dots represent cells with positive H3K4me3 signals. The layer enrichment heatmap on the left is reproduced from panel (B). Right: RNA MERFISH images showing the RNA expression levels for the six indicated genes in individual cells, with each cell presented as a dot. Normalized MERFISH counts is defined as RNA counts per cell divided by the imaged volume of each cell (Zhang et al., 2021). Scale bars: 400 μm. See also Figures S2 and S3.
Figure 3.
Figure 3.. Spatially resolved profiling of active promoters in mouse embryonic brain
(A) Left: Schematic highlighting different brain regions, cortex, subpallium, diencephalon, midbrain, hindbrain, of an imaged sagittal slice of a E13.5 mouse brain. The background shows the DAPI signal. Scale bar: 1 mm. Middle. Epigenomic MERFISH image of 127 target H3K4me3 loci in the slice. Scale bar: 1 mm. Right: An enlarged region for orange box in the midbrain. Scale bar: 20 μm. All decoded spots are plotted on the background of the DAPI signal and are color-coded by the chromosomal identities of the loci. (B) The brain region enrichment z-scores for each of the 127 target H3K4me3 loci in different brain regions. The brain region is segmented based on the cytological hallmarks. The z-score of the decoded spot density (spot number / DAPI-positive area) in each region is shown. Top: Large dot indicating the loci that have a H3K4me3 spot density larger than 300 per mm2. (C) Epigenomic MERFISH images of the H3K4me3 signals of the promoters of twelve transcription factors shown in comparison with the Allen Brain RNA ISH images of the corresponding genes. Allen RNA ISH images here and in subsequent figures are taken from Allen Reference Atlas - Mouse Brain [brain atlas] available from atlas.brain-map.org (Lein et al, 2007). Scale bars: 1 mm. See also Figure S4.
Figure 4.
Figure 4.. Spatially resolved single-cell profiling of layer-specific putative active enhancers in adult mouse cortex
(A) Top: Epigenomic MERFISH image of 139 target H3K27ac loci in the somatosensory cortex region of a coronal slice of an adult mouse brain. Scale bar: 200 μm. Bottom left: A magnified view of the red-boxed region from the top panel. Scale bar: 75 μm. Bottom right: A magnified view of the blue-boxed region from the bottom left panel. Segmentation of individual nuclei are shown in white and decoded spots are color-coded by the chromosomal identities of the loci. Scale bar: 10 μm. (B) Left: Layer enrichment z-scores for the H3K27ac signal measured by epigenomic MERFISH for the indicated genomic loci. Layer enrichment z-score is calculated as described in Figure 2B. Results from replicate 1 is shown and results from replicate 2 are similar. Right: The corresponding z-scored reads per million (RPM) for each of target loci from published ATAC-seq data (Gray et al., 2017). The Pearson correlation coefficients between the layer enrichment derived from epigenomic MERFISH data and ATAC seq data are shown on the right. (C) Epigenomic MERFISH images of the H3K27ac signals for three example target loci showing enrichment in layers II/III and IV. Quantification of the layer enrichment are shown on the right (reproduced from Figure 4B). Scale bar: 400 μm. (D) The Allen RNA ISH image (left) and RNA MERFISH image (right) of the RNA expression level of the Unc5d gene. Scale bars: 400 μm. (E) Top: UCSC browser track of the ATAC-seq data (Gray et al., 2017) showing the location of the three target loci (loci 123, 124, 127) in the intronic regions of Unc5d. Regions marked in green are the three target loci with the green boxes above showing the enlarged version of the ATAC-seq track of the marked loci. Bottom: Hi-C map of a genomic region harboring these loci (Deng et al., 2015). See also Figure S5.
Figure 5.
Figure 5.. Spatially resolved profiling of putative active enhancers in mouse embryonic brain
(A) Top: Schematic highlighting different brain regions (forebrain, midbrain, and hindbrain in solid color shades and cortex, diencephalon and prosomere in dotted color lines) of an imaged sagittal slice of a E13.5 mouse brain. The background shows the DAPI signal. Scale bar: 1 mm. (B) Top: The brain region enrichment z-scores for the H3K27ac signal measured by epigenomic MERFISH for 142 target genomic loci. Brain region enrichment z-score is calculated as described in Figure 3B. Bottom: The corresponding z-scored reads per million for the target loci from published H3K27ac ChIP-seq data of the E13.5 brain (Gorkin et al., 2020). (C) Top: Hierarchical clustering of the 142 target genomic loci based on the measured spatial distributions of the H3K27ac signals of individual loci. The spatial distribution of each locus is presented as the number of H3K27ac spots in each imaged field-of-view (FOV: 0.04 mm2) for the locus with each FOV presented as a row. Six major clusters that contains >3 loci are shown, representing six different spatial patterns (enrichment in midbrain, cortex, forebrain, prosomere, diencephalon+hindbrain, and hindbrain). Bottom: Epigenomic MERFISH images of the H3K27ac signals of six representative loci, one for each cluster. Scale bar: 1 mm. (D) Epigenomic MERFISH images of two clusters of loci that show fine spatial distribution changes within the cortex and hindbrain. White arrows point to the region of the H3K27ac signal enrichment. Schematic shown on the left depict the regions of interest. Scale bars: 1 mm. (E) Comparison between the spatial distributions of H3K27ac signals of three putative enhancer loci measured by epigenomic MERFISH (right) and the expression patterns of the corresponding predicted genes from the Allen RNA ISH atlas (left). Quantifications of the region-specific enrichment of the H3K27ac signals are shown on the right (reproduced from Figure 5B). Scale bars: 1 mm. (F) Prediction of putative promoter-enhancer pairs using the H3K27ac epigenomic MERFISH data and the RNA expression pattern of the nearby genes. Epigenomic MERFISH of the H3K27ac signals of three target loci are shown on the right and Allen RNA ISH images of the corresponding nearby genes are shown on the left. Scale bars: 1 mm. See also Figure S6.
Figure 6.
Figure 6.. Putative active enhancer hubs for developmentally important genes in mouse embryonic brain
(A) Epigenomic MERFISH images of H3K27ac signals for 10 target loci in the prosomere cluster shown together with the Allen RNA ISH image of the nearby gene Tcf7l2 (bottom right). The white and black arrows respectively point to the prosomere region where the H3K27ac signals and RNA ISH signals are most enriched. Green box marking the loci that harbors a Tcf7l2 motif. Scale bars: 1 mm. (B) Top: H3K27ac ChIP-seq track (Gorkin et al., 2020) of a region corresponding to the sub-TAD that harbors the 10 target H3K27ac loci enriched in the prosomere and the Tcf7l2 gene. Bottom: Hi-C contact map (Deng et al., 2015) of a genomic region that includes the sub-TAD and flanking regions. (C) Epigenomic MERFISH images of H3K27ac signals of 5 target loci in the hindbrain cluster shown together with the Allen RNA ISH image of the nearby gene Hoxc4 (bottom right). Scale bars: 1 mm. (D) As in (B) but for the 5 target loci in the hindbrain cluster. (E) H3K27ac epigenomic MERFISH images of 5 target loci in the cortex cluster shown together with the Allen RNA ISH image of the nearby gene Neurod6 (bottom right). Scale bars: 1 mm. (F) As in (B) but for the 5 target loci in the cortex cluster.

Comment in

References

    1. Allis CD, and Jenuwein T (2016). The molecular hallmarks of epigenetic control. Nat. Rev. Genet 17, 487-500. 10.1038/nrg.2016.59. - DOI - PubMed
    1. Askary A, Sanchez-Guardado L, Linton JM, Chadly DM, Budde MW, Cai L, Lois C, and Elowitz MB (2020). In situ readout of DNA barcodes and single base edits facilitated by in vitro transcription. Nat. Biotechnol 38, 66-75. 10.1038/s41587-019-0299-4. - DOI - PMC - PubMed
    1. Bartlett DA, Dileep V, Handa T, Ohkawa Y, Kimura H, Henikoff S, and Gilbert DM (2021). High-throughput single-cell epigenomic profiling by targeted insertion of promoters (TIP-seq). J. Cell Biol 220: e202103078. 10.1083/jcb.202103078. - DOI - PMC - PubMed
    1. Bartosovic M, Kabbe M, and Castelo-Branco G (2021). Single-cell CUT&Tag profiles histone modifications and transcription factors in complex tissues. Nat. Biotechnol 39, 825-835. 10.1038/s41587-021-00869-9. - DOI - PMC - PubMed
    1. Buenrostro JD, Wu B, Litzenburger UM, Ruff D, Gonzales ML, Snyder MP, Chang HY, and Greenleaf WJ (2015). Single-cell chromatin accessibility reveals principles of regulatory variation. Nature 523, 486-490. 10.1038/nature14590. - DOI - PMC - PubMed

Publication types