. 2022 Nov 9;30(11):1540-1555.e15.
doi: 10.1016/j.chom.2022.10.003. Epub 2022 Oct 18.

Virological characteristics of the SARS-CoV-2 Omicron BA.2.75 variant

Affiliations

Virological characteristics of the SARS-CoV-2 Omicron BA.2.75 variant

Akatsuki Saito et al. Cell Host Microbe. .

Abstract

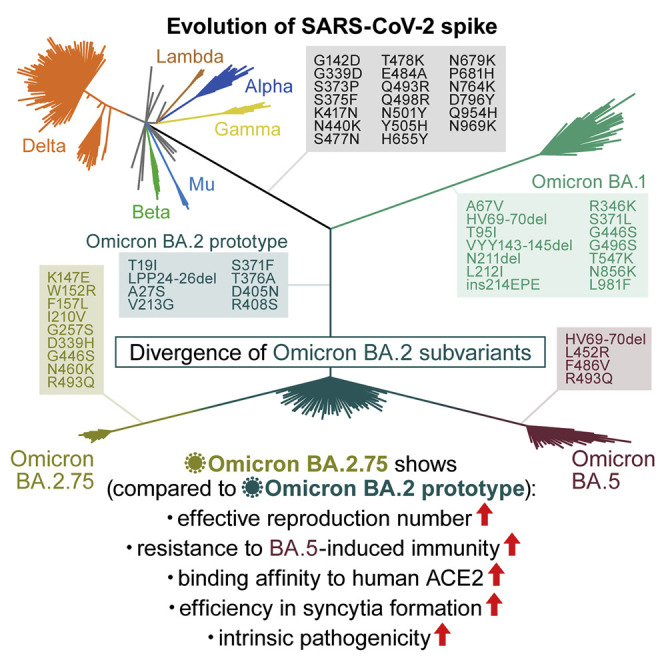
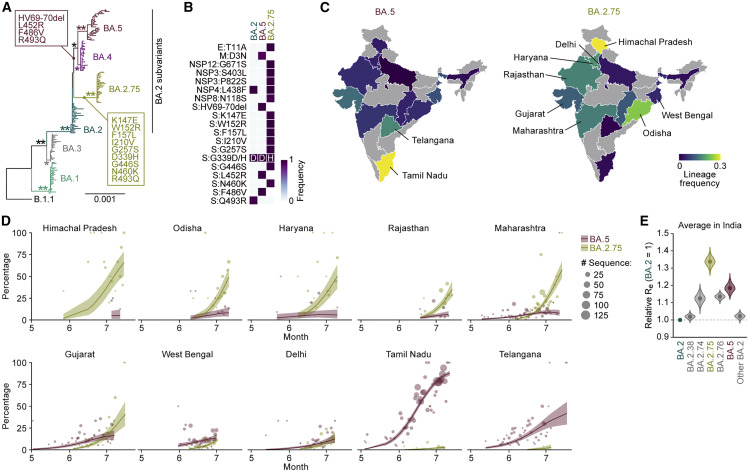
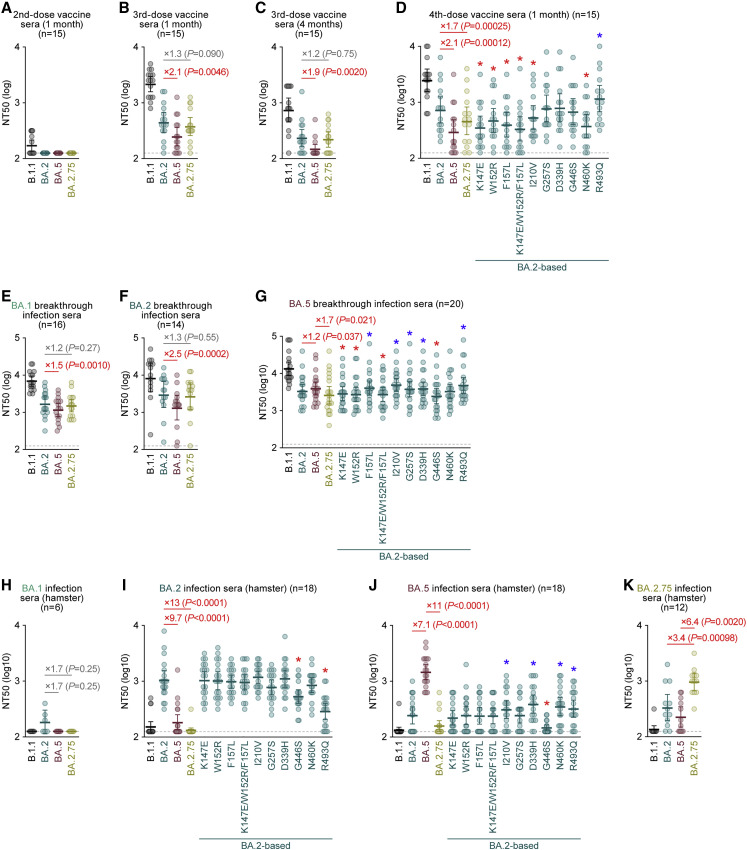
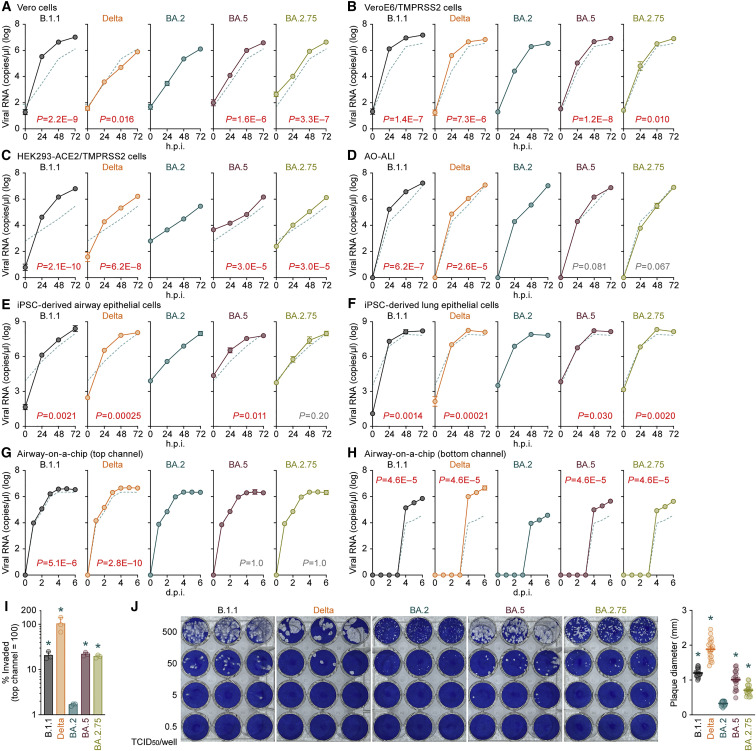
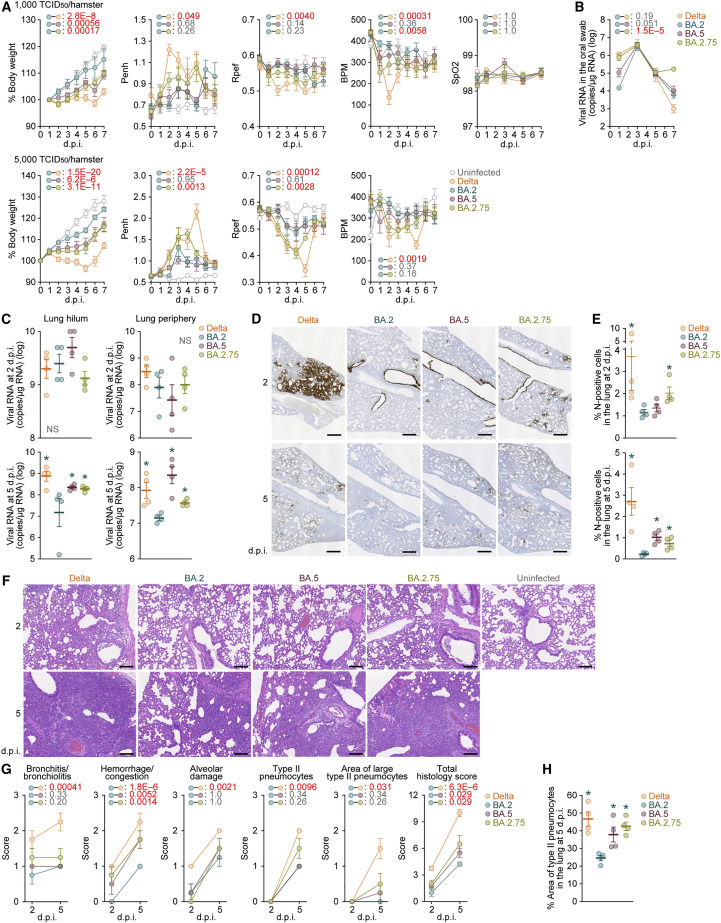
The SARS-CoV-2 Omicron BA.2.75 variant emerged in May 2022. BA.2.75 is a BA.2 descendant but is phylogenetically distinct from BA.5, the currently predominant BA.2 descendant. Here, we show that BA.2.75 has a greater effective reproduction number and different immunogenicity profile than BA.5. We determined the sensitivity of BA.2.75 to vaccinee and convalescent sera as well as a panel of clinically available antiviral drugs and antibodies. Antiviral drugs largely retained potency, but antibody sensitivity varied depending on several key BA.2.75-specific substitutions. The BA.2.75 spike exhibited a profoundly higher affinity for its human receptor, ACE2. Additionally, the fusogenicity, growth efficiency in human alveolar epithelial cells, and intrinsic pathogenicity in hamsters of BA.2.75 were greater than those of BA.2. Our multilevel investigations suggest that BA.2.75 acquired virological properties independent of BA.5, and the potential risk of BA.2.75 to global health is greater than that of BA.5.

Keywords: BA.2.75; COVID-19; Omicron; SARS-CoV-2; antiviral drug resistance; immune resistance; pathogenicity; transmissibility.


Conflict of interest statement

Declaration of interests Y.Y. and T.N. are founders and shareholders of HiLung, Inc. Y.Y. is a co-inventor of patents (PCT/JP2016/057254; “method for inducing differentiation of alveolar epithelial cells,” PCT/JP2016/059786, “method of producing airway epithelial cells”).

Figures

None
Graphical abstract
Figure 1
Figure 1
Epidemics of BA.2.75 in India (A) A maximum likelihood tree of Omicron sublineages. Sequences of BA.1-BA.5 sampled from South Africa and BA.2.75 are included. The mutations acquired in the S protein of BA.2.75 are indicated. Note that R493Q is a reversion (i.e., back mutation from the BA.1–BA.3 lineages [R493] to the B.1.1 lineage [Q493]). Bootstrap values, ≥0.8; ∗∗≥0.95. (B) Amino acid differences among BA.2, BA.2.75, and BA.5. Heatmap indicates the frequency of amino acid substitutions. (C) Lineage frequencies of BA.5 (left) and BA.2.75 (right) in each Indian state. SARS-CoV-2 sequences collected from June 15 to July 15, 2022 were analyzed. (D) Epidemic dynamics of SARS-CoV-2 lineages in Indian states. The results for BA.2.75 and BA.5 are shown. The observed daily sequence frequency (dot) and the dynamics (posterior mean, line; 95% CI, ribbon) are shown. The dot size is proportional to the number of sequences. (E) Estimated relative Re of each viral lineage, assuming a fixed generation time of 2.1 days. The Re value of BA.2 is set at 1. The posterior (violin), posterior mean (dot), and 95% CI (line) are shown. The average values across India estimated by a Bayesian hierarchical model are shown, and the state-specific Re values are shown in Figure S1B. See also Figure S1 and Table S1.
Figure 2
Figure 2
Immune resistance of BA.2.75 Neutralization assays were performed with pseudoviruses harboring the S proteins of B.1.1, BA.1, BA.2, and BA.2.75. The BA.2 S-based derivatives are included in (D), (G), (I), and (J). The following sera were used. (A–D) mRNA vaccine sera (15 donors) collected 1 month after the 2nd-dose vaccination (A), 1 month after the 3rd-dose vaccination (B), 4 months after the 3rd-dose vaccination (C), and 1 month after the 4th-dose vaccination (D). (E–G) Convalescent sera from fully vaccinated individuals who had been infected with BA.1 after full vaccination (16 donors) (E), BA.2 after full vaccination (14 donors) (F), and BA.5 after full vaccination (20 donors) (G). (H–K) Sera from hamsters infected with BA.1 (6 hamsters; H), BA.2 (18 hamsters; I), BA.5 (18 hamsters; J), and BA.2.75 (12 hamsters; K). Assays for each serum sample were performed in triplicate to determine the 50% neutralization titer (NT50). Each dot represents one NT50 value, and the geometric mean and 95% CI are shown. Statistically significant differences were determined by two-sided Wilcoxon signed-rank tests. The p values versus BA.2 (B–F, H, and I), BA.5 (G and J), or BA.2.75 (K) are indicated in the panels. The horizontal dashed line indicates the detection limit (120-fold). For the BA.2 derivatives (D, G, I, and J), statistically significant differences versus BA.2 (p < 0.05) are indicated with asterisks. Red and blue asterisks indicate decreased and increased NT50s, respectively. Information on the vaccinated/convalescent donors is summarized in Table S2. See also Table S2.
Figure 3
Figure 3
Virological features of BA.2.75 S in vitro (A) Pseudovirus assay. The percent infectivity compared with that of the virus pseudotyped with the BA.2 S protein are shown. (B) Binding affinity of the RBD of SARS-CoV-2 S protein to ACE2 by yeast surface display. The KD value indicating the binding affinity of the RBD of the SARS-CoV-2 S protein to soluble ACE2 when expressed on yeast is shown. (C) Overall cryo-EM map of SARS-CoV-2 BA.2.75 S (closed state 1, left) and BA.2.75 S (open state) bound to ACE2 receptor (right). (D) Left, position of the four substitutions, D339H, G446S, N460K, and R493Q, in BA.2.75 S RBD. Right, close-up views of the interaction details of the two independent interfaces of BA.2.75 S. (E) (Top) Electrostatic potential of BA.2.75 RBD (left) and BA.2 RBD (PDB: 7UB0, right) (Lan et al., 2020). The area indicated in square is shown in the bottom panel. (Bottom) BA.2.75 S RBD-human ACE2 complex. BA.2.75 S RBD is shown in surface. Human ACE2 is shown in green cartoon, and a putative N90-glycan of ACE2 is indicated in a circle. Electrostatic potential surface depictions calculated by APBS electrostatic plug-in (Jurrus et al., 2018) of PyMOL. The scale bar shows the electrostatic charge (kT/e). (F) Binding affinity of the RBD of SARS-CoV-2 S protein to the ACE2 bearing the N90Q substitution by yeast surface display. (G and H) S-based fusion assay. (G) S protein expression on the cell surface. The summarized data are shown. (H) S-based fusion assay in Calu-3 cells. The recorded fusion activity (arbitrary units) is shown. The dashed green line indicates the results of BA.2. Assays were performed in quadruplicate (A and H) or triplicate (B, F, and G), and the presented data are expressed as the average ± SD. In (A) and (B), the dashed horizontal lines indicate the value of BA.2. In (A), (B), (F), and (G), each dot indicates the result of an individual replicate. In (A), (B), and (G), statistically significant differences between BA.2 and other variants (p < 0.05) were determined by two-sided Student’s t tests. In (B) and (F), red asterisks indicate statistically significant differences (p < 0.05) determined by two-sided Student’s t tests. In (H), statistically significant differences between BA.2 and other variants across time points were determined by multiple regression. FWERs calculated using the Holm method are indicated in the figures. See also Figure S4 and Table S4.
Figure 4
Figure 4
Growth capacity of BA.2.75 in vitro (A–I) Growth kinetics of B.1.1, Delta, BA.2, BA.5, and BA.2.75. Clinical isolates of B.1.1, Delta, BA.2, BA.5, and BA.2.75 were inoculated into Vero cells (A), VeroE6/TMPRSS2 cells (B), HEK293-ACE2/TMPRSS2 cells (C), AO-ALI (D), iPSC-derived airway epithelial cells (E), iPSC-derived lung epithelial cells (F), and an airway-on-a-chip system (G and H; see also Figure S3C). The copy numbers of viral RNA in the culture supernatant (A–C), the apical sides of cultures (D–F), and the top (G) and bottom (H) channels of an airway-on-a-chip were routinely quantified by RT-qPCR. The dashed green line in each panel indicates the results of BA.2. In (I), the percentage of viral RNA load in the bottom channel per top channel at 6 d.p.i. (i.e., % invaded virus from the top channel to the bottom channel) is shown. (J) Plaque assay. Representative panels (left) and a summary of the recorded plaque diameters (20 plaques per virus) (right) are shown. Assays were performed in quadruplicate, and the presented data are expressed as the average ± SD. In (A)–(H), statistically significant differences between BA.2 and the other variants across time points were determined by multiple regression. FWERs calculated using the Holm method are indicated in the figures. In (I) and (J) (right), statistically significant differences versus BA.2 (p < 0.05) were determined by two-sided Mann-Whitney U tests. Each dot indicates the result of an individual replicate. See also Figure S4.
Figure 5
Figure 5
Virological characteristics of BA.2.75 in vivo Syrian hamsters were intranasally inoculated with Delta, BA.2, BA.5, and BA.2.75. Two different doses of inoculum (1,000 TCID50/hamster [A, top and B–G] or 5,000 TCID50/hamster [A, bottom]) were used. Six hamsters per infection group were used to routinely measure the respective parameters (A and B). Four hamsters per infection group at a lower inoculum (1,000 TCID50/hamster) were euthanized at 2 and 5 d.p.i. and used for virological and pathological analysis (C–G). (A) Body weight, Penh, Rpef, BPM, and SpO2 values of infected hamsters (n = 6 each). The results at a low inoculum (1,000 TCID50/hamster) and a high inoculum (5,000 TCID50/hamster) are shown in the top and bottom panels, respectively. (B) Viral RNA loads in the oral swab (n = 6 each). (C) Viral RNA loads in the lung hilum (left) and lung periphery (right) of infected hamsters (n = 4 each) at 2 d.p.i. (top) and 5 d.p.i. (bottom). (D and E) IHC of the viral N protein in the lungs at 2 d.p.i. (top) and 5 d.p.i. (bottom) of all infected hamsters. (D) Representative figures. N-positive cells are shown in brown. (E) Percentage of N-positive cells in whole lung lobes (n = 4 each). The raw data are shown in Figures S5B and S5C. (F and G) (F) H&E staining of the lungs of infected hamsters. Representative figures are shown. Uninfected lung alveolar space and bronchioles are also shown. (G) Histopathological scoring of lung lesions (n = 4 each). Representative pathological features are reported in our previous studies (Kimura et al., 2022c; Yamasoba et al., 2022a; Suzuki et al., 2022; Saito et al., 2022). (H) Type II pneumocytes in the lungs of infected hamsters. The percentage of the area of type II pneumocytes in the lung at 5 d.p.i. is summarized. The raw data are shown in Figure S5D. In (A)–(C), (E), (G), and (H), data are presented as the average ± SEM. In (C), (E), and (H), each dot indicates the result of an individual hamster. In (A), (B), and (G), statistically significant differences between BA.2 and other variants across time points were determined by multiple regression. In (A), the 0 d.p.i. data were excluded from the analyses. FWERs calculated using the Holm method are indicated in the figures. In (C), (E), and (G), the statistically significant differences between BA.2 and other variants were determined by a two-sided Mann-Whitney U test. In (D) and (F), each panel shows a representative result from an individual infected hamster. Scale bars: 500 μm in (D) and 200 μm in (F). See also Figure S5.

References

    1. Adams P.D., Afonine P.V., Bunkóczi G., Chen V.B., Davis I.W., Echols N., Headd J.J., Hung L.W., Kapral G.J., Grosse-Kunstleve R.W., et al. Phenix: a comprehensive Python-based system for macromolecular structure solution. Acta Crystallogr. D Biol. Crystallogr. 2010;66:213–221. doi: 10.1107/S0907444909052925. - DOI - PMC - PubMed
    1. Arora P., Kempf A., Nehlmeier I., Schulz S.R., Cossmann A., Stankov M.V., Jäck H.M., Behrens G.M.N., Pöhlmann S., Hoffmann M. Augmented neutralisation resistance of emerging omicron subvariants BA.2.12.1, BA.4, and BA.5. Lancet Infect. Dis. 2022;22:1117–1118. doi: 10.1016/S1473-3099(22)00422-4. - DOI - PMC - PubMed
    1. Barnes C.O., Jette C.A., Abernathy M.E., Dam K.A., Esswein S.R., Gristick H.B., Malyutin A.G., Sharaf N.G., Huey-Tubman K.E., Lee Y.E., et al. SARS-CoV-2 neutralizing antibody structures inform therapeutic strategies. Nature. 2020;588:682–687. doi: 10.1038/s41586-020-2852-1. - DOI - PMC - PubMed
    1. Bruel T., Hadjadj J., Maes P., Planas D., Seve A., Staropoli I., Guivel-Benhassine F., Porrot F., Bolland W.H., Nguyen Y., et al. Serum neutralization of SARS-CoV-2 Omicron sublineages BA.1 and BA.2 in patients receiving monoclonal antibodies. Nat. Med. 2022;28:1297–1302. doi: 10.1038/s41591-022-01792-5. - DOI - PubMed
    1. Cao Y., Song W., Wang L., Liu P., Yue C., Jian F., Yu Y., Yisimayi A., Wang P., Wang Y., et al. Characterizations of enhanced infectivity and antibody evasion of Omicron BA.2.75. Preprint at bioRxiv. 2022 doi: 10.1101/2022.07.18.500332. - DOI - PMC - PubMed

Supplementary concepts