. 2023 Feb;164(2):256-271.e10.
doi: 10.1053/j.gastro.2022.10.011. Epub 2022 Oct 20.

G9a Modulates Lipid Metabolism in CD4 T Cells to Regulate Intestinal Inflammation

Affiliations

G9a Modulates Lipid Metabolism in CD4 T Cells to Regulate Intestinal Inflammation

Guilherme Piovezani Ramos et al. Gastroenterology. 2023 Feb.

Abstract

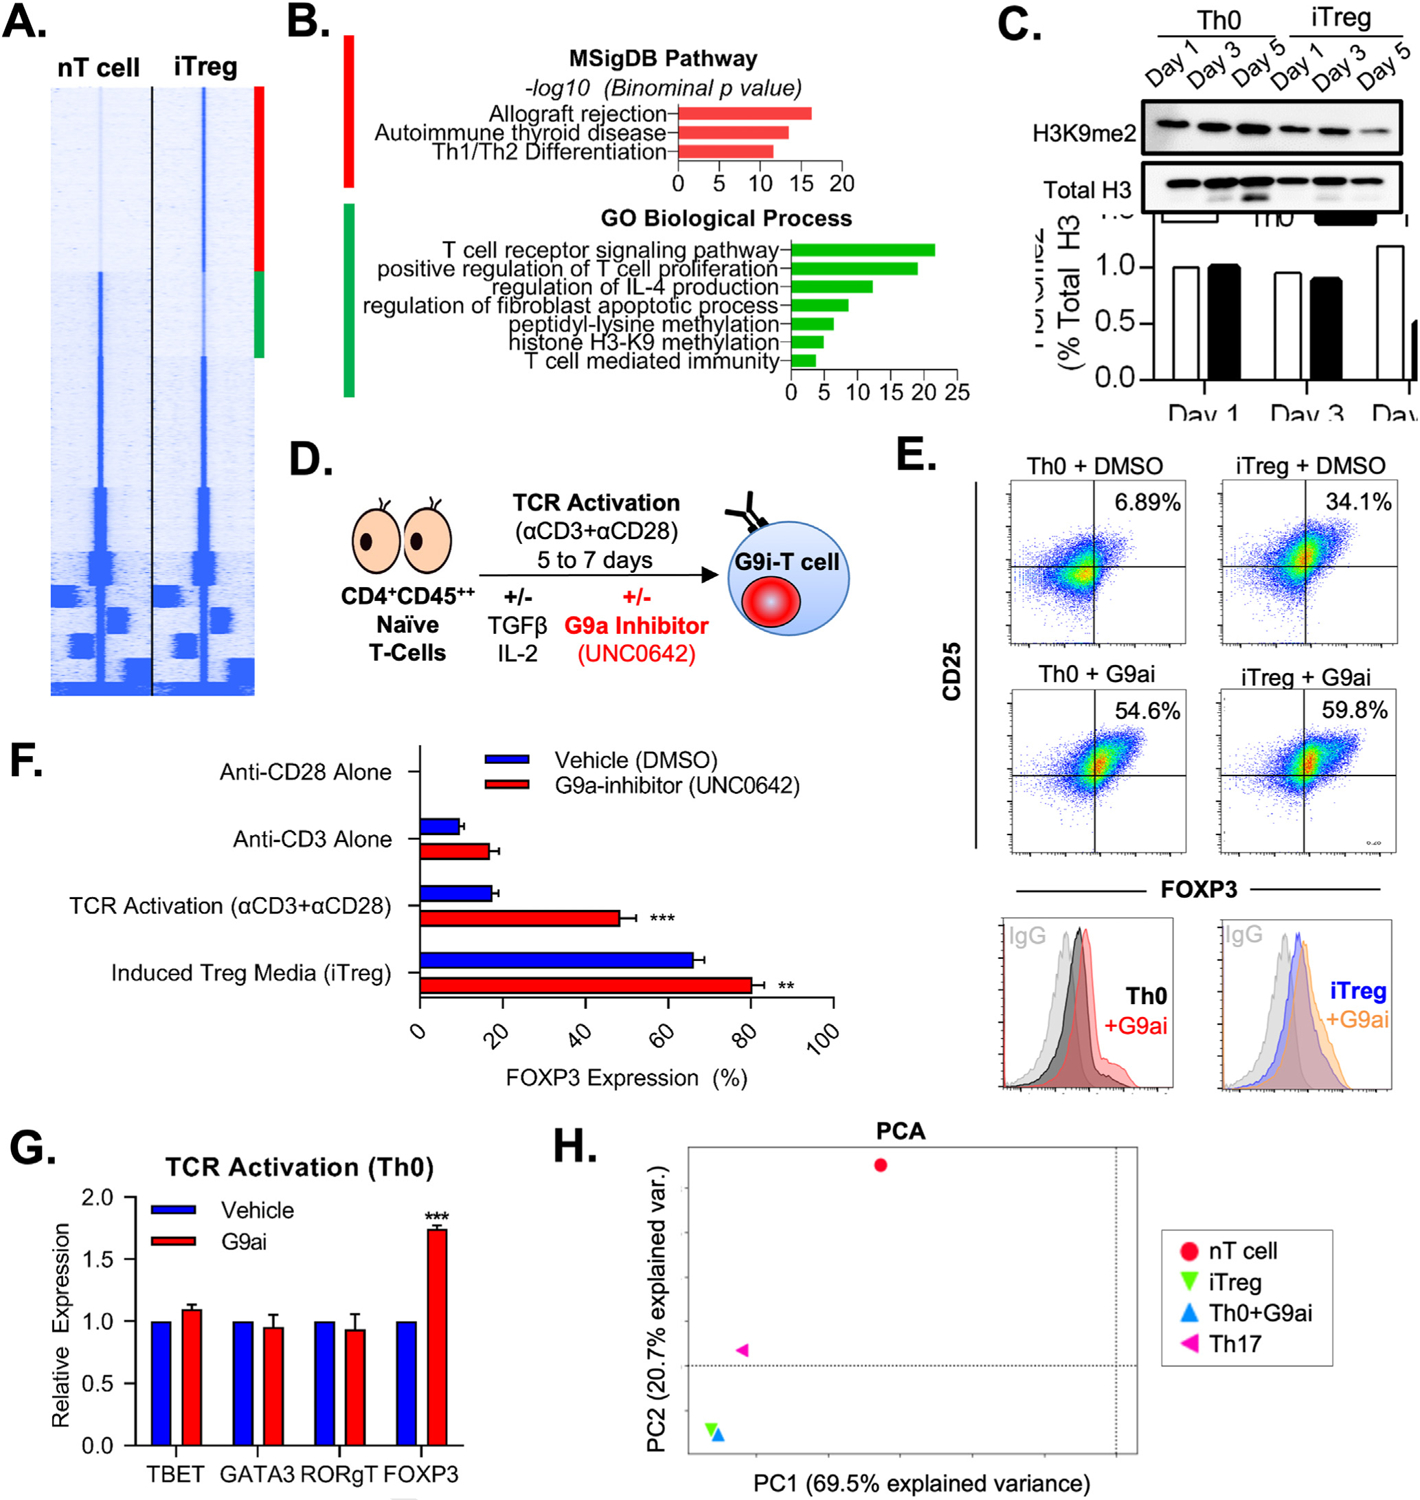
Background & aims: Although T-cell intrinsic expression of G9a has been associated with murine intestinal inflammation, mechanistic insight into the role of this methyltransferase in human T-cell differentiation is ill defined, and manipulation of G9a function for therapeutic use against inflammatory disorders is unexplored.

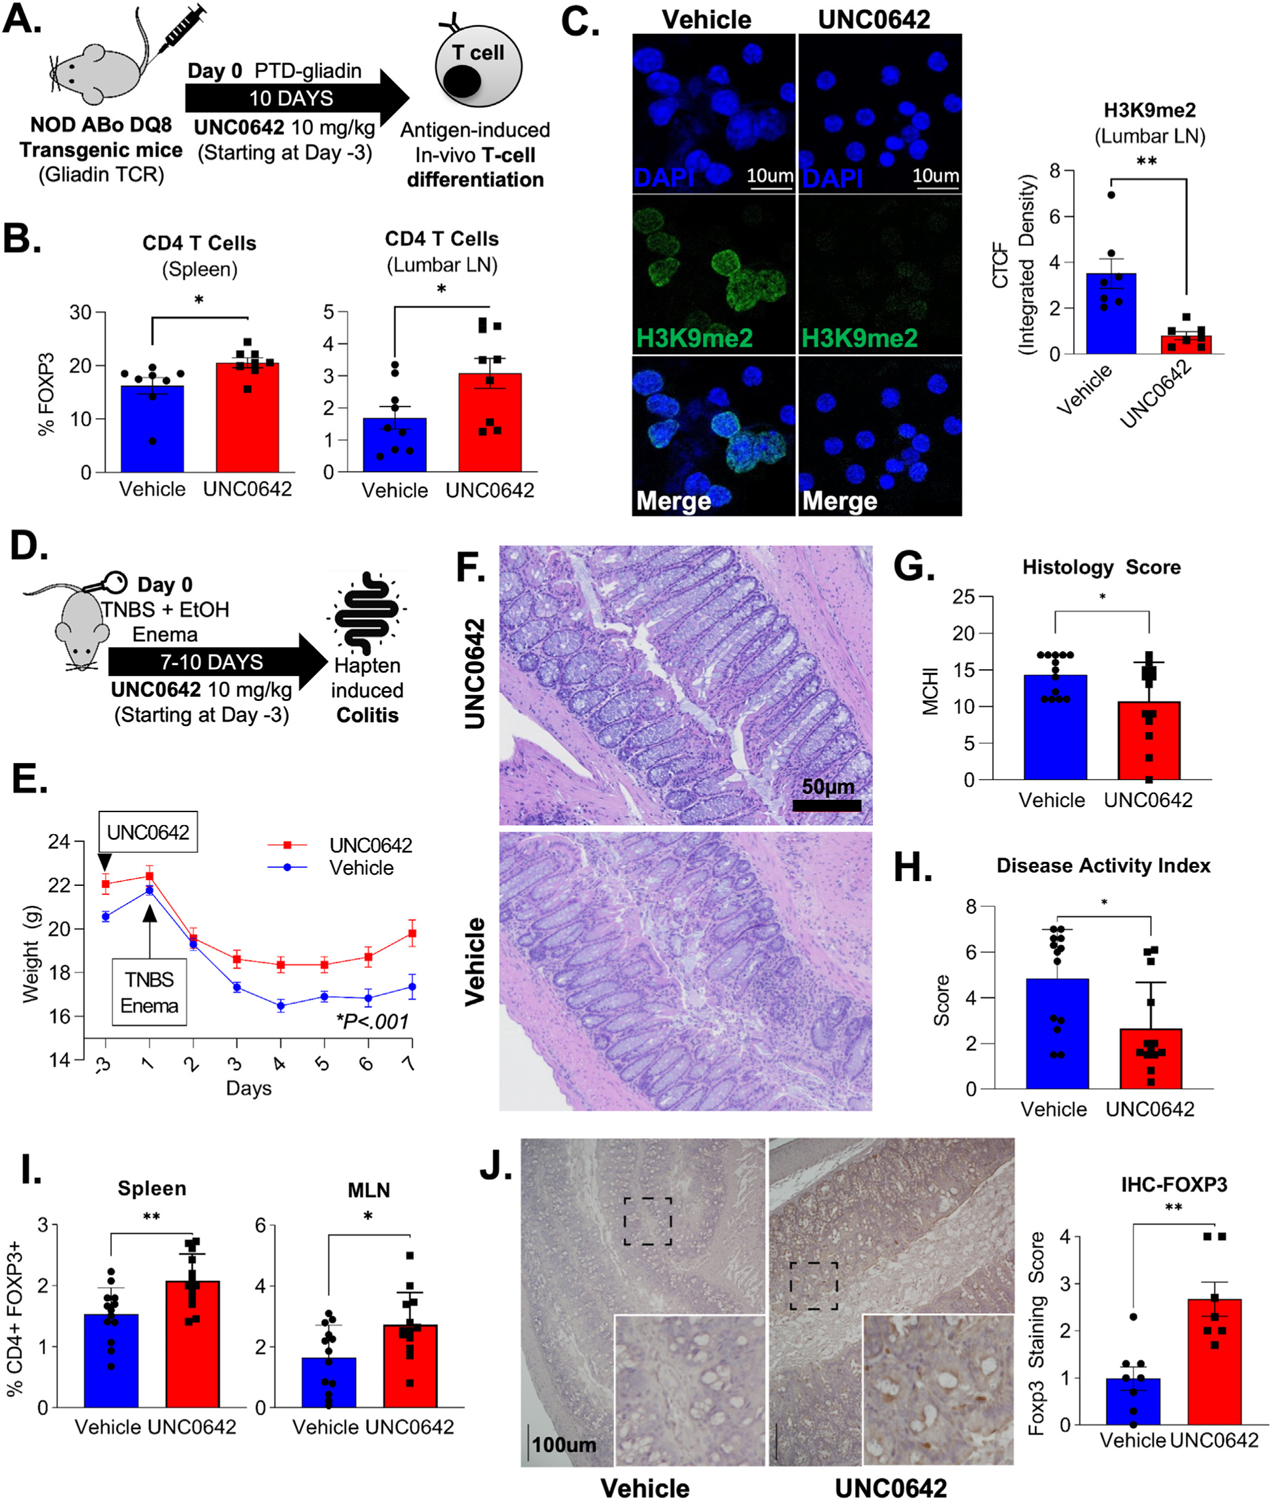
Methods: Human naive T cells were isolated from peripheral blood and differentiated in vitro in the presence of a G9a inhibitor (UNC0642) before being characterized via the transcriptome (RNA sequencing), chromatin accessibility (assay for transposase-accessible chromatin by sequencing), protein expression (cytometry by time of flight, flow cytometry), metabolism (mitochondrial stress test, ultrahigh performance liquid chromatography-tandem mas spectroscopy) and function (T-cell suppression assay). The in vivo role of G9a was assessed using 3 murine models.

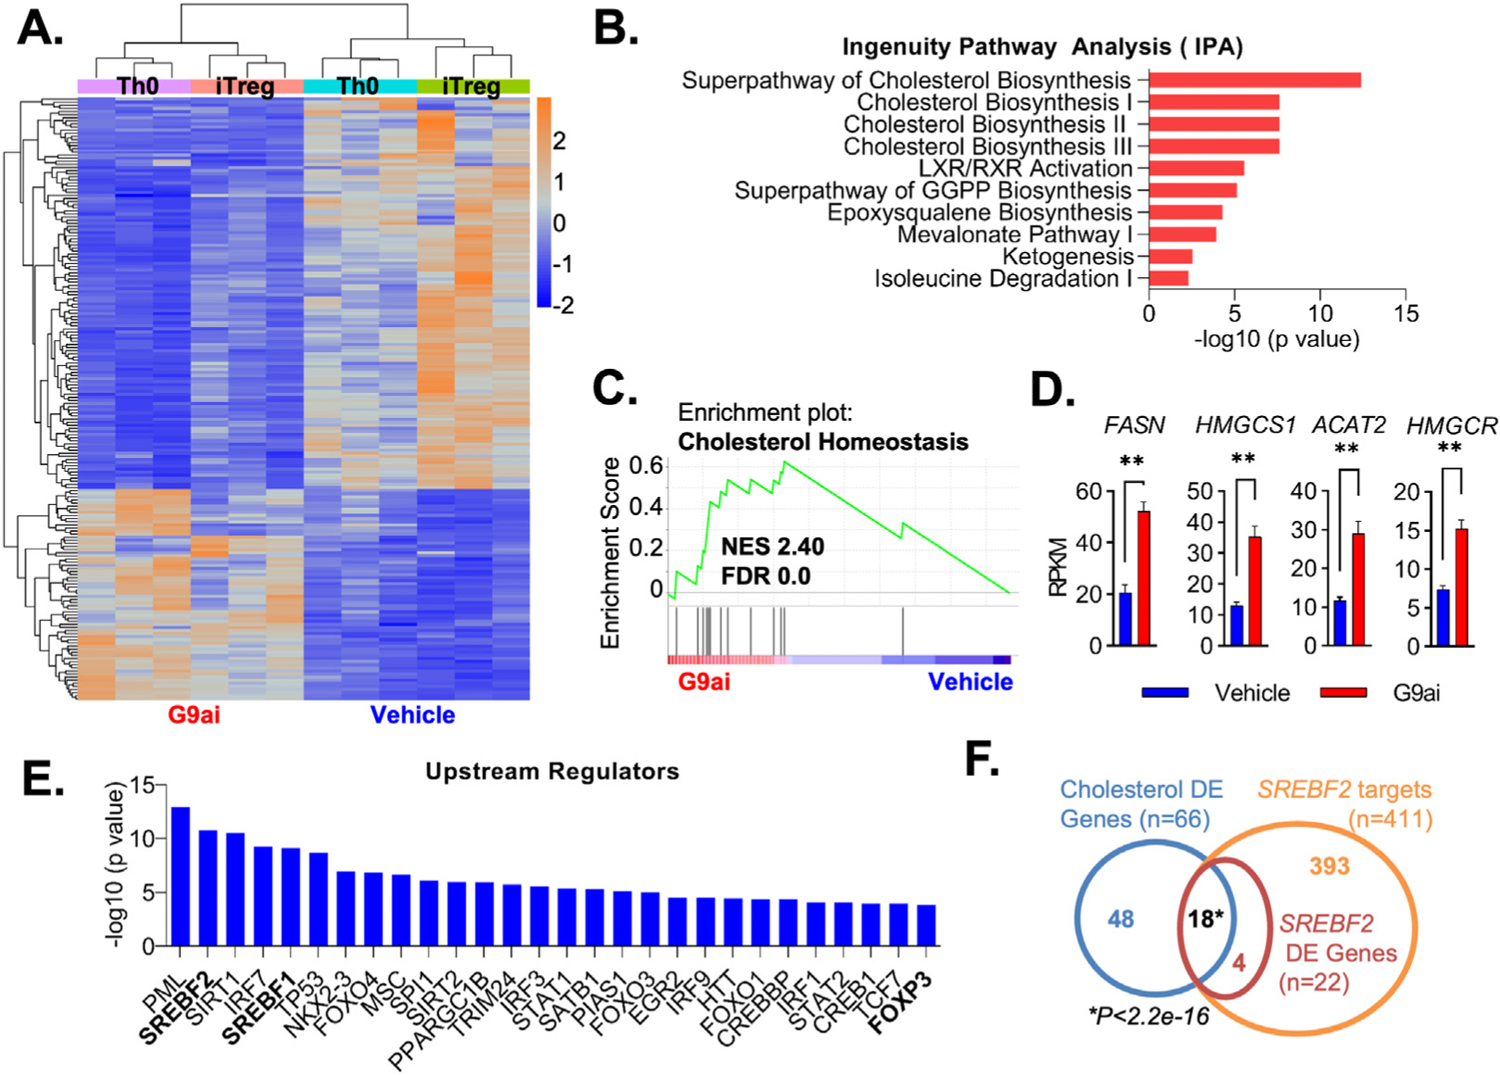
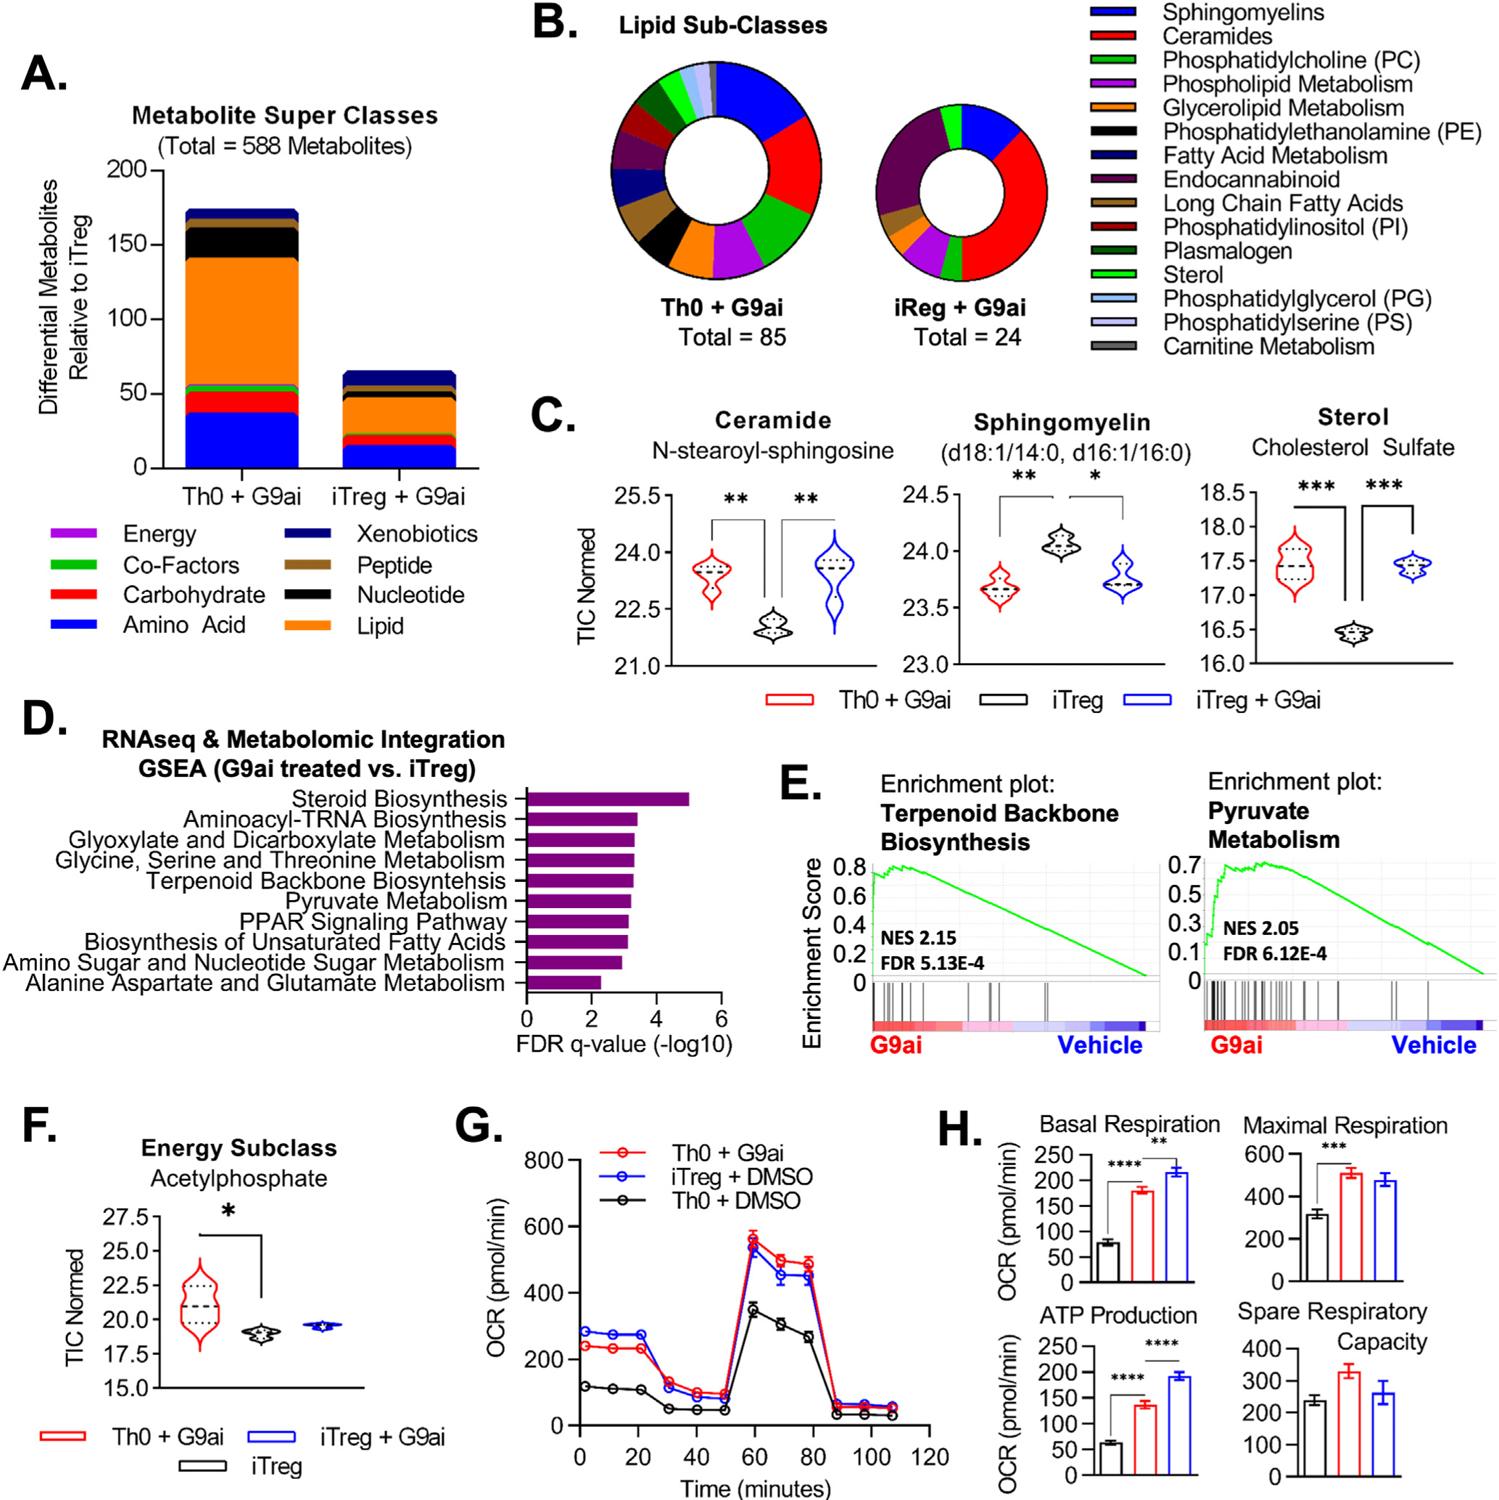
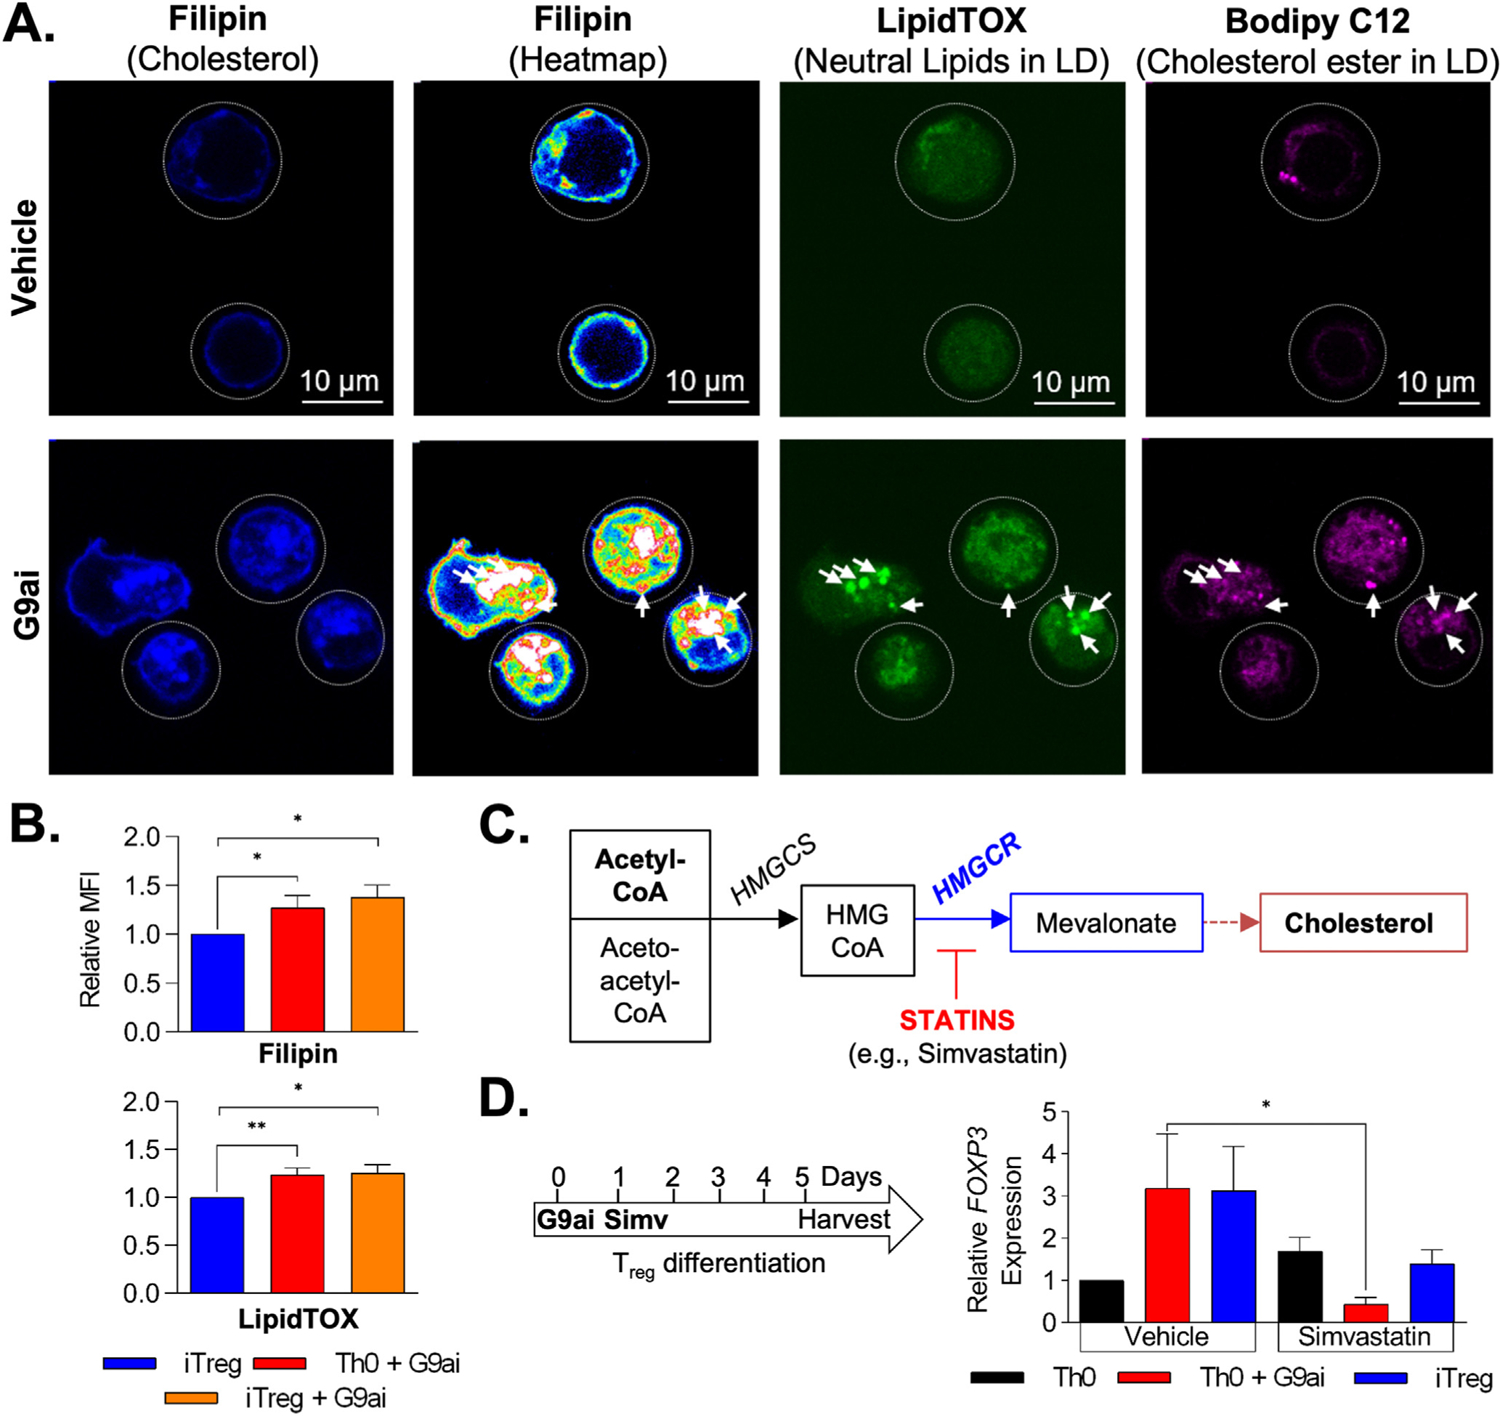
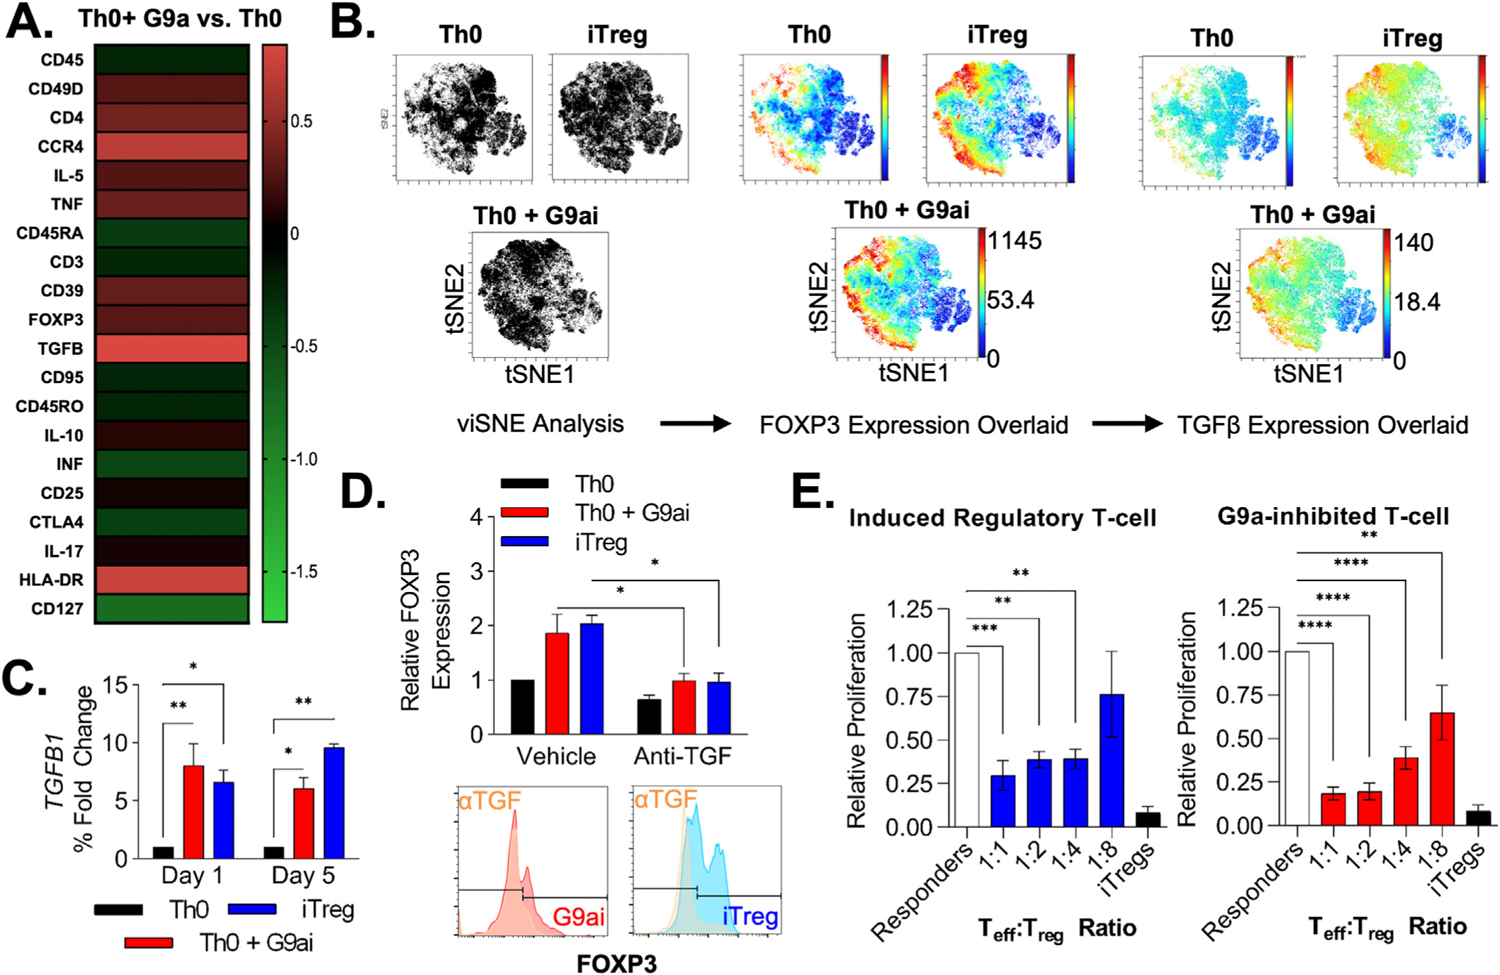
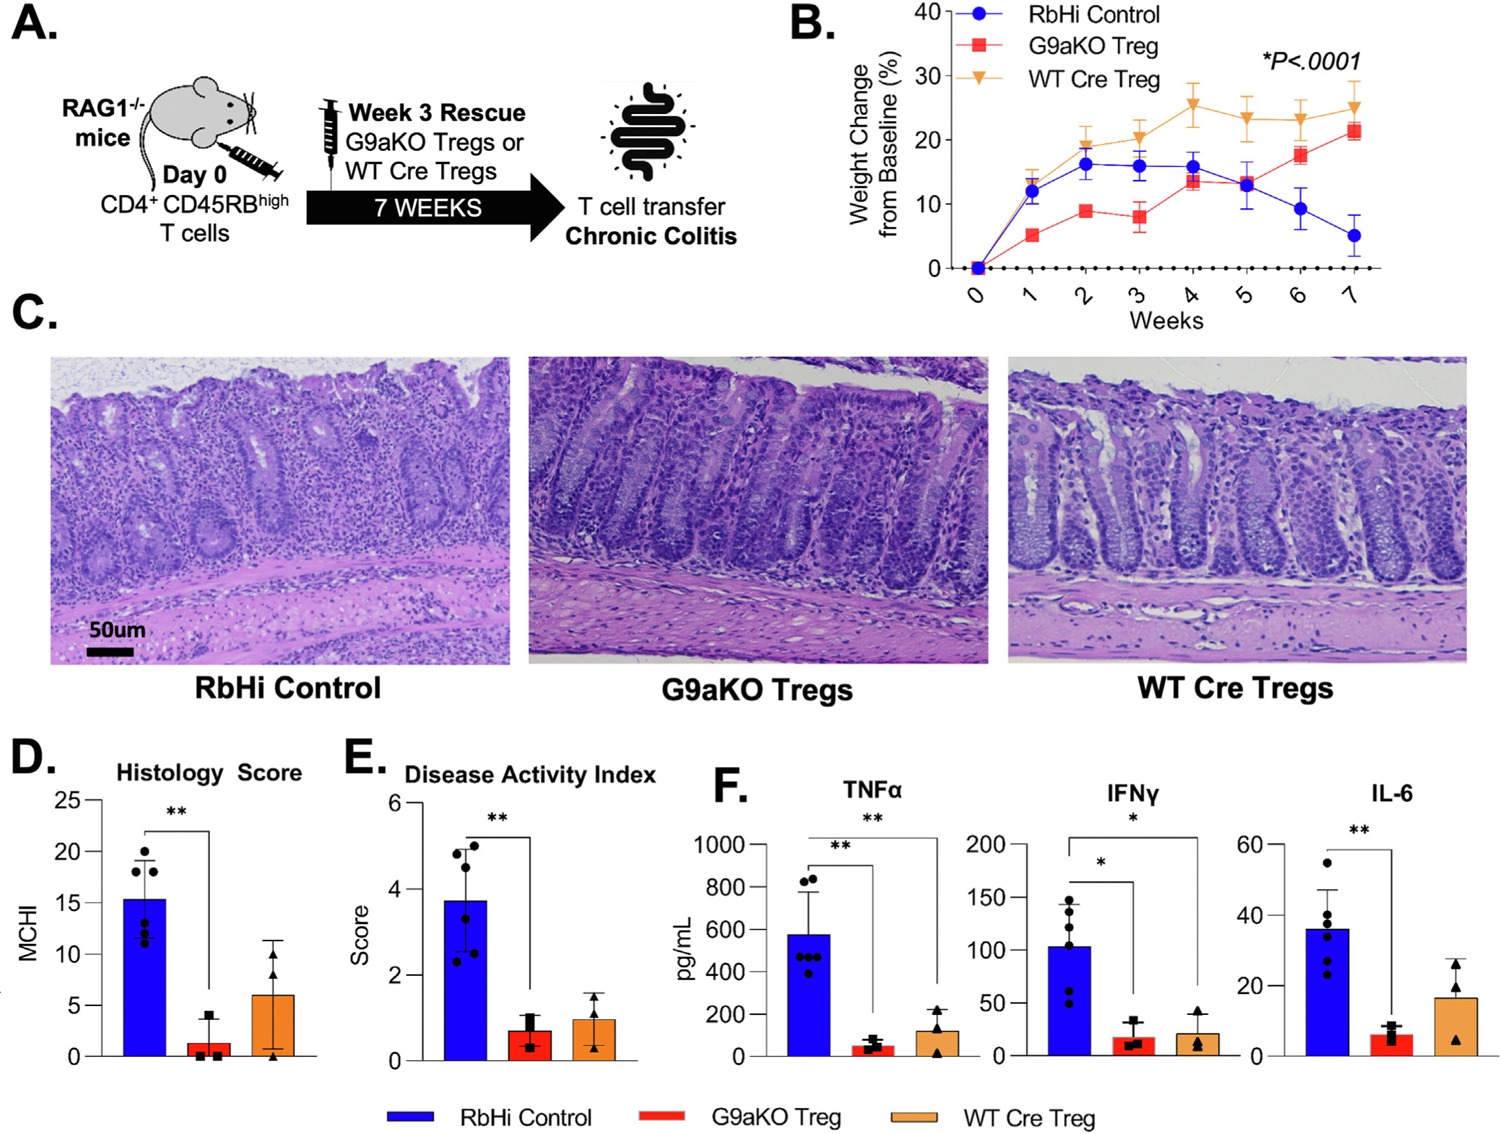
Results: We discovered that pharmacologic inhibition of G9a enzymatic function in human CD4 T cells led to spontaneous generation of FOXP3+ T cells (G9a-inibitors-T regulatory cells [Tregs]) in vitro that faithfully reproduce human Tregs, functionally and phenotypically. Mechanistically, G9a inhibition altered the transcriptional regulation of genes involved in lipid biosynthesis in T cells, resulting in increased intracellular cholesterol. Metabolomic profiling of G9a-inibitors-Tregs confirmed elevated lipid pathways that support Treg development through oxidative phosphorylation and enhanced lipid membrane composition. Pharmacologic G9a inhibition promoted Treg expansion in vivo upon antigen (gliadin) stimulation and ameliorated acute trinitrobenzene sulfonic acid-induced colitis secondary to tissue-specific Treg development. Finally, Tregs lacking G9a expression (G9a-knockout Tregs) remain functional chronically and can rescue T-cell transfer-induced colitis.

Conclusion: G9a inhibition promotes cholesterol metabolism in T cells, favoring a metabolic profile that facilitates Treg development in vitro and in vivo. Our data support the potential use of G9a inhibitors in the treatment of immune-mediated conditions including inflammatory bowel disease.

Keywords: Cholesterol; Inflammatory Bowel Disease; Lipid Metabolism; Regulatory T Cells.


Conflict of interest statement

Conflicts of interest

The authors disclose no conflicts.

Figures

Figure 1.
Figure 1.
G9a inhibition spontaneously drives FOXP3 expression in T cells. (A) Heat map of ATAC-seq comparing human nT cells and iTregs shows 2 distinct clusters of open (red) and closed (green) chromatin. (B) Pathway analysis shows that H3K9 methylation is an important biologic process within distinct chromatin landscape peaks between nT cells and iTregs. (C) Immunoblotting confirmed a decrease in H3K9me2 during iTreg development. (D) nT cells were treated in the presence of G9ai (UNC0642) under Th0 (anti-CD3 and anti-CD28 costimulation) iTreg conditions (supplementary TGFβ and IL2). (E) Representative flow cytometry of FOXP3 and CD25 characterizing increased Treg differentiation under G9ai, which occurred even in the absence of stimulating cytokines (Th0+G9ai). Representative histograms display FOXP3 expression per group compared to immunoglobulin G isotype control. (F) Quantification by flow cytometry confirms significantly higher FOXP3 expression in UNC0642-treated cells in either the absence or presence of external cytokines but not with anti-CD28 or anti-CD3 stimulation alone. (G) Th0+G9ai cells show increased protein expression of FOXP3 but not other T-cell lineage–specific transcription factors. (H) Principal component analysis of ATAC-seq performed at the end differentiation shows that Th0+G9ai have a chromatin landscape signature identical to that of iTregs and contrastingly different from that of Th17 and nT+cells. **P < .01, ***P < .001. DMSO, dimethyl sulfoxide; PC, principal component; PCA, principal component analysis.
Figure 2.
Figure 2.
Inhibition of G9a methyltransferase activity promotes cholesterol metabolism pathways during T-cell development. (A) Heatmap from RNA-seq performed in differentiating human nT cells showing clustering DEGs in G9ai-treated vs vehicle conditions. (B) Ingenuity pathway analysis highlighting differentially up-regulated genes under G9ai are associated with cholesterol metabolism pathways. (C) Gene set enrichment analysis further supported differentially up-regulated genes on G9ai conditions are significantly linked to cholesterol homeostasis. (D) Differential expression of individual genes enriched within the cholesterol homeostasis pathway highlights key lipogenic enzymes. (E) Analysis of the top upstream regulators of G9ai-associated genes shows a list of transcription factors that includes FOXP3 and the master lipogenic regulators SREBF1 and SREBF2. (F) Overlap of a list of cholesterol genes differential expressed (blue circle) in G9ai-treated conditions with a publicly available list of SREBF2 targets (orange circle) shows that the significant majority of differentially expressed SREBP2 targets (red circle) are involved in regulating cholesterol metabolism. **P < .01, analyzed using the Mann-Whitney test. DE, differentially expressed; FDR, false discovery rate; NES, XXXX; RPKM, reads per kilobase per million mapped reads.
Figure 3.
Figure 3.
G9a modulates lipid metabolism in T cells, supporting membrane development and a phenotypic Treg energy profile. (A) Summary of differential metabolites evaluated via ultrahigh performance liquid chromatography–tandem mass spectroscopy in inhibitor-treated conditions compared to standard human iTregs. (B) Focused lipid subclasses associated with differential metabolites in G9ai-treated conditions highlighted membrane-associated lipids. (C) Congruent changes were seen in G9ai cells at the individual level of lipid metabolites. (D) Integration of metabolomic and transcriptomic (RNA-seq) data generated a combined database of both genes and metabolites, which was used for pathway enrichment. (E) Top pathways enriched in both G9ai-treated conditions included terpenoid backbone biosynthesis, dependent on the mevalonate pathway of cholesterol biosynthesis, and pyruvate metabolism, which is associated with bioenergetic support. (F) Subanalysis within the energy superclass revealed that acetylphosphate, a precursor of acetyl-CoA, was enriched in Th0+G9ai. **P < .01, *P < .05. (G) Mitochondrial stress test showed that Th0+G9ai cells have increased OXPHOS capacity with equivalent levels to iTregs. (H) When compared to Th0 cells, Th0+G9ai had higher basal respiration levels (P < .0001), adenosine triphosphate-linked respiration levels after challenge with oligomycin (P < .0001), and maximal respiration capacity (P < .001) upon addition of FCCP but no significant differences in spare respiratory capacity after rotenone/antimycin A. OCR, XXXX; TIC, total ion current.
Figure 4.
Figure 4.
Increase in intracellular cholesterol is required for G9a-mediated Treg development. (A) Confocal microscopy after lipid staining during differentiation confirms increased intracellular cholesterol (filipin) in G9ai–T cells when compared to vehicle-treated cells. Heatmap shows an increase of membrane-bound cholesterol as well as at the level of cholesterol-laden LDs, outlined via LipidTox and Bodipy C12 staining. (B) Flow cytometry quantification confirmed increased intracellular cholesterol (filipin) and neutral lipids within LDs (LipidTOX) in G9ai-treated conditions. (C) Simplified representation of the mevalonate pathway of cholesterol biosynthesis showing key enzymes, HMGCS and HMGCR, that are differentially expressed in G9ai-treated conditions and can be inhibited upstream by statins. (D) Addition of simvastatin (Simv, 5 μmol/L) significantly suppresses G9a-mediated FOXP3 expression. *P < .05 and **P < .01. HMGCR, HMG-CoA synthase reductase; HMGCS, HMG-CoA synthase; MFI, mean fluorescent intensity.
Figure 5.
Figure 5.
G9ai-generated FOXP3+ T cells are phenotypically similar to iTregs with enhanced intrinsic TGF-β production. (A) Heatmap showing phenotypical cytometry time-of-flight characterization of Th0+G9ai T cells based on cell surface marker and intracellular cytokine expression. (B) Representative viSNE clustering of CD4+ cells identifies a distinct subset population of FOXP3+, similarly seen in both iTreg and Th0+G9ai conditions, with heightened TGF-β production. (C) Changes in TGF-β expression by quantitative polymerase chain reaction are noted as early as 24 hours after the addition of UNC0642 during differentiation and peak at the end of 5 days. (E) Similar to iTregs, concomitant treatment with anti–TGF-β antibodies decreases FOXP3 expression in Th0+G9ai and iTregs, showing that Treg differentiation is dependent on TGF-β signaling. (F) Functional characterization using T-cell thymidine–based suppression assay shows that Th0+G9ai cells are capable of suppressing effector T-cell proliferation just as efficiently as iTregs. *P < .01, ***P < .001, and ****P < .0001. Teff, T effector cell.
Figure 6.
Figure 6.
Pharmacologic inhibition of G9a upon antigen stimulation promotes Treg development in vivo and ameliorates hapten-induced colitis. (A) Immunization model using NOD Abo DQ8 mice expressing HLA-DQ8, which is triggered by the gliadin fraction of gluten, was used to assess the impact of G9a-inhibition (UNC0642) in T-cell differentiation in vivo. (B) Flow cytometric of murine T cells isolated from spleen (20.6 vs 16.2; P = .03) and lumbar lymph nodes (3.1% vs 1.7%; P = .03) confirmed an increase in peripherally induced FOXP3+CD4+ T cells in UNC0642-treated animals. (C) Immunofluorescence shows a correspondent decrease in the H3K9me2 within CD4+ T cells isolated from lumbar lymph nodes after G9ai, as (D) quantified by corrected total cell fluorescence (0.8 vs 3.5 id; P = .002). (D) Mice were treated with UNC0642 for a total of 10 days after colitis induction with enema containing ethanol and TNBS to promote hapten-induced colitis. (E) UNC0642-treated animals showed a less severe colitis phenotype highlighted by reduced weight loss and (F, G) improved histologic (14.3 vs 10.7; P = .03) and (H) disease activity scores (4.8 vs 2.6; P = .01). (I) An increase in the percentage of peripheral FOXP3+ was observed in murine cells isolated from spleen (vehicle: 1.5 vs UNC: 2.1%; P = .003) and mesenteric lymph nodes (vehicle: 1.6 vs UNC: 2.7%; P = .01) at the end of the experiment. (J) An increase in FOXP3+ cells was also seen at the mucosa of G9ai of treated mice via immunohistochemistry (vehicle 1 vs UNC: 2.3 median score; P = .003 using the Mann-Whitney test). *P < .05, **P < .01, ***P < .001. CTCF, XXXX; IHC, immunohistochemistry; LN, lymph node; MCHI, XXXX; PTD, XXXX.
Figure 7.
Figure 7.
Regulatory T cells lacking G9a expression maintain suppressive function to rescue chronic colitis. (A) CD45RBhighCD25low T cells were sorted from WT mice and transferred to RAG−/− immunodeficient mice at day 0. Upon initial signs of colitis in week 3, GFP+ G9aKO cells or WT Cre Tregs were transferred for rescue with an RbHi control group not receiving cells. (B) Weight trends show that Tregs from G9aKO can equally rescue weight loss when compared to WT Tregs (P < .0001 using 2-way analysis of variance). Animals that received G9aKO Tregs showed a decrease in (C) immune infiltrates with equally improved histologic (RbHi: 15.3 vs G9aKO: 1.3 vs WT Treg: 6.0; P = .001) and disease activity (RbHi: 3.7 vs G9aKO: 0.7 vs WT Treg: 1.0; P = .002) scores when compared to RbHi control. Decreased levels of serum cytokines were also equally seen in animals receiving both G9aKO and WT Tregs when compared to RbHi control: TNF-α (RbHi: 575.7 vs G9aKO: 53.1 vs WT Treg: 120.1 pg/mL; P = .002), interferon gamma (RbHi: 103.2 vs G9aKO: 17.8 vs WT Treg: 21.0 pg/mL) and IL6 (RbHi: 36.0 vs G9aKO: 6.3 vs WT Treg: 16.6 pg/mL; P = .005). **P < .01, ***P < .001. TNF, tumor necrosis factor; IFN, interferon.

Similar articles

Cited by

References

    1. Smids C, Horjus Talabur Horje CS, Drylewicz J, et al. Intestinal T cell profiling in inflammatory bowel disease: linking T cell subsets to disease activity and disease course. J Crohns Colitis 2018;12:465–475. - PubMed
    1. Jaeger N, Gamini R, Cella M, et al. Single-cell analyses of Crohn’s disease tissues reveal intestinal intraepithelial T cells heterogeneity and altered subset distributions. Nat Commun 2021;12(1):1921. - PMC - PubMed
    1. Singh S, Murad MH, Fumery M, et al. Comparative efficacy and safety of biologic therapies for moderate-to-severe Crohn’s disease: a systematic review and network meta-analysis. Lancet Gastroenterol Hepatol 2021;6:1002–1014. - PMC - PubMed
    1. Sakaguchi S. Naturally arising Foxp3-expressing CD25+CD4+ regulatory T cells in immunological tolerance to self and non-self. Nat Immunol 2005;6:345–352. - PubMed
    1. Ohkura N, Kitagawa Y, Sakaguchi S. Development and maintenance of regulatory T cells. Immunity 2013; 38:414–423. - PubMed

Publication types