

Accommodating site variation in neuroimaging data using normative and hierarchical Bayesian models
- PMID: 36272672
- PMCID: PMC7614761
- DOI: 10.1016/j.neuroimage.2022.119699
Accommodating site variation in neuroimaging data using normative and hierarchical Bayesian models
Abstract
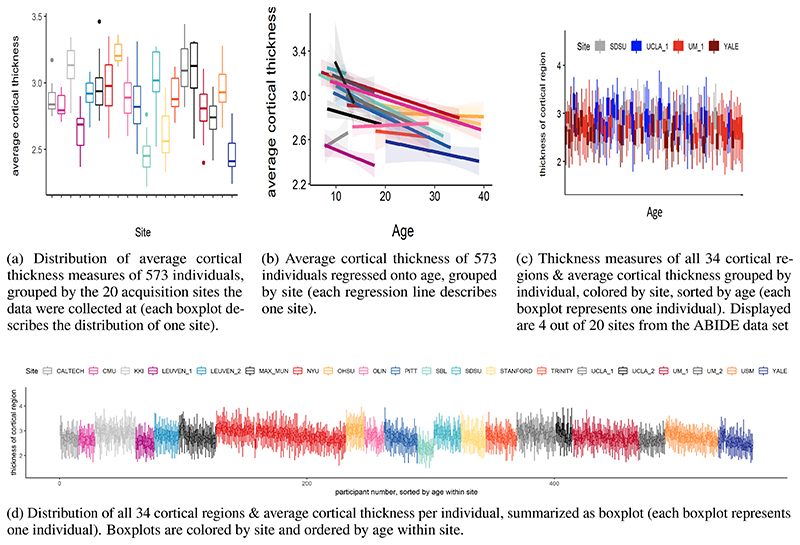
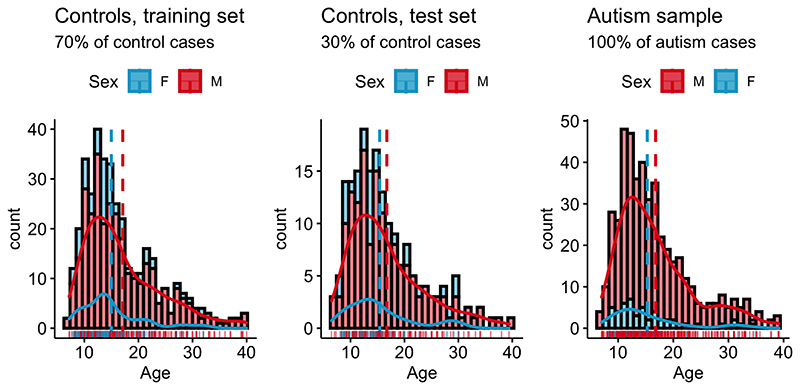
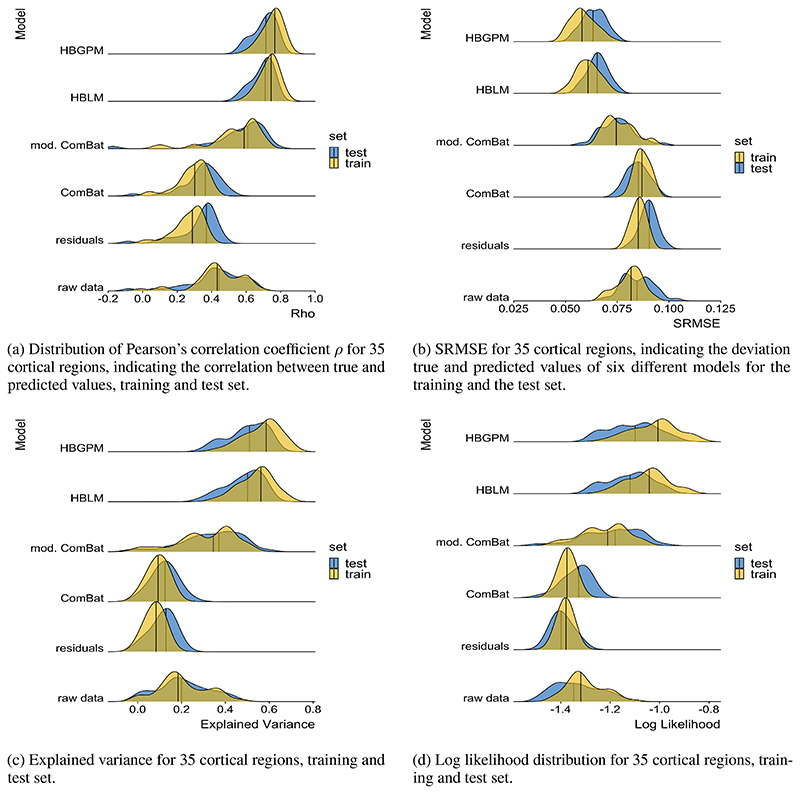
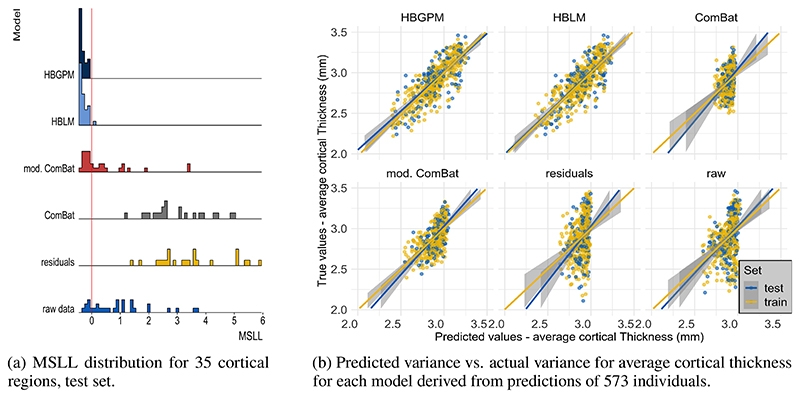
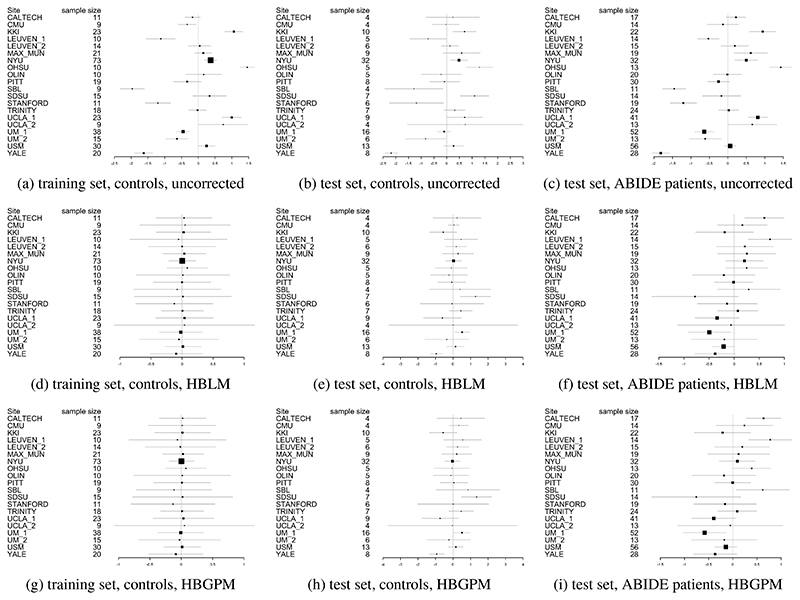
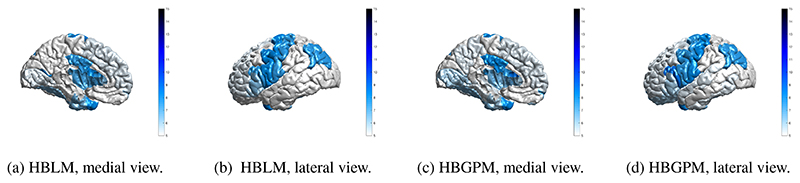
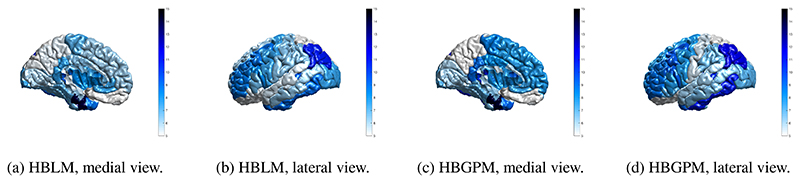
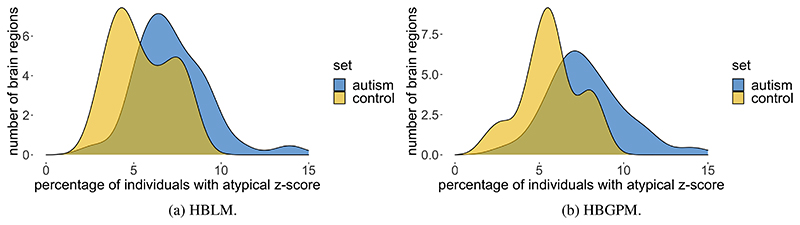
The potential of normative modeling to make individualized predictions from neuroimaging data has enabled inferences that go beyond the case-control approach. However, site effects are often confounded with variables of interest in a complex manner and can bias estimates of normative models, which has impeded the application of normative models to large multi-site neuroimaging data sets. In this study, we suggest accommodating for these site effects by including them as random effects in a hierarchical Bayesian model. We compared the performance of a linear and a non-linear hierarchical Bayesian model in modeling the effect of age on cortical thickness. We used data of 570 healthy individuals from the ABIDE (autism brain imaging data exchange) data set in our experiments. In addition, we used data from individuals with autism to test whether our models are able to retain clinically useful information while removing site effects. We compared the proposed single stage hierarchical Bayesian method to several harmonization techniques commonly used to deal with additive and multiplicative site effects using a two stage regression, including regressing out site and harmonizing for site with ComBat, both with and without explicitly preserving variance caused by age and sex as biological variation of interest, and with a non-linear version of ComBat. In addition, we made predictions from raw data, in which site has not been accommodated for. The proposed hierarchical Bayesian method showed the best predictive performance according to multiple metrics. Beyond that, the resulting z-scores showed little to no residual site effects, yet still retained clinically useful information. In contrast, performance was particularly poor for the regression model and the ComBat model in which age and sex were not explicitly modeled. In all two stage harmonization models, predictions were poorly scaled, suffering from a loss of more than 90% of the original variance. Our results show the value of hierarchical Bayesian regression methods for accommodating site variation in neuroimaging data, which provides an alternative to harmonization techniques. While the approach we propose may have broad utility, our approach is particularly well suited to normative modeling where the primary interest is in accurate modeling of inter-subject variation and statistical quantification of deviations from a reference model.
Keywords: Hierarchical bayesian modeling; Neuroimaging; Normative modeling; Site effects.
Copyright © 2022. Published by Elsevier Inc.
Conflict of interest statement
Declaration of Competing Interest The authors declare that they have no conflict of interest.
Figures

References
-
- Bartlett MS. Properties of sufficiency and statistical tests. Proceedings of the Royal Society of London Series A-Mathematical and Physical Sciences. 1937;160(901):268–282.
-
- Bethlehem R, Seidlitz J, Romero-Garcia R, Lombardo M. Using normative age modelling to isolate subsets of individuals with autism expressing highly age-atypical cortical thickness features. bioRxiv. 2018:252–593.
-
- Bonilla E, Chai KM, Williams C. Multi-task Gaussian Process Prediction. Nips. 2008 October;20:153–160.
Publication types
MeSH terms
Grants and funding
LinkOut - more resources
Full Text Sources
