. 2023;15(2):327-354.
doi: 10.1016/j.jcmgh.2022.10.009. Epub 2022 Oct 19.

Sex Differences in Genomic Features of Hepatitis B-Associated Hepatocellular Carcinoma With Distinct Antitumor Immunity

Affiliations

Sex Differences in Genomic Features of Hepatitis B-Associated Hepatocellular Carcinoma With Distinct Antitumor Immunity

Chungui Xu et al. Cell Mol Gastroenterol Hepatol. 2023.

Abstract

Background & aims: Aflatoxin exposure increases the risk for hepatocellular carcinoma (HCC) in hepatitis B virus (HBV)-infected individuals, particularly males. We investigated sex-based differences in the HCC genome and antitumor immunity.

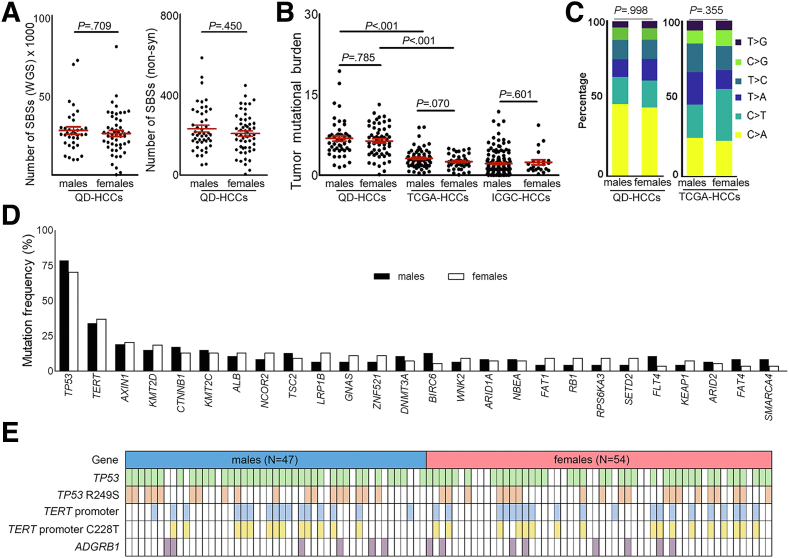
Methods: Whole-genome, whole-exome, and RNA sequencing were performed on 101 HCC patient samples (47 males, 54 females) that resulted from HBV infection and aflatoxin exposure from Qidong. Androgen on the expression of aflatoxin metabolism-related genes and nonhomologous DNA end joining (NHEJ) factors were examined in HBV-positive HCC cell lines, and further tested in tumor-bearing syngeneic mice.

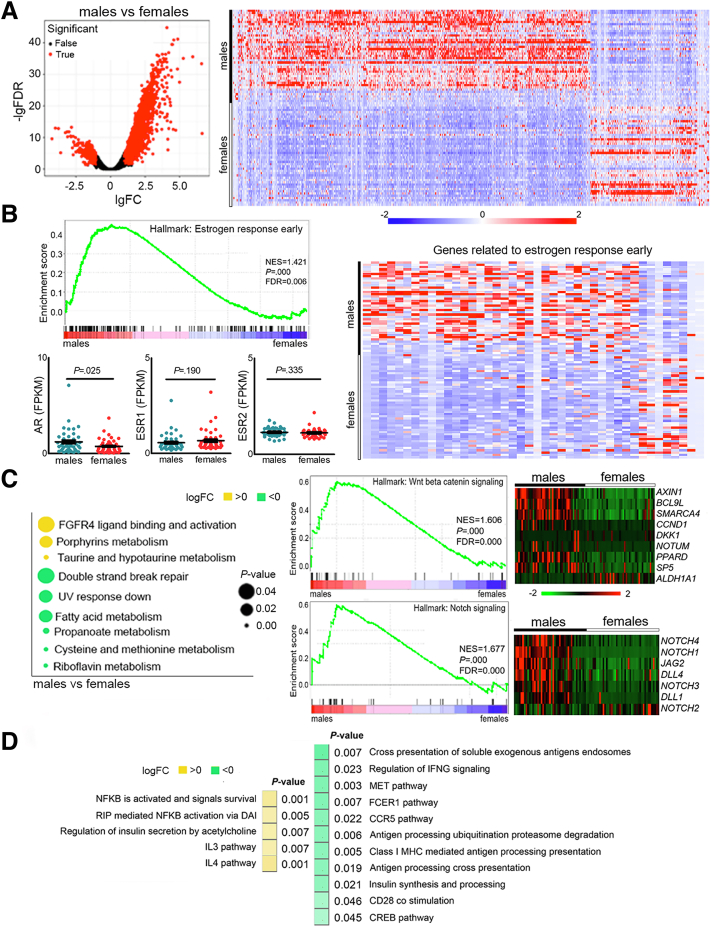
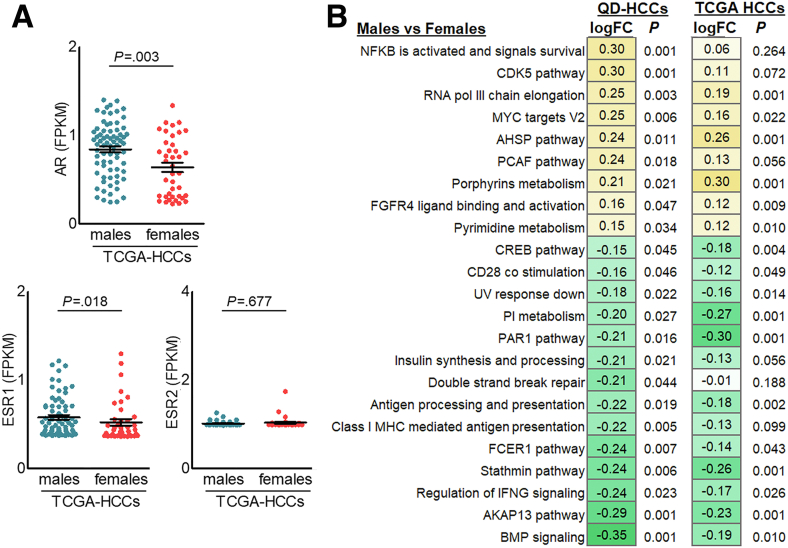
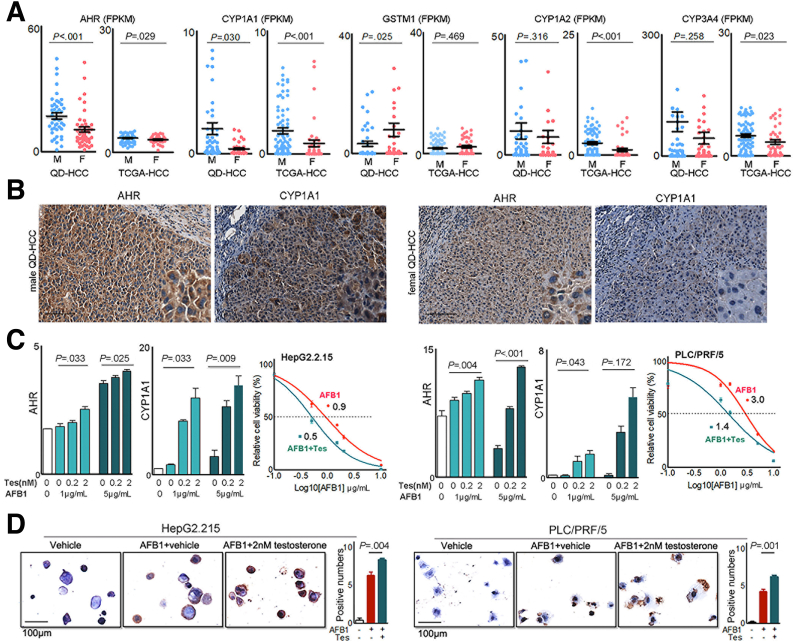
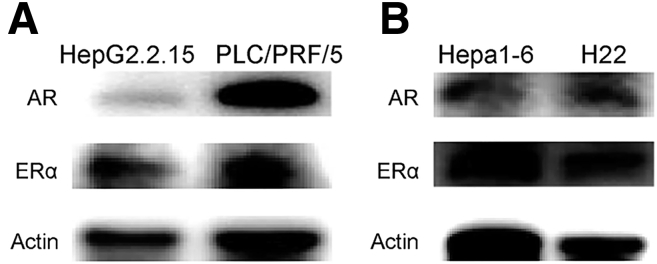
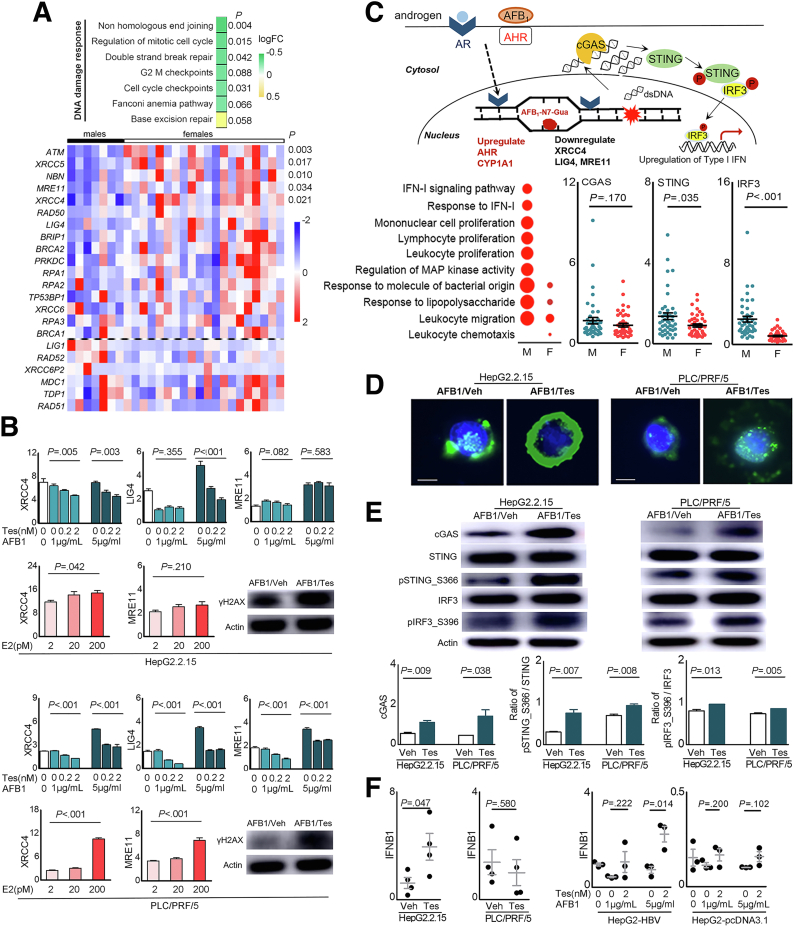
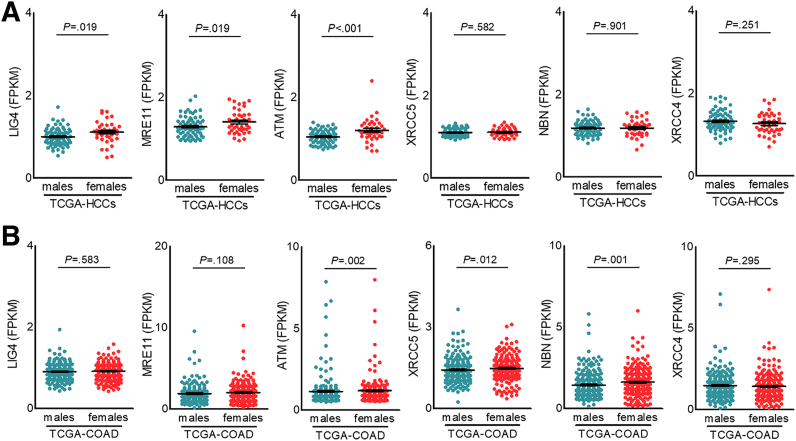
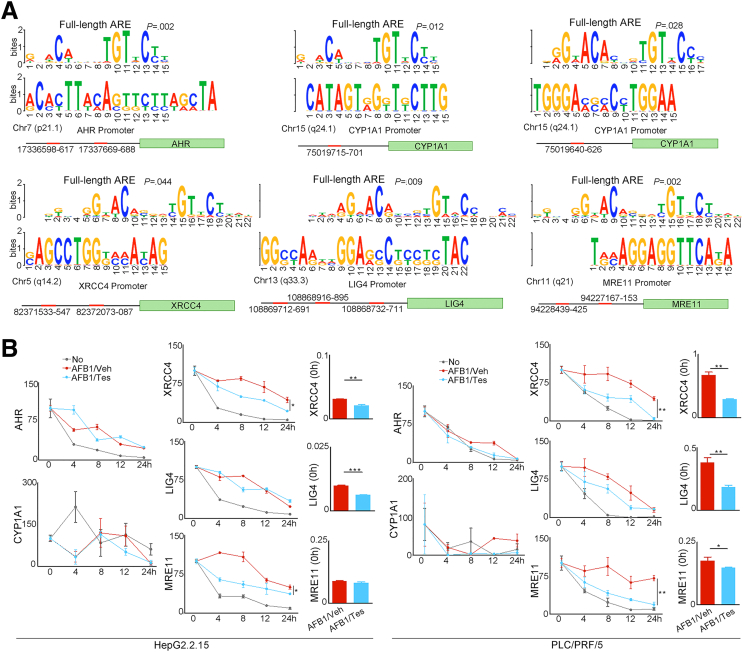
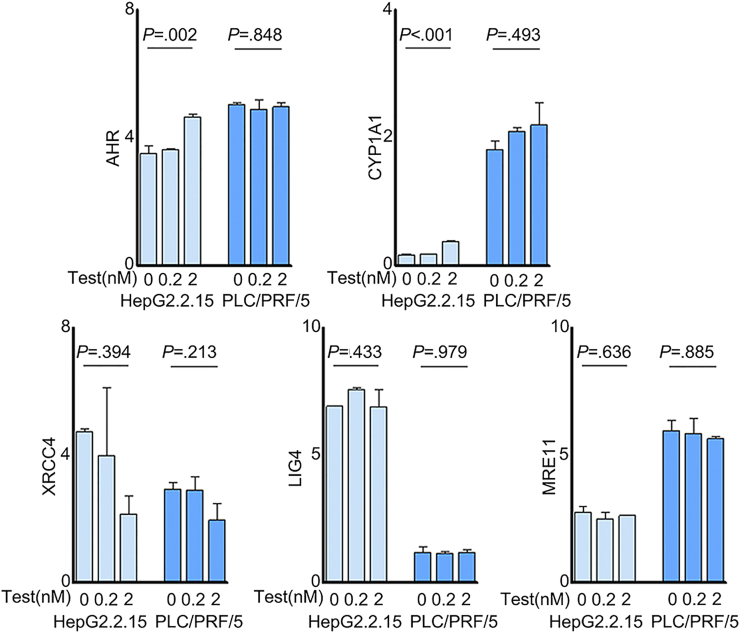
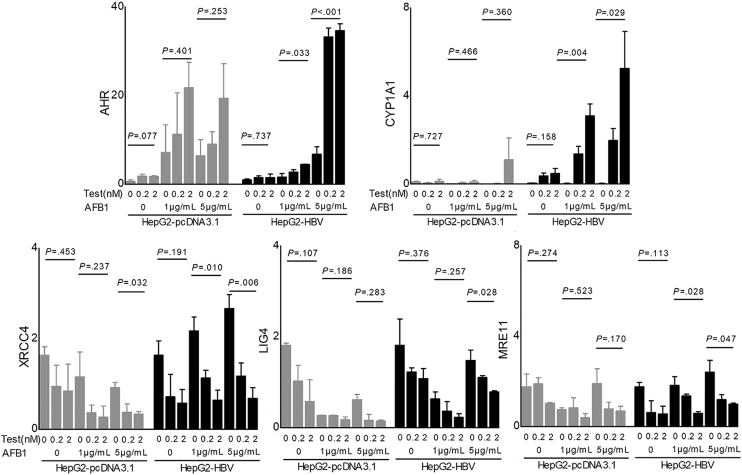
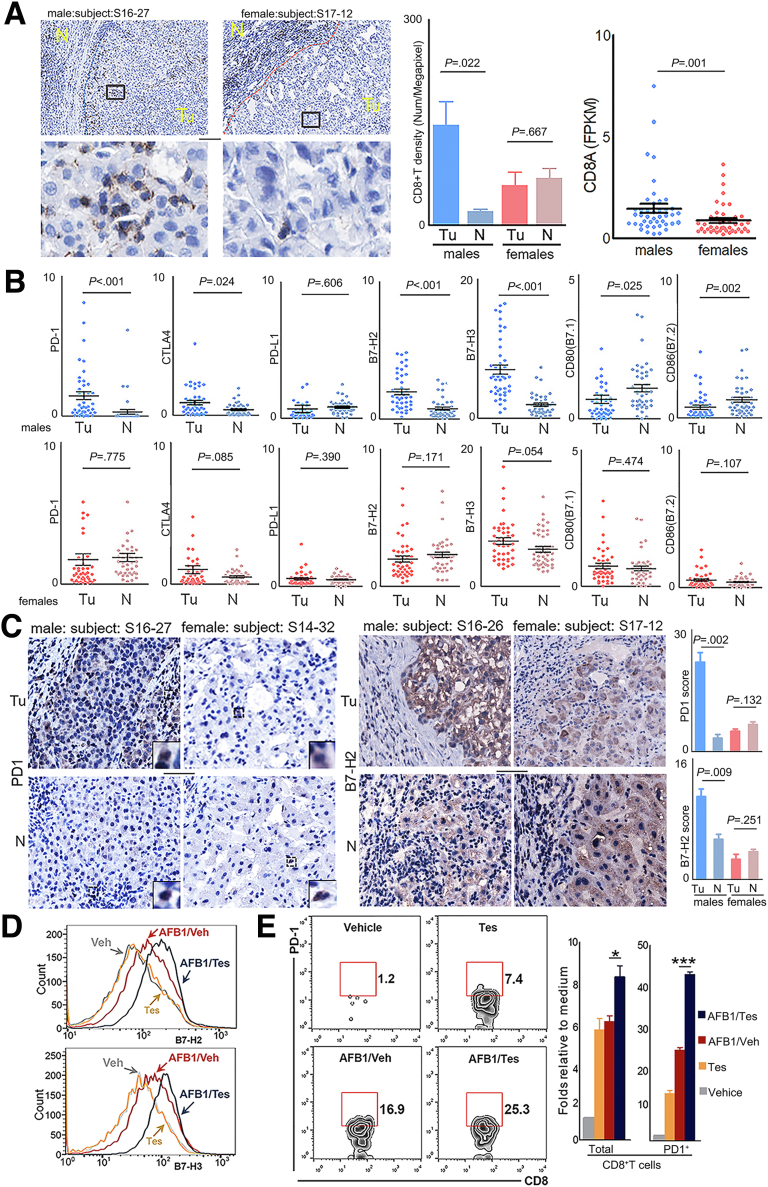
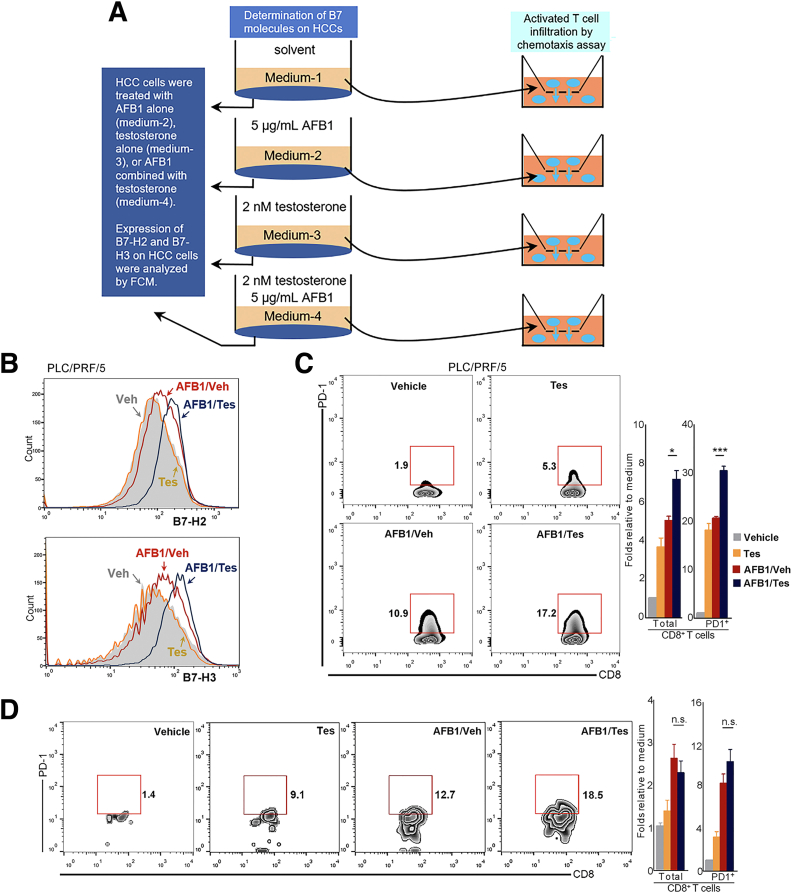
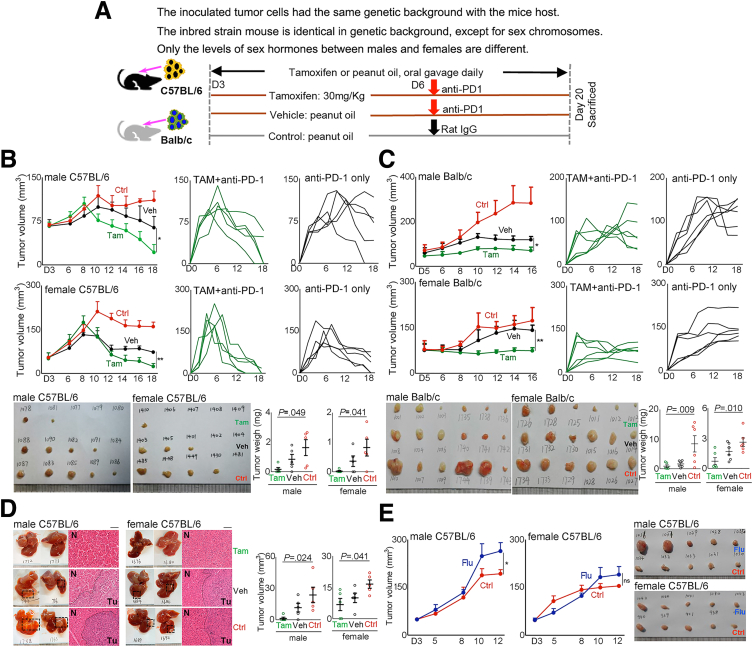
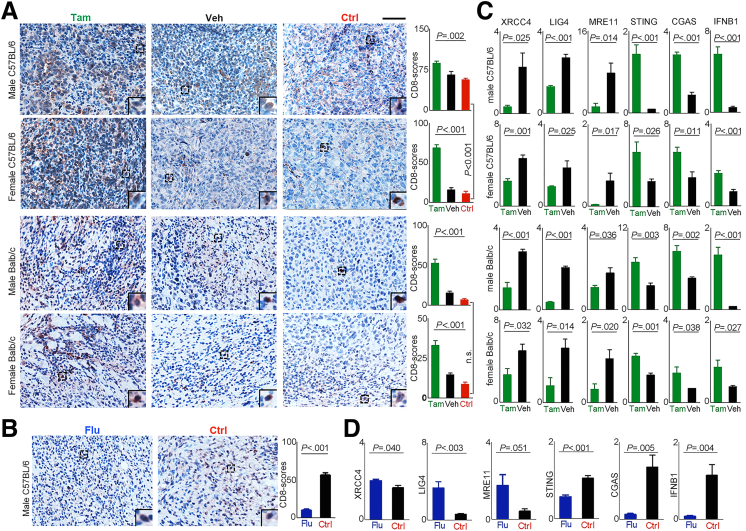
Results: Qidong HCC differed between males and females in genomic landscape and transcriptional dysfunction pathways. Compared with females, males expressed higher levels of aflatoxin metabolism-related genes, such as AHR and CYP1A1, and lower levels of NHEJ factors, such as XRCC4, LIG4, and MRE11, showed a signature of up-regulated type I interferon signaling/response and repressed antitumor immunity. Treatment with AFB1 in HBV-positive cells, the addition of 2 nmol/L testosterone to cultures significantly increased the expression of aflatoxin metabolism-related genes, but reduced NHEJ factors, resulting in more nuclear DNA leakage into cytosol to activate cGAS-STING. In syngeneic tumor-bearing mice that were administrated tamoxifen daily via oral gavage, favorable androgen signaling repressed NHEJ factor expression and activated cGAS-STING in tumors, increasing T-cell infiltration and improving anti-programmed cell death protein 1 treatment effect.

Conclusions: Androgen signaling in the context of genotoxic stress repressed DNA damage repair. The alteration caused more nuclear DNA leakage into cytosol to activate the cGAS-STING pathway, which increased T-cell infiltration into tumor mass and improved anti-programmed cell death protein 1 immunotherapy in HCCs.

Keywords: Aflatoxin; DNA Double-Strand Break; HBV; Immune Checkpoints; Sex Hormones.


Figures

Figure 1
Figure 1
Mutation patterns and mutational burden in male and female QD-HCCs. (A) Mutation counts in the whole genome or exome of male and female QD-HCCs. (B) TMB of QD-HCCs, or TCGA-HCCs (73 males, 40 females), or Chinese HCC samples (159 males, 22 females) in the International Cancer Genome Consortium (ICGC) database (ICGC-HCCs). Data present means ± SEM. P values were calculated by the Mann–Whitney test. (C) Percentage of the 6 variant types in the exome of QD-HCCs and TCGA-HCCs. The P value was calculated by chi-squared test. (D) Reported HCC driver genes with more than 5% mutation frequencies in male and female QD-HCCs (P > .05, chi-squared test). (E) Mutations of TP53, TERT promoter, and ADGRB1 in male and female QD-HCCs. SBS, single-base substitution.
Figure 2
Figure 2
Mutation profile and HBV integration in male and female QD-HCCs. (A) Twelve genes with significantly different mutation frequencies between the 2 sexes with P < .02 are listed, the others are provided in Table 4. P values were calculated by the chi-squared test or the Fisher exact test. Distribution of HBV breakpoints across the (B) HBV genome and the (C) human genome. P values were calculated by the chi-squared test. (D) Functional annotation of integration-targeted genes in male and female samples analyzed by DAVID. AFP, α-fetoprotein; bp, base pair; C, core gene; Del, deletion; Ins, insertion; P, polymerase gene; S, surface antigen genes; X, X gene.
Figure 3
Figure 3
The association of specified gene mutations and survival of QD-HCC patients. The Kaplan–Meier method was used for survival analysis. Poor survival was observed in (A) male patients, but not in (B) female patients. No mutation of ANP32E and ATXN2 was detected in female QD-HCC samples.
Figure 4
Figure 4
HBV integration in the 2 sexes. (A) Number of HBV breakpoints in male and female QD-HCC samples. Data represent means ± SEM. The P value was calculated by the Mann–Whitney test. (B) Distribution of HBV breakpoints across the HBV genome in 83 HBV-related HCCs with no record of aflatoxin exposure. bp, base pair; C, core gene; DR, direct repeat ; P, polymerase gene; S, surface antigen genes; X, X gene.
Figure 5
Figure 5
Expression patterns of male and female QD-HCCs. (A) DEGs between 43 male QD-HCC and 44 female QD-HCCs were identified with fold change greater than 2 and false discovery rate (FDR) less than 0.05. Gene expression in tumor tissues was normalized by matched non-neoplastic liver samples. (B) Expression levels of AR, ESR1, ESR2, and the genes related to the estrogen response early pathway in male and female QD-HCCs. (C) Expression of the genes related to multiple biological capabilities in male and female QD-HCCs. (D) Sex differences in gene expression related to inflammation and adaptive immune responses in male and female QD-HCCs. CCR5, C-C motif chemokine receptor 5; CREB, cAMP responsive element binding protein; DAI, DNA-dependent activator of IFN-regulatory factors; FCER1, fc ε receptor 1; FGFR4, fibroblast growth factor receptor 4; FPKM, fragments per kilobase of transcript per million fragments mapped; IFNG, interferon γ; IgFC, log2 fold change; IL, interleukin; logFC, log2 fold change; MET, mesenchymal-epithelial transition; MHC, major histocompatibility complex; NES, normalized enrichment score; NFκB, nuclear factor-κB; RIP, receptor interacting protein.
Figure 6
Figure 6
Sex differences in gene expression of HBV-related TCGA-HCCs. (A) The expression levels of AR and ESR1, ESR2. Each dot represents 1 case. (B) The expression of gene sets involved in specified pathways in QD-HCCs and in TCGA-HCCs. The yellow boxes with positive numbers indicate the pathways were up-regulated, the green boxes with negative numbers indicate the pathways were down-regulated in male HCCs compared with female HCCs. AHSP, α-hemoglobin stabilizing protein; AKAP13, a-kinase anchoring protein 13; BMP, bone morphogenetic protein; CDK5, cyclin-dependent kinase-5; CREB, cAMP responsive element binding protein; FCER1, fc ε receptor 1; FGFR4, fibroblast growth factor receptor 4; FPKM, fragments per kilobase of transcript per million fragments mapped; IFNG, interferon γ; logFC, log2 fold change; MHC, major histocompatibility complex; MYC, myelocytomatosis oncogene; NFκB, nuclear factor-κB; PAR1, protease-activated receptor-1; PCAF, p300/CBP-associating factor; pol III, RNA polymerase III; V2, version 2.
Figure 7
Figure 7
Sex hormones on gene expression related to aflatoxin metabolism. (A) Expression levels of the genes in QD-HCCs and TCGA-HCCs. (B) Expression of AHR and CYP1A1 determined by immunohistochemistry in QD-HCCs. Shown are the representatives from 10 male samples and 10 female samples. Scale bar: 100 μm. (C) Bar graphs show AHR and CYP1A1 expression levels in HepG2.2.15 (left) and PLC/PRF/5 (right) in the presence of different concentrations of testosterone after AFB1 treatment, determined by real-time quantitative polymerase chain reaction. Glyceraldehyde-3-phosphate dehydrogenase was used as control. The curves show AFB1 toxicity on HepG2.2.15 (left) and PLC/PRF/5 (right) in the presence of 2 nmol/L testosterone (blue lines, AFB1+Tes) or AFB1 only (red lines, AFB1). (D) Images show the AFB1–DNA adducts (brown) in HepG2.2.15 (left) and PLC/PRF/5 (right) detected by immunohistochemistry, after AFB1 treatment only (AFB1+vehicle) or in the presence of 2 nmol/L testosterone (AFB1+Tes). Bar graphs indicate the average AFB1–DNA positive numbers every 10 cells in 5 fields of 3 independent experiments. F, female; FPKM, fragments per kilobase of transcript per million fragments mapped; M, male.
Figure 8
Figure 8
Expression of AR and ERα incell lines by immunoblot. Images show 1 representative of 2 independent experiments in (A) human HCC cell lines and (B) mice hepatoma cell lines, with actin as the loading control.
Figure 9
Figure 9
Sex hormones on expression of the genes related to DNA damage responses and cGAS-STING activation. (A) The NHEJ pathway genes differentially expressed in male and female QD-HCCs that were confirmed with HBV integration. (B) Bar graphs show transcriptional levels of some NHEJ genes in HepG2.2.15 cells and PLC/PRF/5 cells that were treated with AFB1 in the presence of different concentrations of Tes, or 17β-estradiol (E2), determined by real-time quantitative polymerase chain reaction with glyceraldehyde-3-phosphate dehydrogenase as control. Images show the γH2AX expression in total cellular proteins analyzed by immunoblot of 3 independent experiments. (C) The schematic effects of AFB1 plus androgen on HCC cells. Graphs show the results of QD-HCC samples. The augmented genes related to innate immune responses analyzed by Gene Ontology are shown in the bubble graph. Bubble sizes indicate variated numbers of related genes in the specified pathway, the biggest includes 25 genes and the smallest includes 4 genes. Scatter plots show the specified genes expressed in male and female QD-HCCs. (D and E) HepG2.2.15 cells and PLC/PRF/5 cells were treated for 72 hours with AFB1 (CC50 concentration) plus 2 nmol/L testosterone (AFB1/Tes) or with the same concentration of AFB1 alone (AFB1/Veh). (D) Representative images (×400) show the cytosolic double-strand DNA analyzed by fluorescent microscopy. Scale bars: 10 μm. (E) Analysis of cGAS-STING pathway activation in differently treated HepG2.2.15 cells and PLC/PRF/5 cells by immunoblot. Images show 1 representative of 3 independent experiments, with actin as the loading control. Bar graphs show the band density of the specific genes. (F) The transcriptional levels of interferon β (IFNB1) in the cells of HepG2.2.15, PLC/PRF/5, and HepG2 transfected with 1.3 × HBV plasmid (HepG2-HBV) or empty-vector (HepG2-pcDNA3.1), described in PMID: 36058909. All cells were treated as described in panel E, with glyceraldehyde-3-phosphate dehydrogenase as control. Data represent means ± SEM. Each dot represents 1 independent experiment. P values were calculated by an unpaired Student t test. logFC, log2 fold change.
Figure 10
Figure 10
Transcription levels of specified NHEJ genes of some types of cancers in TCGA database. The specified NHEJ gene expression in (A) 73 male and 40 female HBV-related HCC samples in (B) 247 male and 224 female colon adenocarcinoma samples. Data represent means ± SEM. P values were calculated by an unpaired Student t test or the Mann–Whitney test. FPKM, fragments per kilobase of transcript per million fragments mapped.
Figure 11
Figure 11
Predicted AREs in the promoters of specified genes and the half-lives of these genes in HCC cell lines after different treatment. (A) The predicted AREs in the promoter areas of AHR, CYP1A1, XRCC4, LIG4, and MRE11 analyzed with web-based MEME Suite (http://meme-suite.org). (B) Based on the determined AFB1 CC50, the HepG2.2.15 cells were treated with 0.5 μg/mL AFB1, PLC/PRF/5 with 1.4 μg/mL AFB1 plus 2 nmol/L testosterone (AFB1/Tes), or the same concentration of AFB1 alone (AFB1/Veh) for 72 hours. The cells with medium only (No) was used as control. Each treatment was performed in triplicate. Actinomycin D at 5 μg/mL then was added for the indicated period (0, 4, 8, 12, and 24 hours). Transcriptional levels of XRCC4, LIG4, and MRE11 were determined using real-time quantitative polymerase chain reaction, with glyceraldehyde-3-phosphate dehydrogenase as control. One of 2 independent experiments is shown. Chr, chromosome.
Figure 12
Figure 12
Transcription levels of some aflatoxin metabolism-related genes and NHEJ factors in differently treated HepG2.2.15 and PLC/PRF/5 cells. The cells were treated with the indicated concentration of testosterone for 72 hours and gene expression was determined by real-time quantitative polymerase chain reaction with glyceraldehyde-3-phosphate dehydrogenase as control. Data represent means ± SEM. P values were calculated by 1-way analysis of variance.
Figure 13
Figure 13
Transcription levels of the specified genes in transiently HBV-transfected HepG2 cells. HepG2 cells were transfected with a plasmid containing 1.3 × HBV genome (HepG2-HBV) or with an empty-vector (HepG2-pcDNA3.1), followed by treatment with the indicated concentration of AFB1 and testosterone for 72 hours. The gene expression was determined by real-time quantitative polymerase chain reaction with glyceraldehyde-3-phosphate dehydrogenase as control. Data represent means ± SEM. P values were calculated by 1-way analysis of variance. The information for 2 plasmids is described in PMID: 36058909.
Figure 14
Figure 14
Infiltration of CD8+T cells and expression levels of different immune checkpoint molecules in male and female QD-HCCs. (A) Images show the representative staining of CD8+ T cells (brown) of 5 male QD-HCCs, and 5 female QD-HCCs, with the average of CD8+ T-cell density presented in the bar graph. Scale bar: 10 μm. Scatter plots indicate the tumor expression levels of CD8α related to matched non-neoplastic tissues in 43 male QD-HCCs and 44 female QD-HCCs, determined by RNA-seq. Each dot represents 1 case. (B) Expression levels of the specified molecules in QD-HCCs. Each dot represents 1 case. (C) Representative images of PD-1 (left panel) and B7-H2 (right panel) detected by immunohistochemistry staining in tumor and adjacent non-neoplastic tissues of 5 male QD-HCCs and 5 female QD-HCCs, with the average scores of PD-1 and B7-H2 presented in the bar graphs. Scale bar: 100 μm. (D) Surface expression of B7-H2 and B7-H3 in HepG2.2.15 cells treated for 72 hours with 2 nmol/L testosterone only (Tes, yellow lines), 5 μg/mL of AFB1 alone (AFB1/Veh, red lines), and 5 μg/mL of AFB1 plus 2 nmol/L testosterone (AFB1/Tes, blue lines). Grey lines are the staining of cells treated with vehicle. The profiles of B7-H2 and B7-H3 in PLC/PRF/5 are shown in Figure 15B. (E) Contoured plots show the staining of T cells migrated into the lower chambers of the Transwell insert (5-μm pore size) in a chemotaxis assay using the conditioned medium collected from differently treated HepG2.2.15 cells. The results of differently treated PLC/PRF/5 cells are provided in Figure 15C. Bar graphs indicate the average of migrated CD8+ T cells calculated from 3 independent experiments. ∗P ≤ .05, ∗∗∗P ≤ .001. FPKM, fragments per kilobase of transcript per million fragments mapped; N, non-neoplastic tissue; Tu, tumor tissue.
Figure 15
Figure 15
Determination of the effects of differently treated HepG2.2.15 and PLC/PRF/5 cells on T-cell infiltration. (A) The schematic diagram of experiments. HBV-positive HepG2.2.15 cells or PLC/PRF/5 cells were differently treated for 72 hours as shown. (B) Shown is the surface expression of B7-H2 and B7-H3 in PLC/PRF/5 cells treated with AFB1 plus testosterone (AFB1/Tes) or with the same concentration of AFB1 alone, or with the testosterone alone (Tes). The controls were the cells treated with 0.1% dimethyl sulfoxide plus 0.1% ethanol (Veh, shade profile). (C) The T cells that had migrated into the lower chambers of the Transwell inserts (5-μm pore size) in response to the CM derived from differently treated PLC/PRF/5 cells. Contoured plots show the staining of the T cells in 1 of 3 chemotaxis assays using 3 healthy males. Bar graphs indicate the average of migrated CD8+ T cells calculated from 3 independent experiments. (D) The chemotaxis effect of chemical AFB1 or testosterone or their combination on T cells. The assay was conducted in parallel with the chemicals and differently treated HepG2.2.15 cell–derived CM using the same males. Flow cytometry profiles show 1 of 3 representative independent male donors and the bar graph shows the average of them. ∗P ≤ .05, ∗∗∗P ≤ .001.
Figure 16
Figure 16
Favorable androgen pathway enhanced anti–PD-1 effects to eradicate established tumors. (A) Experimental scheme. In each C57BL/6 mouse, 5 × 106 Hepa1–6 cells were inoculated subcutaneously, 2 × 106 cells into the left lobe of the liver. In each Balb/c mouse, 5 × 104 H22 cells were inoculated subcutaneously. A palpable tumor mass formed 3 days after cell inoculation, the mice in the tamoxifen group (Tam) received tamoxifen (30 mg/kg) dissolved in peanut oil, the vehicle group (Veh) received the same amounts of peanut oil daily by oral gavage until scarification. Anti–PD-1 (100 μg/mouse) was injected intraperitoneally 3 days after tamoxifen or peanut oil. Control (Ctrl) mice were administered peanut oil and rat IgG at the same time points. C57BL/6 mice that were injected subcutaneously with tumor cells also received flutamide (300 mg/kg, Flu) dissolved in peanut oil without administration of anti–PD-1. (B and C) Shown are 1 of 2 independent experiments. Left: Tumor volumes at different time points of variated groups. Middle and Right: Tumor growth in an individual mouse in the tamoxifen group (Tam + anti–PD-1) and the vehicle group (anti–PD-1 only), respectively. Images are the removed tumors in the mice that were killed on day 20. Scatter plot shows the tumor weights (means ± SEM), each dot represents 1 mouse. P values were calculated by 1-way analysis of variance. (D) Shown are the representative liver images of C57BL/6 mice that were inoculated with Hepa1–6 cells and were killed 20 days after tumor injection. Graphs show the average liver tumor volume (means ± SEM). Each dot represents 1 mouse, n = 5 per group. (E) Hepa1–6 cells were inoculated subcutaneously into C57BL/6 mice that were administered flutamide on day 3. Graphs show the tumor volumes (means ± SEM) at different time points of variated groups, n = 5 per group. Images are the removed tumor in the mice killed on day 15. The handwritten numbers in images indicate mice identification. ∗P ≤ .05, ∗∗P ≤ .01. N, non-neoplastic tissue; Tu, tumor tissue.
Figure 17
Figure 17
Favorable androgen signaling enhanced the infiltration of T cells and activation of cGAS-STING in established tumor. (A) Representative images of CD8+ T cells (brown) detected in the removed tumor tissues of the tamoxifen group (Tam), vehicle group (Veh), and control-group (Ctrl). Scale bar: 100 μm. The graphs showed average scores of CD8+ T cells calculated from the group of mice (n = 5). Data present means ± SEM. P values were calculated by 1-way analysis of variance. (B) Representative images of CD8+ T cells (brown) detected in the removed tumor tissues from male C57BL/6 mice received flutamide (Flu), and peanut oil only (Ctrl). Graph shows the CD8+ T-cell scores (means ± SEM) calculated from the group of mice (n = 5). P values were calculated by an unpaired Student t test. (C and D) Shown are the expression levels of genes in the NHEJ and cGAS-STING pathways calculated from 5 mice from a specified group determined by real-time quantitative polymerase chain reaction. Data present means ± SEM. P values were calculated by an unpaired Student t test. IFNB, interferon β.

References

    1. Kulik L., El-Serag H.B. Epidemiology and management of hepatocellular carcinoma. Gastroenterology. 2019;156:477–491. - PMC - PubMed
    1. Haupt S., Caramia F., Klein S.L., Rubin J.B., Haupt Y. Sex disparities matter in cancer development and therapy. Nat Rev Cancer. 2021;21:393–407. - PMC - PubMed
    1. Wu M.H., Ma W.L., Hsu C.L., Chen Y.L., Ou J.H., Ryan C.K., Hung Y.C., Yeh S., Chang C. Androgen receptor promotes hepatitis B virus-induced hepatocarcinogenesis through modulation of hepatitis B virus RNA transcription. Sci Transl Med. 2010;2:32ra5. - PMC - PubMed
    1. Wang S.H., Yeh S.H., Lin W.H., Yeh K.H., Yuan Q., Xia N.S., Chen D.S., Chen P.J. Estrogen receptor alpha represses transcription of HBV genes via interaction with hepatocyte nuclear factor 4alpha. Gastroenterology. 2012;142:989–998 e4. - PubMed
    1. Nault J.C., Martin Y., Caruso S., Hirsch T.Z., Bayard Q., Calderaro J., Charpy C., Copie-Bergman C., Ziol M., Bioulac-Sage P., Couchy G., Blanc J.F., Nahon P., Amaddeo G., Ganne-Carrie N., Morcrette G., Chiche L., Duvoux C., Faivre S., Laurent A., Imbeaud S., Rebouissou S., Llovet J.M., Seror O., Letouze E., Zucman-Rossi J. Clinical impact of genomic diversity from early to advanced hepatocellular carcinoma. Hepatology. 2020;71:164–182. - PubMed