. 2022 Oct 22;13(1):6303.
doi: 10.1038/s41467-022-34110-1.

REDD1 promotes obesity-induced metabolic dysfunction via atypical NF-κB activation

Affiliations

REDD1 promotes obesity-induced metabolic dysfunction via atypical NF-κB activation

Dong-Keon Lee et al. Nat Commun. .

Abstract

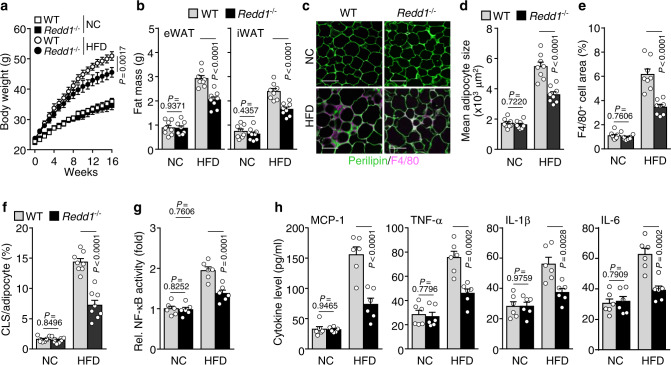
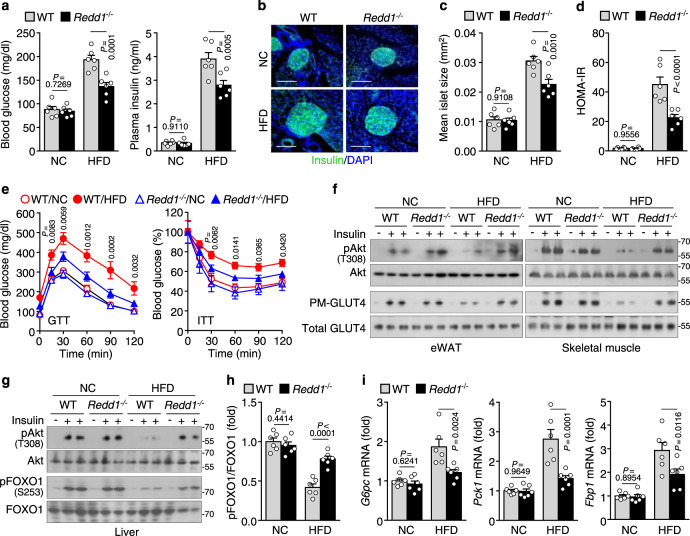
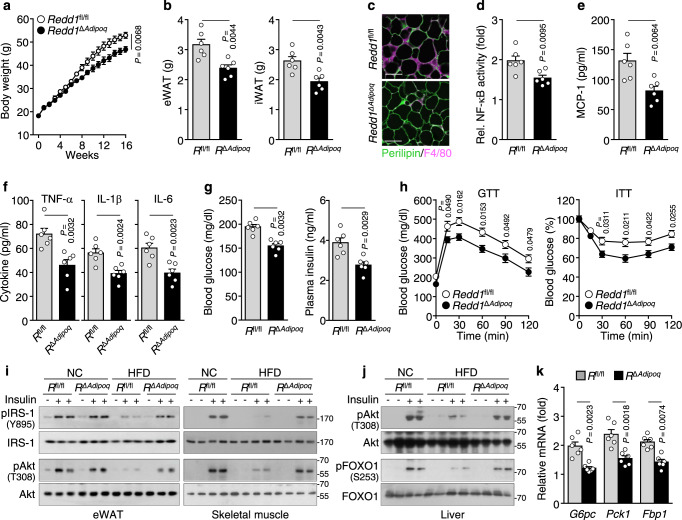
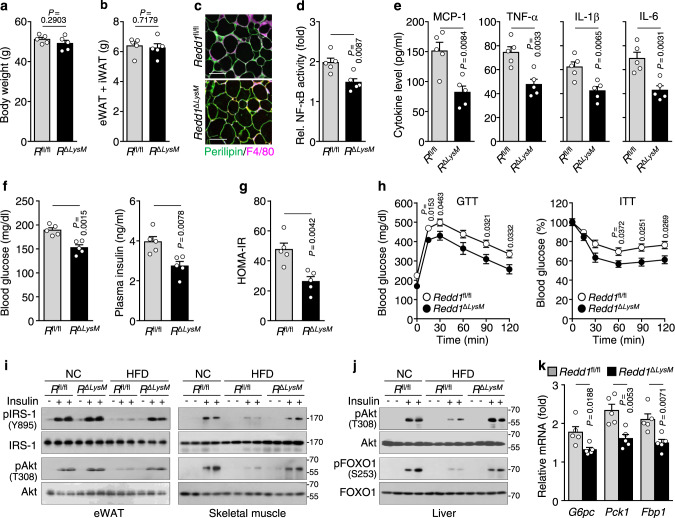
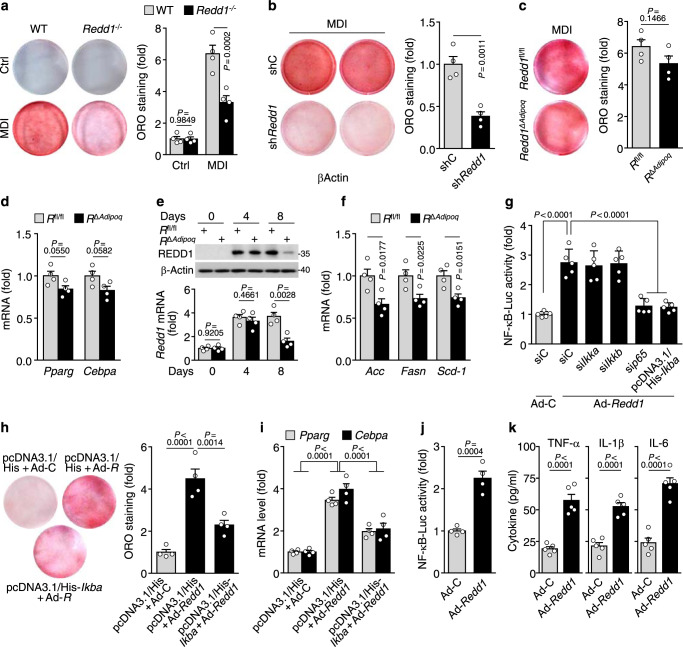
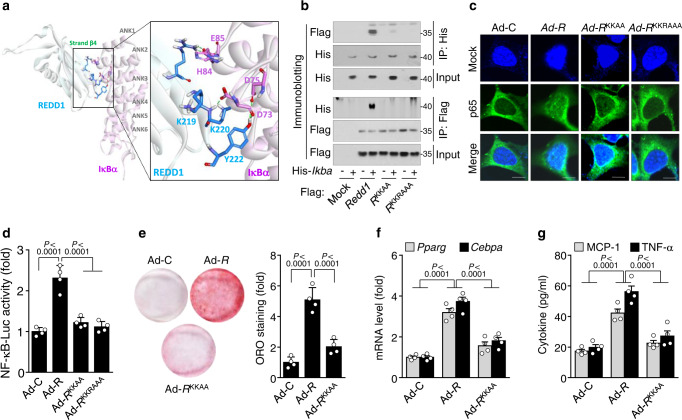
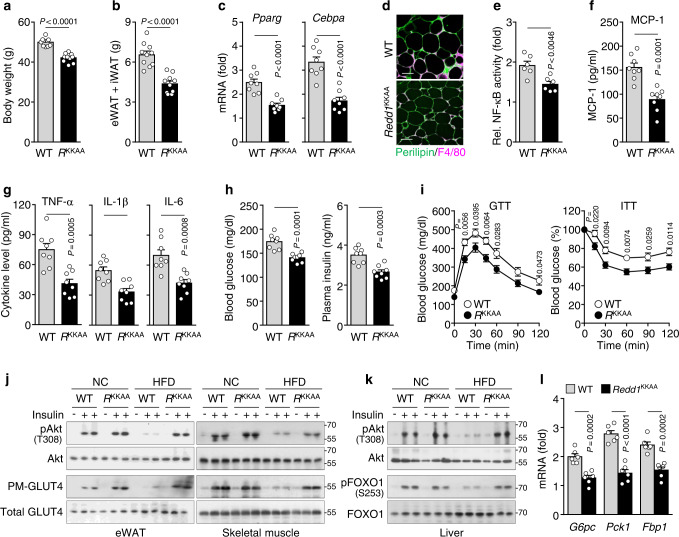
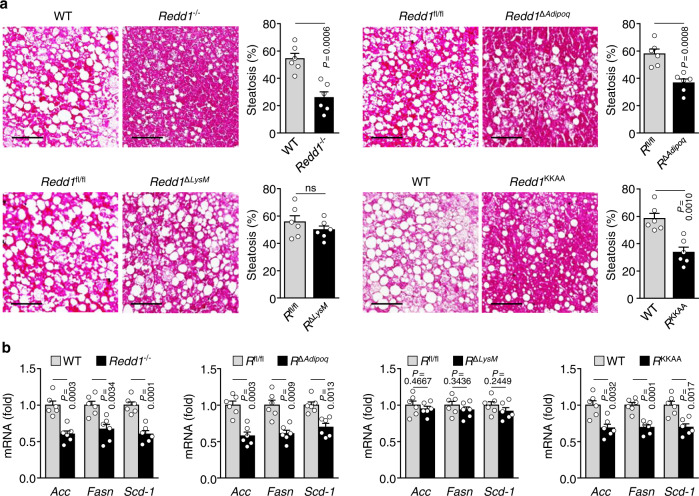
Regulated in development and DNA damage response 1 (REDD1) expression is upregulated in response to metabolic imbalance and obesity. However, its role in obesity-associated complications is unclear. Here, we demonstrate that the REDD1-NF-κB axis is crucial for metabolic inflammation and dysregulation. Mice lacking Redd1 in the whole body or adipocytes exhibited restrained diet-induced obesity, inflammation, insulin resistance, and hepatic steatosis. Myeloid Redd1-deficient mice showed similar results, without restrained obesity and hepatic steatosis. Redd1-deficient adipose-derived stem cells lost their potential to differentiate into adipocytes; however, REDD1 overexpression stimulated preadipocyte differentiation and proinflammatory cytokine expression through atypical IKK-independent NF-κB activation by sequestering IκBα from the NF-κB/IκBα complex. REDD1 with mutated Lys219/220Ala, key amino acid residues for IκBα binding, could not stimulate NF-κB activation, adipogenesis, and inflammation in vitro and prevented obesity-related phenotypes in knock-in mice. The REDD1-atypical NF-κB activation axis is a therapeutic target for obesity, meta-inflammation, and metabolic complications.


Conflict of interest statement

The authors declare no competing interests.

Figures

Fig. 1
Fig. 1. Redd1−/− mice are protected against HFD-induced weight gain and adipose tissue expansion.
a Weight gain in Redd1−/− mice and their WT littermates fed NC or HFD for 16 weeks (n = 6 per group). b Mass of eWAT and iWAT in NC- or HFD-fed Redd1−/− mice and their WT littermates (n = 8 per group). c Representative images of perilipin (green) and F4/80 (purple) staining in the eWAT of NC- or HFD-fed Redd1−/− mice and WT littermates (n = 8 per group). Scale bar, 100 μm. d Average adipocyte size in the eWAT of NC- or HFD-fed Redd1−/− mice and WT littermates (n = 8 per group). e Relative area of F4/80-positive cells in the eWAT of NC- or HFD-fed Redd1−/− mice and WT littermates (n = 8 per group). f Relative number of crown-like structures (CLSs) in the eWAT of NC- or HFD-fed Redd1−/− mice and WT littermates (n = 8 per group). g NF-κB activity in the eWAT from NC- or HFD-fed Redd1−/− mice and WT littermates (n = 6 per group). h Plasma levels of inflammatory cytokines in NC- or HFD-fed Redd1−/− mice and WT littermates (n = 6 per group). Bar graphs represent mean ± s.e.m. Statistical significance was calculated using two-way ANOVA followed by the Holm–Sidak post hoc test. Source data are provided as a Source Data file.
Fig. 2
Fig. 2. Redd1−/− mice are protected against HFD-induced metabolic dysregulation.
a Fasting plasma levels of glucose and insulin in NC- or HFD-fed Redd1−/− mice and their WT littermates (n = 6 per group). b Representative images of insulin (green)-stained pancreatic islets from NC- or HFD-fed Redd1−/− mice and WT littermates (n = 6 per group). Scale bar, 100 μm. c Quantification of average islet size (n = 6 per group). d Calculation of the HOMA-IR scores (n = 6 per group). e Assessment of GTT and ITT in mice fasting for 12 and 6 h, respectively, in NC- or HFD-fed Redd1−/− mice and WT littermates (n = 8 per group). f Representative western blots of Akt phosphorylation and plasma membrane-associated GLUT4 (PM-GLUT4) in eWAT and skeletal muscle from mice injected i.p. with saline or insulin (n = 3). g Representative western blots of phosphorylated Akt and FOXO1 in the liver of mice injected with saline or insulin (n = 6). h Quantification of the phosphorylated FOXO1 to total FOXO1 ratio (n = 6 per group). i Quantification of G6pc, Pck1, and Fbp1 mRNA levels in the liver (n = 6 per group). Bar graphs represent mean ± s.e.m. Statistical significance was calculated using two-way ANOVA followed by the Holm–Sidak post hoc test. Source data are provided as a Source Data file.
Fig. 3
Fig. 3. Adipocyte Redd1 deletion prevents HFD-induced obesity and inflammation.
a Weight gain over time in Redd1fl/fl (Rfl/fl) and Redd1ΔAdipoq (RΔAdipoq) mice fed HFD for 16 weeks (n = 6 per group). b Mass measurements for the eWAT and iWAT in HFD-fed Redd1fl/fl and Redd1ΔAdipoq mice (n = 6 per group). c Representative images showing perilipin (green) and F4/80 (purple) staining in the eWAT of Redd1fl/fl and Redd1ΔAdipoq mice fed HFD (n = 6 per group). Scale bar, 100 μm. d NF-κB activity in the eWAT from HFD-fed Redd1fl/fl and Redd1ΔAdipoq mice (n = 6 per group). e, f Plasma levels of inflammatory cytokines in HFD-fed Redd1fl/fl and Redd1ΔAdipoq mice (n = 6 per group). g Fasting plasma levels of glucose and insulin in HFD-fed Redd1fl/fl and Redd1ΔAdipoq mice (n = 6 per group). h Assessment of GTT and ITT in HFD-fed Redd1fl/fl and Redd1ΔAdipoq mice after fasting for 12 and 6 h, respectively (n = 5 per group). i, j Representative western blots of phosphorylated IRS-1 and Akt in the eWAT and skeletal muscle (i) and phosphorylated Akt and FOXO1 in the liver (j) of NC- or HFD-fed Redd1fl/fl and Redd1ΔAdipoq mice after i.p. injection of saline or insulin (n = 3). k Relative expression levels of G6pc, Pck1, and Fbp1 in the liver of HFD-fed Redd1fl/fl and Redd1ΔAdipoq mice compared with NC-fed mouse groups (n = 6 per group). Bar graphs represent mean ± s.e.m. Statistical significance was calculated using an unpaired two-tailed t-test. Source data are provided as a Source Data file.
Fig. 4
Fig. 4. Myeloid Redd1 deficiency prevents HFD-induced meta-inflammation and metabolic dysregulation.
a Weight gain in Redd1fl/fl (Rfl/fl) and Redd1ΔLysM (RΔLysM) mice fed HFD for 16 weeks (n = 5 per group). b Measurement of fat (eWAT + iWAT) mass in HFD-fed Redd1fl/fl and Redd1ΔLysM mice (n = 5 per group). c Representative images showing perilipin (green) and F4/80 (purple) staining in the eWAT of HFD-fed Redd1fl/fl and Redd1ΔLysM mice (n = 5 per group). Scale bar, 100 μm. d NF-κB activity in the eWAT from HFD-fed Redd1fl/fl and Redd1ΔLysM mice (n = 5 per group). e Plasma levels of inflammatory cytokines in HFD-fed Redd1fl/fl and Redd1ΔLysM mice (n = 5 per group). f Fasting plasma levels of glucose and insulin in HFD-fed Redd1fl/fl and Redd1ΔLysM mice (n = 5 per group). g Calculation of HOMA-IR scores in HFD-fed Redd1fl/fl and Redd1ΔLysM mice (n = 5 per group). h Assessment of GTT and ITT in HFD-fed Redd1fl/fl and Redd1ΔLysM mice fasting for 12 and 6 h, respectively (n = 5 per group). i, j Representative western blots of the insulin-responsive phosphorylation of IRS-1 and Akt in the eWAT and skeletal muscle (i) and phosphorylation of Akt and FOXO1 in the liver (j) of NC- or HFD-fed Redd1fl/fl and Redd1ΔLysM mice (n = 3). k Relative expression levels of G6pc, Pck1, and Fbp1 in the liver of HFD-fed Redd1fl/fl and Redd1ΔLysM mice compared with NC-fed mouse groups (n = 5 per group). Bar graphs represent mean ± s.e.m. Statistical significance was calculated using an unpaired two-tailed t-test. Source data are provided as a Source Data file.
Fig. 5
Fig. 5. REDD1 elicits adipocyte differentiation and macrophage inflammation through NF-κB activation.
ac Representative oil red-O (ORO)-stained images of WT and Redd1−/− SVF cells (a), shControl (shC)- or sh-Redd1-transfected 3T3-L1 cells (b), and WT (Redd1fl/fl, Rfl/fl) and Redd1ΔAdipoq (RΔAdipoq) SVF cells (c) when cultured in differentiation medium (MDI) and quantification of relative ORO intensity (n = 4). df, Expression levels of adipogenic genes (d), REDD1 (e), and lipogenic genes (f) in Rfl/fl and RΔAdipoq SVF cells cultured in MDI medium and quantification of relative ORO intensity (n = 4). g Assessment of NF-κB–Luc activity in 3T3-L1 cells transfected either with siRNA for control, Ikka, Ikkb, or NF-κB p65 (p65) or with pcDNA3.1/His-Ikba (n = 5). h, i Representative images and realative quantification of ORO-stained images (h) and expression levels of Pparg and Cebpa (i) in 3T3-L1 cells infected with control adenovirus (Ad-C) or adenoviral Redd1 (Ad-R) after transfection with vector alone or pcDNA3.1/His-Ikba (n = 4). j NF-κB–Luc activity in mouse peritoneal macrophages infected with Ad-C or Ad-Redd1 (n = 4). k Cytokine production in mouse peritoneal macrophages infected with Ad-C or Ad-Redd1 (n = 5). Bar graphs represent mean ± s.e.m. Statistical significance was calculated using one-way ANOVA (g, h) and two-way ANOVA (a, i) followed by the Holm–Sidak post hoc test and an unpaired two-tailed t-test (bf, j, k). Source data are provided as a Source Data file.
Fig. 6
Fig. 6. Lys219/220 of REDD1 are crucial for NF-κB activation, adipogenesis, and inflammation.
a Predictive binding conformation between REDD1 and IκBα using computational protein-protein molecular docking methods. b Co-immunoprecipitation analysis of the interaction between REDD1 and IκBα in HEK293 cells transfected with pcDNA3.1/His-Ikba (His-Ikba) and either pFlag-CMV-1-Redd1 (Redd1) or Redd1 mutants (RKKAA and RKKRAAA) (n = 3). c Representative confocal images of NF-κB p65 nuclear translocalization in HEK293 cells infected with Ad-C, Ad-Redd1, or its mutants (n = 4). Scale bar, 50 μm. d Assessment of NF-κB–Luc activity in 3T3-L1 cells infected with Ad-control, Ad-Redd1, or its mutants (n = 4). e Representative ORO-stained images of 3T3-L1 cells infected with Ad-control, Ad-Redd1, or Ad-Redd1KKAA and quantification of relative ORO intensity (n = 4). f Expression levels of Pparg and Cebpa in 3T3-L1 cells infected with Ad-control, Ad-Redd1, or Ad-Redd1KKAA (n = 4). g Production of MCP-1 and TNF-α in macrophages infected with Ad-control, Ad-Redd1, or Ad-Redd1KKAA (n = 4). Bar graphs represent mean ± s.e.m. Statistical significance was calculated using one-way ANOVA (d, e) and two-way ANOVA (f, g) followed by the Holm–Sidak post hoc test. Source data are provided as a Source Data file.
Fig. 7
Fig. 7. HDF-induced obesity and metabolic phenotypes are prevented in Redd1KKAA mice.
a Weight gain in WT and Redd1KKAA mice after being fed HFD for 16 weeks (n = 10 per group). b eWAT and iWAT mass measurements in HFD-fed Redd1KKAA mice and their WT littermates (n = 10 per group). c Expression levels of Pparg and Cebpa in the eWAT of Redd1KKAA mice and WT littermates fed HFD for 10 weeks (n = 8 per group). d Representative images showing perilipin (green) and F4/80 (purple) staining in the eWAT of HFD-fed Redd1KKAA mice and WT littermates (n = 5 per group). Scale bar, 100 μm. e NF-κB activity in the eWAT from HFD-fed Redd1KKAA mice and WT littermates (n = 6 per group). f, g Plasma levels of inflammatory cytokines in HFD-fed Redd1KKAA mice and WT littermates (n = 8 per group). h Fasting plasma levels of glucose and insulin in HFD-fed Redd1KKAA mice and WT littermates (n = 8 per group). i Assessment of GTT and ITT in HFD-fed Redd1KKAA mice and WT littermates after fasting for 12 and 6 h, respectively (n = 6 per group). j, k Representative western blots of insulin-responsive Akt phosphorylation and plasma membrane-associated GLUT4 (PM-GLUT4) levels in the eWAT and skeletal muscle (j) and Akt and FOXO1 phosphorylation in the liver (k) of HFD-fed Redd1KKAA mice and WT littermates (n = 3). l Relative expression levels of G6pc, Pck1, and Fbp1 in the liver of HFD-fed Redd1KKAA mice and WT littermates compared with NC-fed mice (n = 6 per group). Bar graphs represent mean ± s.e.m. Statistical significance was calculated using an unpaired two-tailed t-test. Source data are provided as a Source Data file.
Fig. 8
Fig. 8. Global or adipocyte-specific loss of Redd1 prevents HFD-induced hepatic steatosis.
a Representative images of H&E-stained liver tissues from HFD-fed Redd1−/−, Redd1ΔAdipoq, Redd1ΔLysM, Redd1KKAA, and control mice, and quantification of hepatic steatosis from H&E-stained liver tissues (n = 6 per group). Scale bars, 100 μm. b Expression levels of Acc, Fasn, and Scd-1 in the liver of HFD-fed Redd1−/−, Redd1ΔAdipoq, Redd1ΔLysM, Redd1KKAA, and their control mice (n = 6 per group). Bar graphs represent mean ± s.e.m. Statistical significance was calculated using an unpaired two-tailed t-test. Source data are provided as a Source Data file.

References

    1. Kawai T, Autieri MV, Scalia R. Adipose tissue inflammation and metabolic dysfunction in obesity. Am. J. Physiol. Cell Physiol. 2021;320:C375–C391. doi: 10.1152/ajpcell.00379.2020. - DOI - PMC - PubMed
    1. Calle EE, Kaaks R. Overweight, obesity and cancer: epidemiological evidence and proposed mechanisms. Nat. Rev. Cancer. 2004;4:579–591. doi: 10.1038/nrc1408. - DOI - PubMed
    1. Hotamisligil GS. Inflammation, metaflammation and immunometabolic disorders. Nature. 2017;542:177–185. doi: 10.1038/nature21363. - DOI - PubMed
    1. Hotamisligil G, Shargill N, Spiegelman BM. Adipose expression of tumor necrosis factor-alpha: direct role in obesity-linked insulin resistance. Science. 1993;259:87–91. doi: 10.1126/science.7678183. - DOI - PubMed
    1. Weisberg SP, et al. Obesity is associated with macrophage accumulation in adipose tissue. J. Clin. Invest. 2003;112:1796–1808. doi: 10.1172/JCI200319246. - DOI - PMC - PubMed

Publication types