. 2022 Oct 22;12(1):17787.
doi: 10.1038/s41598-022-22768-y.

Pseudogenes and the associated ceRNA network as potential prognostic biomarkers for colorectal cancer

Affiliations

Pseudogenes and the associated ceRNA network as potential prognostic biomarkers for colorectal cancer

Zhuoqi Li et al. Sci Rep. .

Abstract

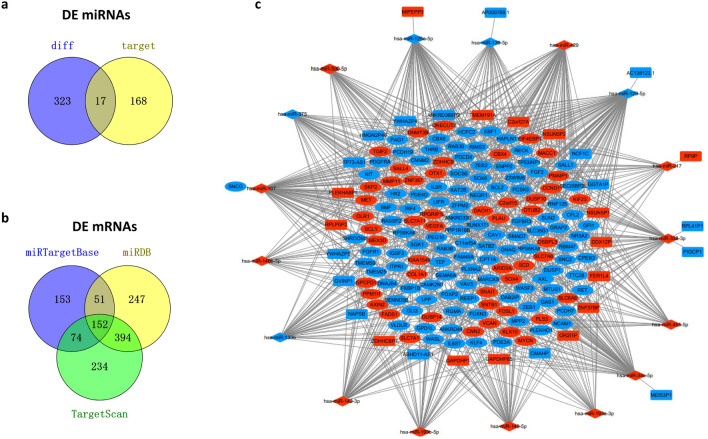
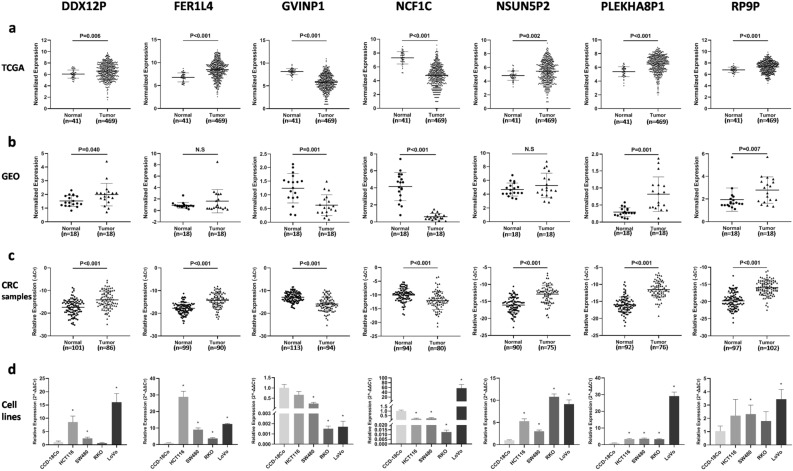
Colorectal cancer (CRC) is one of the most common and malignant carcinomas. Many long noncoding RNAs (lncRNAs) have been reported to play important roles in the tumorigenesis of CRC by influencing the expression of some mRNAs via competing endogenous RNA (ceRNA) networks and interacting with miRNAs. Pseudogene is one kind of lncRNA and can act as RNA sponges for miRNAs and regulate gene expression via ceRNA networks. However, there are few studies about pseudogenes in CRC. In this study, 31 differentially expressed (DE) pseudogenes, 17 DE miRNAs and 152 DE mRNAs were identified by analyzing the expression profiles of colon adenocarcinoma obtained from The Cancer Genome Atlas. A ceRNA network was constructed based on these RNAs. Kaplan-Meier analysis showed that 7 pseudogenes, 4 miRNAs and 30 mRNAs were significantly associated with overall survival. Then multivariate Cox regression analysis of the ceRNA-related DE pseudogenes was performed and a 5-pseudogene signature with the greatest prognostic value for CRC was identified. Moreover, the results were validated by the Gene Expression Omnibus database, and quantitative real-time PCR in 113 pairs of CRC tissues and colon cancer cell lines. This study provides a pseudogene-associated ceRNA network, 7 prognostic pseudogene biomarkers, and a 5-pseudogene prognostic risk signature that may be useful for predicting the survival of CRC patients.


Conflict of interest statement

The authors declare no competing interests.

Figures

Figure 1
Figure 1
Differentially expressed RNAs from TCGA-COAD compared with adjacent normal tissues. (ac) DE pseudogenes, miRNAs and mRNAs are hierarchically clustered by R software. The upper horizontal axis denotes the cluster analysis of each sample, blue indicates adjacent normal tissue and red indicates tumor samples. The left longitudinal axis indicated the cluster analysis of DE RNAs. The blue and red blocks represent relatively low and high expression respectively. (df) Each RNA analysis was plotted into the volcano map and the red dots represent the upregulated DE genes with log2FC ≥ 1 and adjusted p value FDR < 0.01, while the green dots represent downregulated genes with log2FC ≤ -1 and FDR < 0.01. FC, fold change. FDR, false discovery rate.
Figure 2
Figure 2
Construction of the ceRNA network for DE pseudogenes-miRNA-mRNA. (a, b) the overlapping DE miRNAs and mRNAs in different databases. (c) the ceRNA network. Round rectangles represent pseudogenes, diamonds represent miRNAs, and ellipses represent mRNAs. Blue represents downregulated genes, while red represents upregulated genes.
Figure 3
Figure 3
Kaplan–Meier curve analysis of DE pseudogenes in the ceRNA network. Seven pseudogenes were found to be significantly related to overall survival with p < 0.05. (a) DDX12P, (b) FER1L4, (c) GVINP1, (d) PLEKHA8P1, (e) NCF1C, (f) NSUN5P2, (g) RP9P.
Figure 4
Figure 4
Survival-related 7 DE pseudogenes and ceRNA network. (a) Pearson correlation analysis of the 7 survival-related pseudogenes and 29 survival-related mRNAs with p < 0.05. Red presents a positive correlation and purple presents a negative correlation. (b) Sankey diagram showing interactions between the 7 pseudogenes and their matched miRNAs and mRNAs that were significantly related to survival. Each rectangle represents a gene, and the connection degree of each gene is visualized based on the size of the rectangle.
Figure 5
Figure 5
Characterization of the five-pseudogene risk signature in the ceRNA network in the training and validation cohorts. (a) Kaplan–Meier curves for high-risk and low-risk groups classified by the risk scores of this signature. (b) The expression profiles of the 5 pseudogenes of each sample. The value of risk increased gradually from left to right. (c) The risk score distributions and the survival status of CRC patients. The patients were ranked by risk score. (d) ROC curves for predicting the 1-, 3-, and 5-year survival of CRC patients according to risk scores.
Figure 6
Figure 6
The expression levels of the 7 survival‐related DE pseudogenes in different datasets. (a) In normal colon tissues and colon cancer in TCGA. (b) Normal colon tissues and paired colorectal cancer in GSE50760 dataset of GEO. (c) In colorectal cancer tissues and paired normal tissues collected in our hospital, measured by qRT-PCR. (d) In one human normal colon fibroblastic cell line (CCD-18Co) and four human colorectal cancer cell lines (HCT116, SW480, RKO, LoVo), measured by qRT-qPCR. *p < 0.05. N.S, not significant.
Figure 7
Figure 7
GO annotation and KEGG pathway enrichment analysis of the DE mRNAs in the ceRNA network. The top 10 enriched GO (a) MF, (b) CC and (c) BP terms as well (d) KEGG pathways. GO, gene ontology; KEGG, Kyoto Encyclopedia of Genes and Genomes; MF, molecular function; CC, cellular component; BP, biological process.

References

    1. Siegel RL, Miller KD, Sauer AG, et al. Colorectal cancer statistics, 2020. CA Cancer J. Clin. 2020;70(3):145–164. doi: 10.3322/caac.21601. - DOI - PubMed
    1. Siegel RL, Miller KD, Jemal A. Cancer statistics, 2020. CA Cancer J. Clin. 2020;70(1):7–30. doi: 10.3322/caac.21590. - DOI - PubMed
    1. Grady WM, Markowitz SD. The molecular pathogenesis of colorectal cancer and its potential application to colorectal cancer screening. Dig. Dis. Sci. 2015;60(3):762–772. doi: 10.1007/s10620-014-3444-4. - DOI - PMC - PubMed
    1. Anastasiadou E, Jacob LS, Slack FJ. Non-coding RNA networks in cancer. Nat. Rev. Cancer. 2018;18(1):5–18. doi: 10.1038/nrc.2017.99. - DOI - PMC - PubMed
    1. Yang Y, Yan X, Li X, Ma Y, Goel A. Long non-coding RNAs in colorectal cancer: Novel oncogenic mechanisms and promising clinical applications. Cancer Lett. 2021;504:67–80. doi: 10.1016/j.canlet.2021.01.009. - DOI - PMC - PubMed

Publication types