

Epithelial-mesenchymal transition inhibition by metformin reduces melanoma lung metastasis in a murine model
- PMID: 36273071
- PMCID: PMC9588059
- DOI: 10.1038/s41598-022-22235-8
Epithelial-mesenchymal transition inhibition by metformin reduces melanoma lung metastasis in a murine model
Abstract
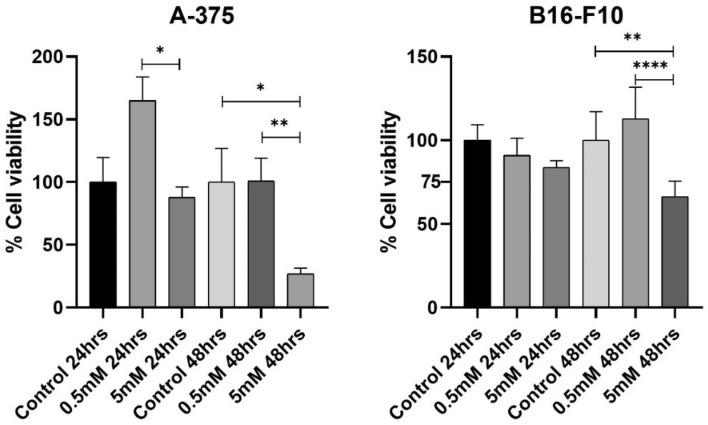
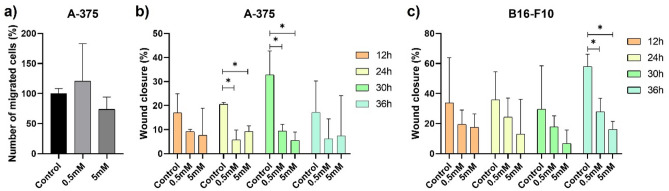
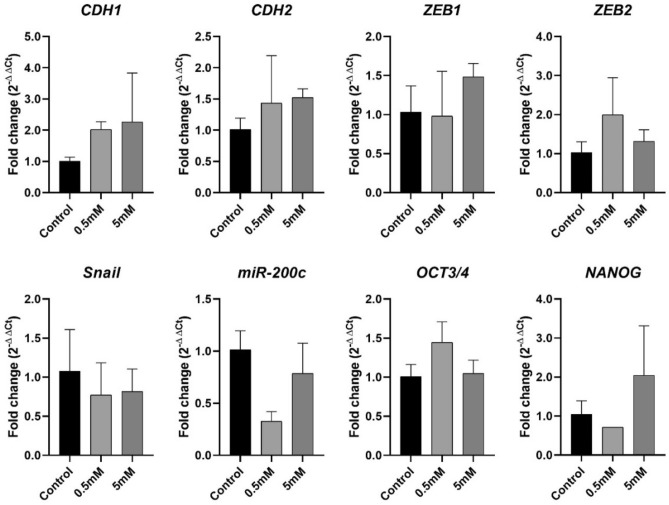
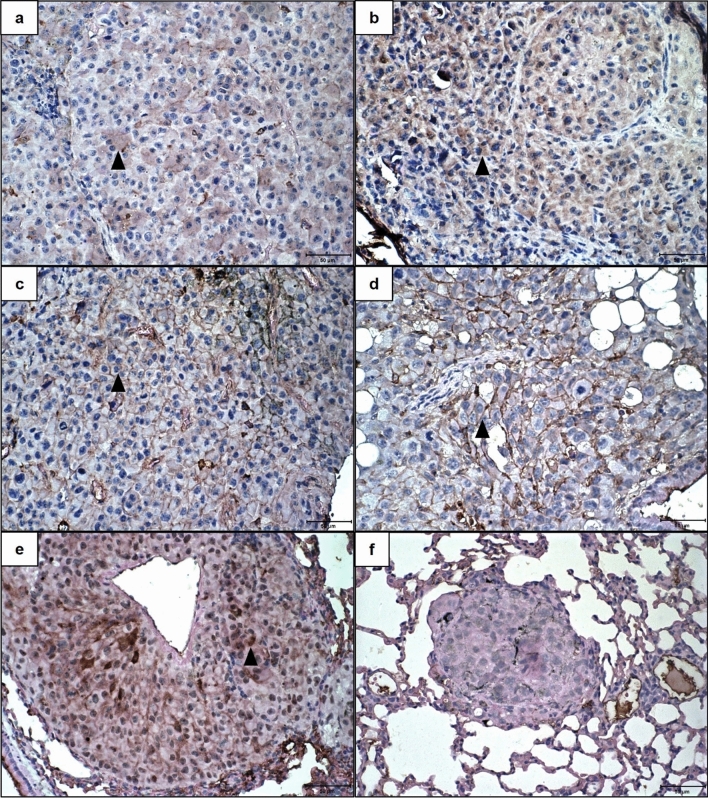
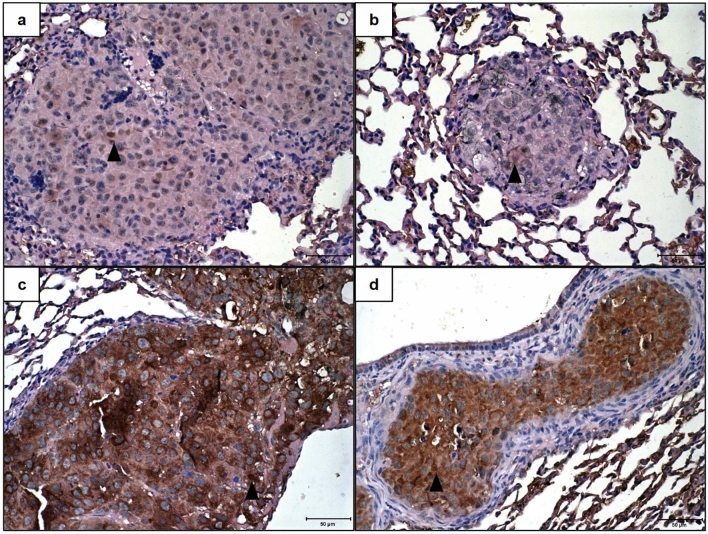
Melanoma is an aggressive cancer with fast metastatic spread and reduced survival time. One common event during the neoplastic progression is the epithelial-mesenchymal transition (EMT), which enhances invasiveness, cell migration, and metastasis. In this study, we investigated the effects of metformin at EMT in melanoma cell lines B16-F10 and A-375, in vitro, and the impact of EMT downregulation on melanoma progression in vivo. The metformin cells treatment reduces the migration potential in vitro and reduced the development of pulmonary metastases and the expressions of N-cadherin, vimentin, ZEB1, and ZEB2 at the metastases site, in vivo. These results indicate that metformin can promote EMT downregulation impairing the metastatic potential of melanoma cells.
© 2022. The Author(s).
Conflict of interest statement
The authors declare no competing interests.
Figures


Similar articles
-
Inhibition of Epithelial-Mesenchymal Transition and Metastasis by Combined TGFbeta Knockdown and Metformin Treatment in a Canine Mammary Cancer Xenograft Model.J Mammary Gland Biol Neoplasia. 2017 Mar;22(1):27-41. doi: 10.1007/s10911-016-9370-7. Epub 2017 Jan 11. J Mammary Gland Biol Neoplasia. 2017. PMID: 28078601
-
Resveratrol suppresses epithelial-to-mesenchymal transition in colorectal cancer through TGF-β1/Smads signaling pathway mediated Snail/E-cadherin expression.BMC Cancer. 2015 Mar 5;15:97. doi: 10.1186/s12885-015-1119-y. BMC Cancer. 2015. PMID: 25884904 Free PMC article.
-
Protein 4.1B Suppresses Tumor Metastasis by Regulating Epithelial-mesenchymal Transition Progression in Melanoma Cells.Int J Med Sci. 2019 Apr 16;16(4):529-536. doi: 10.7150/ijms.27401. eCollection 2019. Int J Med Sci. 2019. PMID: 31171904 Free PMC article.
-
Metformin inhibits gastric cancer cells metastatic traits through suppression of epithelial-mesenchymal transition in a glucose-independent manner.PLoS One. 2017 Mar 23;12(3):e0174486. doi: 10.1371/journal.pone.0174486. eCollection 2017. PLoS One. 2017. PMID: 28334027 Free PMC article.
-
Immune escape and metastasis mechanisms in melanoma: breaking down the dichotomy.Front Immunol. 2024 Feb 14;15:1336023. doi: 10.3389/fimmu.2024.1336023. eCollection 2024. Front Immunol. 2024. PMID: 38426087 Free PMC article. Review.
Cited by
-
CDKN2A and matrix metalloproteinases: key regulators of cellular senescence in squamous cell carcinoma.Am J Transl Res. 2025 Jun 15;17(6):4573-4589. doi: 10.62347/FKDS7259. eCollection 2025. Am J Transl Res. 2025. PMID: 40672601 Free PMC article.
-
Dual delivery of metformin and Y15 from a PLGA scaffold for the treatment of platinum-resistant ovarian cancer.Future Med Chem. 2025 Feb;17(3):301-312. doi: 10.1080/17568919.2025.2458457. Epub 2025 Jan 31. Future Med Chem. 2025. PMID: 39887289
-
IL-33 stimulates the anticancer activities of eosinophils through extracellular vesicle-driven reprogramming of tumor cells.J Exp Clin Cancer Res. 2024 Jul 27;43(1):209. doi: 10.1186/s13046-024-03129-1. J Exp Clin Cancer Res. 2024. PMID: 39061080 Free PMC article.
-
Suppression of malignant melanoma by knocking down growth differentiation factor-15 via inhibiting PTEN/PI3K/AKT signaling pathway.J Cancer. 2024 Jan 1;15(4):1115-1123. doi: 10.7150/jca.91892. eCollection 2024. J Cancer. 2024. PMID: 38230211 Free PMC article.
References
-
- American Cancer Society . Cancer Facts & Figures 2019. American Cancer Society (American Cancer Society; 2019.
-
- INCA. Câncer de pele melanoma. https://www.inca.gov.br/tipos-de-cancer/cancer-de-pele-melanoma (2020).
Publication types
MeSH terms
Substances
LinkOut - more resources
Full Text Sources
Medical
Research Materials
Miscellaneous
