. 2022 Oct 22;29(1):85.
doi: 10.1186/s12929-022-00871-6.

Tetrandrine ameliorates cognitive deficits and mitigates tau aggregation in cell and animal models of tauopathies

Affiliations

Tetrandrine ameliorates cognitive deficits and mitigates tau aggregation in cell and animal models of tauopathies

Benjamin Chun-Kit Tong et al. J Biomed Sci. .

Abstract

Background: Tauopathies are neurodegenerative diseases that are associated with the pathological accumulation of tau-containing tangles in the brain. Tauopathy can impair cognitive and motor functions and has been observed in Alzheimer's disease (AD) and frontotemporal dementia (FTD). The aetiology of tauopathy remains mysterious; however, recent studies suggest that the autophagic-endolysosomal function plays an essential role in the degradation and transmission of pathological tau. We previously demonstrated that tetrandrine could ameliorate memory functions and clear amyloid plaques in transgenic AD mice by restoring autophagic-endolysosomal function. However, the efficacy of tetrandrine and the associated therapeutic mechanism in tauopathies have not been evaluated and elucidated.

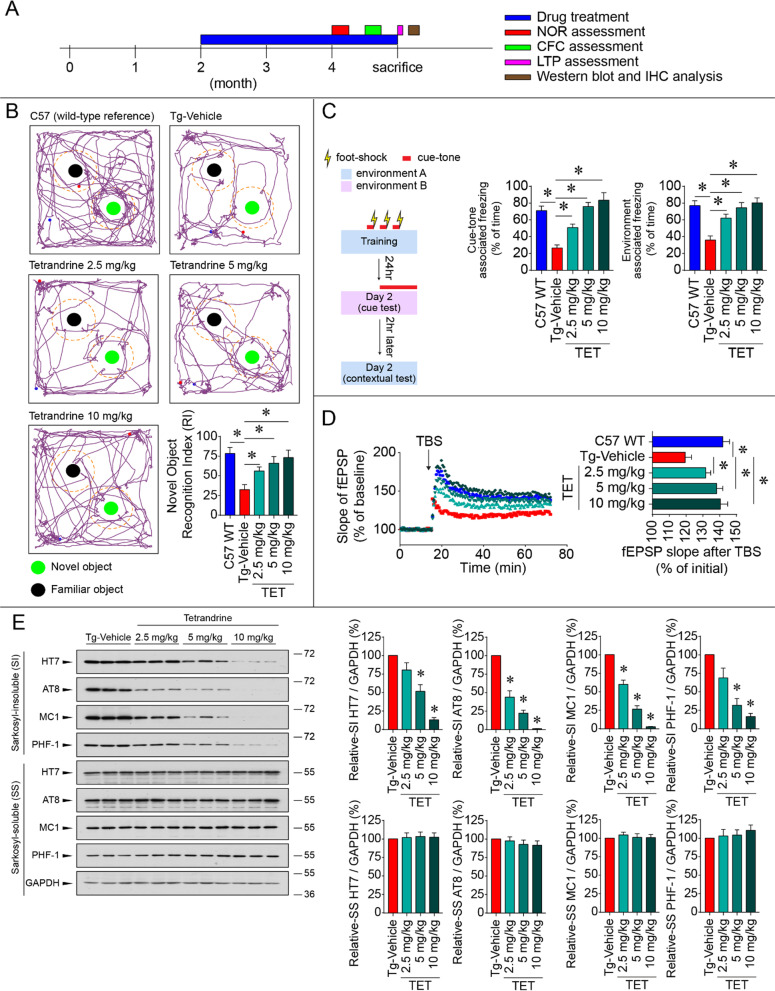
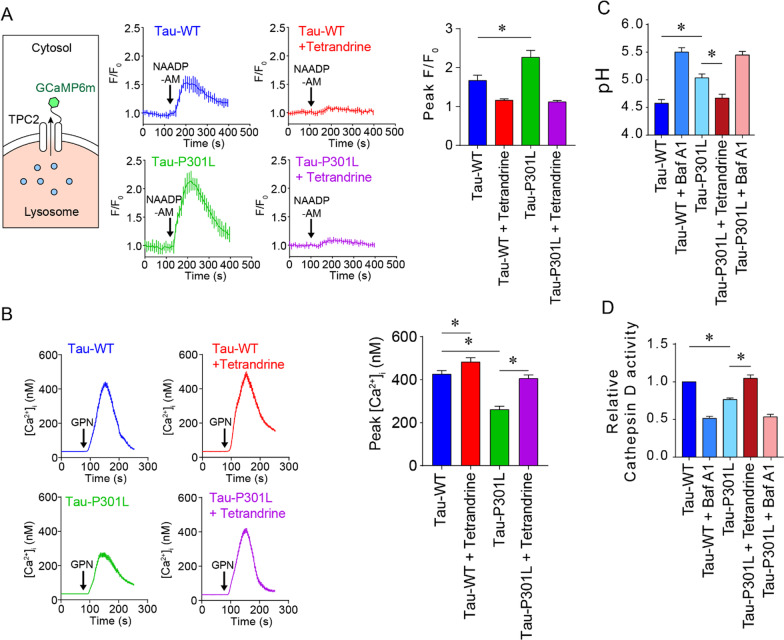
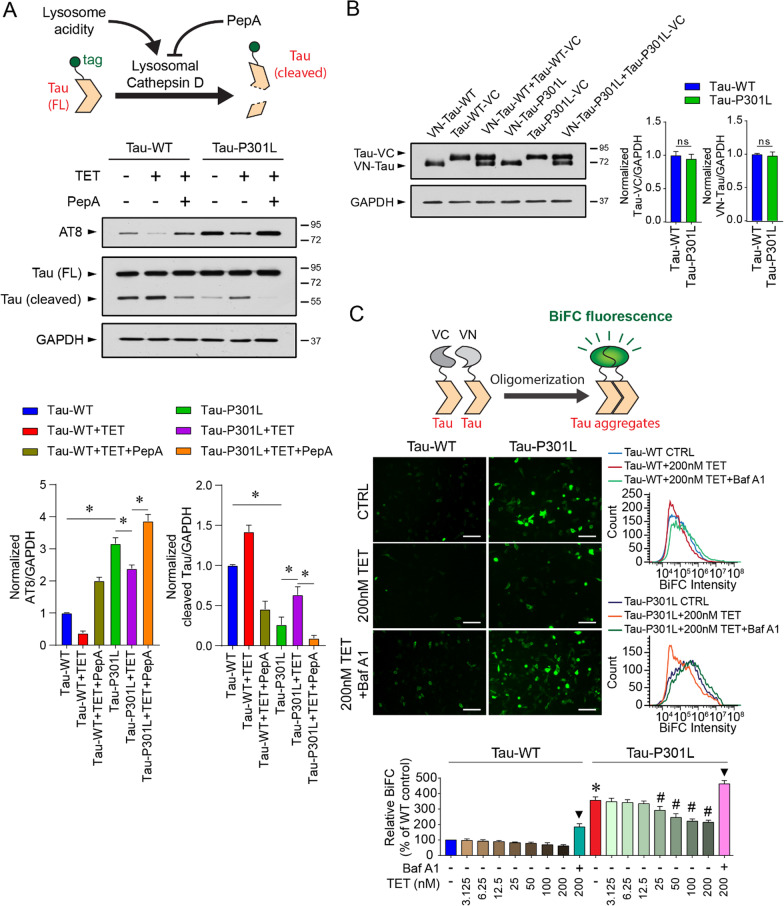
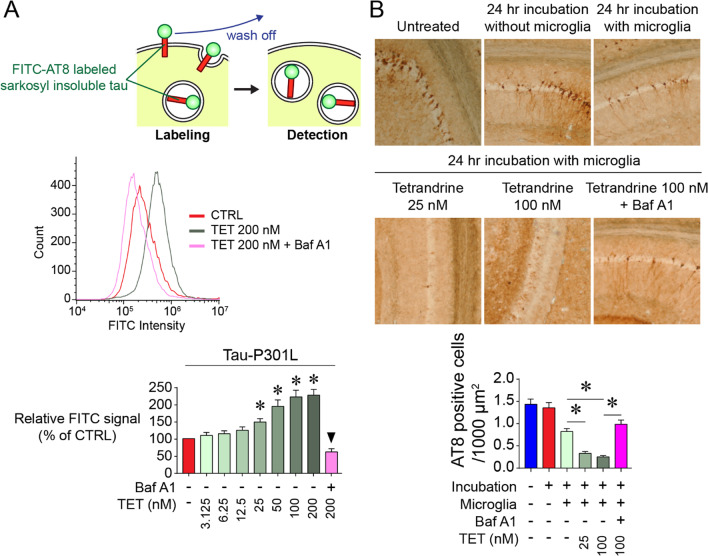
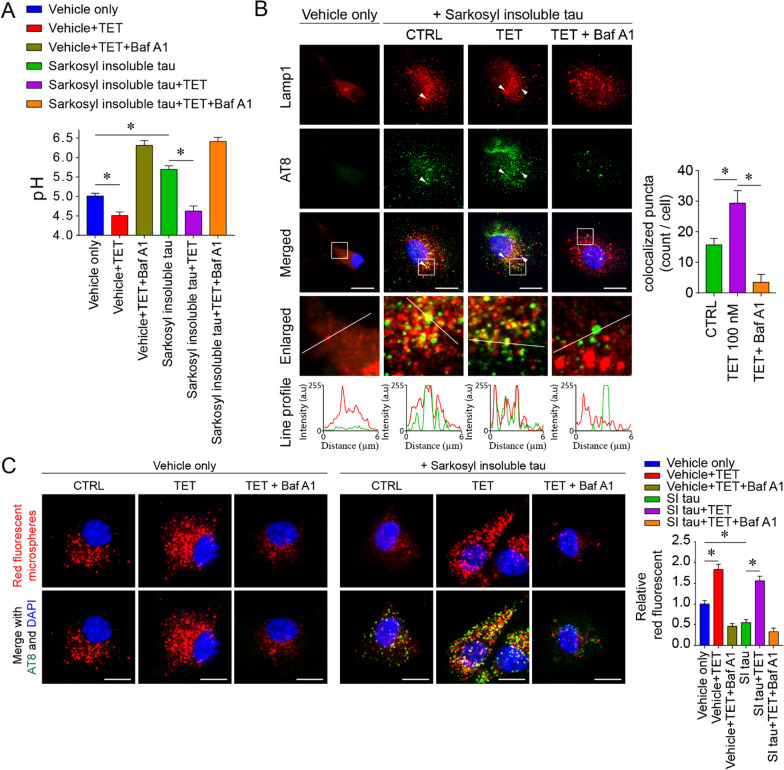
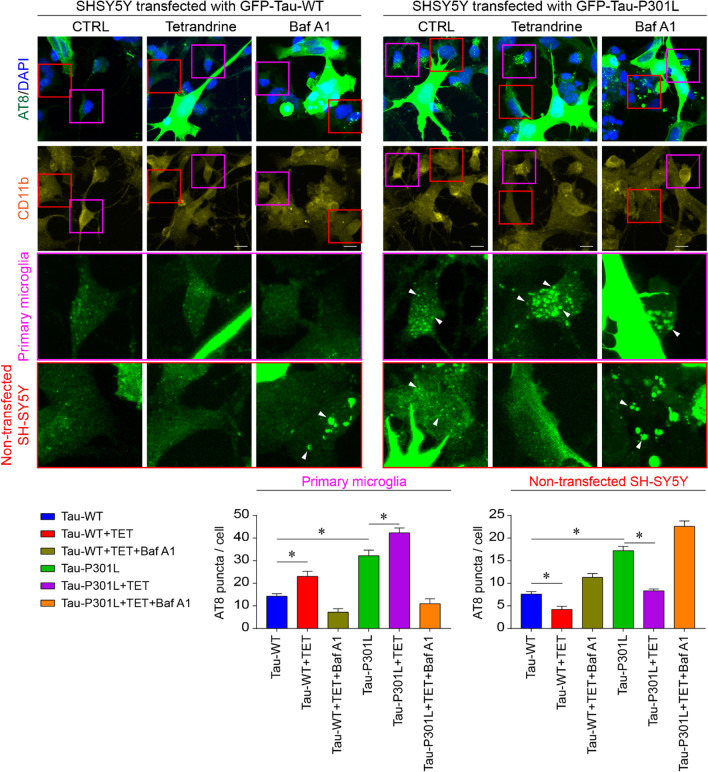
Methods: Novel object recognition, fear conditioning and electrophysiology were used to evaluate the effects of tetrandrine on memory functions in transgenic tau mice. Western blotting and immunofluorescence staining were employed to determine the effect of tetrandrine on autophagy and tau clearance in vivo. Calcium (Ca2+) imaging and flow cytometry were used to delineate the role of pathological tau and tetrandrine in lysosomal Ca2+ and pH homeostasis. Biochemical BiFC fluorescence, Western blotting and immunofluorescence staining were used to evaluate degradation of hyperphosphorylated tau in vitro, whereas coculture of brain slices with isolated microglia was used to evaluate tau clearance ex vivo.

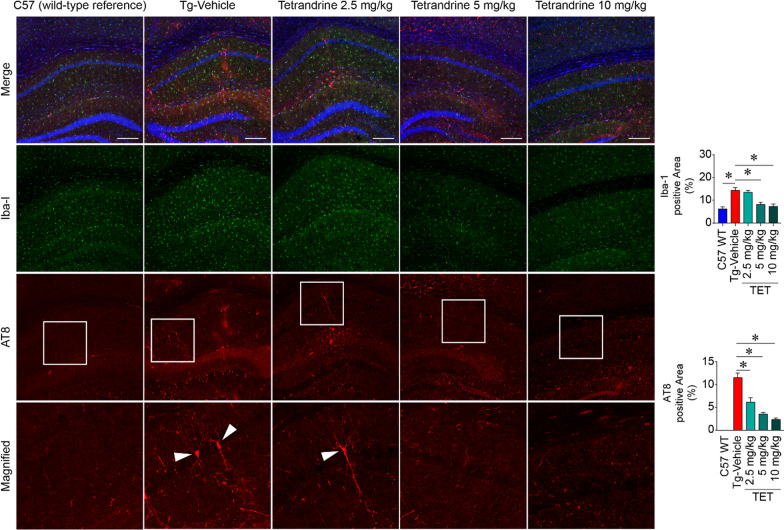
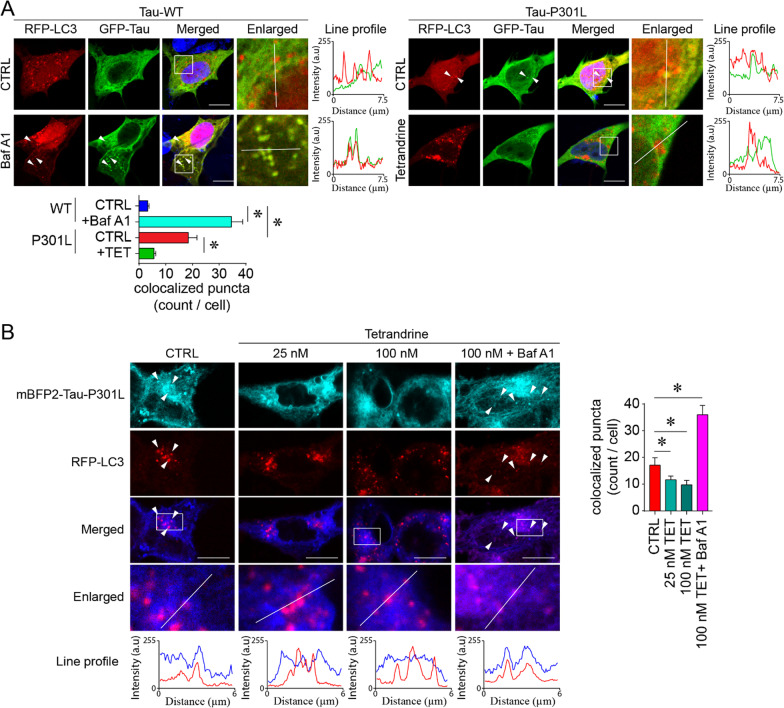
Results: We observed that tetrandrine treatment mitigated tau tangle development and corrected memory impairment in Thy1-hTau.P301S transgenic mice. Mechanistically, we showed that mutant tau expression disrupts lysosome pH by increasing two-pore channel 2 (TPC2)-mediated Ca2+ release, thereby contributing to lysosome alkalinization. Tetrandrine inhibits TPC2, thereby restoring the lysosomal pH, promotes tau degradation via autophagy, and ameliorates tau aggregation. Furthermore, in an ex vivo assay, we demonstrated that tetrandrine treatment promotes pathological tau clearance by microglia.

Conclusions: Together, these findings suggest that pathological tau disturbs endolysosomal homeostasis to impair tau clearance. This impairment results in a vicious cycle that accelerates disease pathogenesis. The success of tetrandrine in reducing tau aggregation suggests first, that tetrandrine could be an effective drug for tauopathies and second, that rescuing lysosomal Ca2+ homeostasis, thereby restoring ALP function, could be an effective general strategy for the development of novel therapies for tauopathies.

Keywords: Autophagy; Calcium dysregulation; Lysosome; Tauopathy; Tetrandrine; Two-pore channel 2.


Conflict of interest statement

The authors declare that they have no competing interests.

Figures

Fig. 1
Fig. 1
Tetrandrine ameliorates memory dysfunction and tau aggregation in tau mice. A A timeline diagram depicting the drug treatment and experimental plan of the study. Tau mice (Thy1-hTau.P301S, Tg) were treated with saline (Tg-vehicle), and different concentrations of tetrandrine (Tg-TET; 2.5 mg/kg, 5 mg/kg, and 10 mg/kg) via intraperitoneal (i.p.) injections every two days starting when the mice were 2 months old. When the mice reached 4 months old, they were subjected to behavioural and electrophysiological tests and Western blot and immunohistochemical analyses. B The novel object recognition test (NOR) was used to assay memory function. Mice were allowed to freely explore a familiar arena and were exposed to two identical objects (familiar object) prior to the experiment. Representative graphs show the exploration tracks of the mice after one of the objects was replaced by a new object (novel object). The familiar object and novel object are shown as black and green circles, respectively. The wild-type C57 mice spent more time in the exploration zone (shown as a dotted line) of the novel object than the Tg mice. Treatment with tetrandrine increased the exploration of novel objects by Tg mice in a dose-dependent manner. The bar chart depicts the recognition index (RI) calculated by the time the mice spent with each object. Data are summarized as the mean ± SEM from 8 mice in each group. C The contextual fear conditioning test (CFC) was used to assay learning and memory functions. The experiment was conducted as shown on the left. A mouse was placed in a specially designed sound-proof chamber and was stimulated by a foot shock coupled with a cue tone three times. The mice were then assayed in a novel environment with cue tones played after 3 min of exploration or in the same environment without cue tones to assay cue tone-associated and context-associated fear memory. Freezing behaviour represented the recall of memory associated with the electrical shocks. Bar charts depict the percentage of freezing in contextual and cued tests. Data are summarized as the mean ± SEM from 8 mice in each group. D Representative traces showing the electrophysiological fEPSP measurements evoked by 5 trains of theta burst stimulation (TBS) in brain slices isolated from C57 WT mice treated with different concentrations of tetrandrine (Tg-TET) or vehicle (Tg-Vehicle). The bar chart summarizes the fEPSP after TBS stimulation. Data are summarized as the mean ± SEM from 8 mice with 3 brain slices each from each group. E Western blot analyses showing the amount of phosphor-tau protein in Sarkosyl-soluble (SS) and Sarkosyl-insoluble (SI) fractions in wild-type C57 mice (C57 WT) or mice treated with different concentrations of tetrandrine (Tg-TET) or vehicle (Tg-Vehicle) probed with different tau antibodies. Bar charts depict the amount of tau protein normalized to GAPDH in the SS and SI fractions. Data are summarized as the mean ± SEM from 8 mice in each group. *Indicates p < 0.05 compared with the C57 WT group or tau mice treated with saline (Tg-Vehicle)
Fig. 2
Fig. 2
Tetrandrine reduces Iba-1 (gliosis) and AT8 (phosphorylated tau) signals in Thy1-hTau.P301S mice. Micrographs showing representative immunofluorescence staining of gliosis and phosphor-tau in hippocampal regions of control wild-type C57 (C57 WT) or Thy1-hTau.P301S mice treated with saline (Tg-Vehicle) or different concentrations of tetrandrine (TET; 2.5 mg/kg, 5 mg/kg, and 10 mg/kg, ip injection every two days from 2 months old to 4 months old). After the treatment, brain slices were immuno-probed with Iba-1 and AT8 antibodies to reveal gliosis and hyperphosphorylated tau. The bottom panel shows the magnified region in the white boxes in the AT8 immunostaining panels. The arrowheads of the magnified micrographs depict neurons with hyperphosphorylated tau. Quantifications of Iba1 and AT8 levels are shown in the bar charts. Data are summarized as the mean ± SEM from 8 mice, with 24 images analysed in each group. *Indicates p < 0.05 compared with C57 WT or vehicle-treated tau mice control
Fig. 3
Fig. 3
Pathological tau disrupts lysosomal Ca2+ and pH homeostasis by increasing TPC2 activity. A Left, a diagram depicts the topological representation of transfected GCaMP6m-TPC2 in the lysosome. Ca2+-sensitive GCaMP6 is located on the cytoplasmic side and can sense Ca2+ released from lysosomes. Middle, representative Ca2+ traces showing lysosome Ca2+ efflux measured by the expressed GCaMP6m-TPC2 in WT or mutant tau-expressing SH-SY5Y cells. The bar chart on the right shows the normalized peak fluorescence intensity (F/F0) of GCaMP6m-TPC2, summarized as the mean ± SEM from 3 individual experiments, with 90 cells analysed in each group. B Representative Ca2+ traces depict the changes in cytoplasmic Ca2+ content measured by the Ca2+ indicator Fura-2AM after the addition of GPN to SHSY5Y cells expressing Tau-WT or Tau-P301L with or without tetrandrine treatment. Each trace summarizes the changes in cytoplasmic Ca2+ in 90 cells from 3 experiments. The bar chart on the right shows the peaks of GPN-induced cytoplasmic Ca2+ changes. C Lysosomal pH measurements of SH-SY5Y cells expressing Tau-WT or Tau-P301L. The V-ATPase inhibitor bafilomycin A1 (BafA1) was used as a control. D Lysosomal cathepsin D (Cat D) activity measured in SH-SY5Y cells expressing Tau-WT or Tau-P301L. BafA1 was used as a control. Unless otherwise specified, all data are summarized as the mean ± SEM from at least 3 individual experiments; *Indicates p < 0.05
Fig. 4
Fig. 4
Tetrandrine ameliorates tau aggregation through endolysosomal degradation. A Top, schematic representation showing the manipulation of cathepsin D activity by tetrandrine or pepstatin A (Pep A) on the aggregation of tagged-tau ion SH-SY5Y cells. Middle, Western blot analyses of tau aggregation under the influence of tetrandrine and pepstatin A in Tau-WT- or Tau-301L-expressing SH-SY5Y cells. Cathepsin D activity was modulated by the addition of tetrandrine (TET) or Pep A. Bar charts depict the protein amount of cleaved and uncleaved tau normalized to GAPDH. Data are summarized as the mean ± SEM from 3 individual experiments; *Indicates p < 0.05. B Western blot analysis of the expression levels of VN and VC fragments of biomolecular fluorescence complementation (BiFC) in Tau-WT- or Tau-P301L-expressing cells. The bar chart depicts the protein levels of VN-tagged and VC-tagged tau when they were coexpressed. Expression of Tau-WT or Tau-P301L did not affect the expression of VN- and VC-fragments in cells. Data are summarized as the mean ± SEM from 3 individual experiments. n.s. denotes no statistical significance. C Top, a schematic showing the formation of BiFC by the expressed VN- and VC-fragments. Middle, representative micrographs showing the fluorescence levels of BiFC in Tau-WT- or Tau-P301L-expressing cells under the influence of tetrandrine with or without BafA1 cotreatment. Bottom, representative flow cytometry data depict the effect of tetrandrine (TET) or Baf A1 on tau aggregation. The bar chart depicts data summarized as the mean ± SEM from 3 individual experiments; * and #Indicate p < 0.05 compared to the WT and untreated mutant tau groups, respectively. ▼ indicates p < 0.05 compared to the 200 nM tetrandrine-treated groups
Fig. 5
Fig. 5
Tetrandrine promotes pathological tau degradation. A Representative micrographs showing autophagic degradation of tau tracked by GFP-Tau and RFP-LC3 in Tau-WT- or Tau-P301L-expressing SH-SY5Y cells. The enlarged images are the magnified regions indicated in the white boxes of the merged images. White arrowheads indicate the colocalization of tau and LC3 puncta, and their degree of colocalization was analysed by ImageJ with the colocalization analysis plugin. The red and green traces in the line profile show the intensity of red and green colour in arbitrary units (a.u.) along the white line indicated in the enlarged images. The bar chart depicts data summarized as the mean ± SEM from 3 individual experiments, with 30 cells counted in each group. *Indicates p < 0.05. B An analogous tau degradation experiment was performed using acid-resistant mBFP2-tagged tau P301L. The enlarged images are the magnified region indicated by the white boxes in the merged images. White arrowheads indicate the colocalization of tau-P301L—LC3 puncta under the influence of tetrandrine (TET) and bafilomycin A (BafA1). The degree of colocalization was analysed with ImageJ. The red and blue traces in the line profile show the intensity of red and blue colour in arbitrary units (a.u.) along the white line indicated in the enlarged images. The bar chart depicts data summarized as the mean ± SEM from 3 individual experiments, with 30 cells counted in each group. *Indicates p < 0.05
Fig. 6
Fig. 6
Tetrandrine promotes tau internalization and degradation by microglia. A Top, a schematic showing the internalization assay using FITC-AT8-labelled tau isolated from the Sarkosyl insoluble fraction of tau-P301S tau mouse brain homogenates. Middle, flow cytometry analysis depicting the internalization of FITC-AT8-labelled insoluble tau aggregates isolated from P301S tau mouse brain homogenates by microglia under the influence of TET and BafA1. Bottom, bar chart showing data summarized as the mean ± SEM from 5 individual experiments, *Indicates p < 0.05. ▼ indicates p < 0.05 compared to the 200 nM tetrandrine-treated group. B Representative micrographs showing the ex vivo tau-tangle clearance in 24 h in tau-P301S mouse brain slices under the influence of tetrandrine treatment at different concentrations. The bar chart depicts data summarized as the mean ± SEM from 5 individual experiments; *Indicates p < 0.05
Fig. 7
Fig. 7
Tetrandrine restores the microglial phagocytosis impairment induced by pathological tau. A Lysosomal pH measurements in primary microglia 24 h after incubation with Sarkosyl-insoluble fractions from tau-P301S mouse brain homogenates with or without tetrandrine treatment. The Sarkosyl vehicle was used as the control. BafA1 was used to induce lysosomal alkalinization. Data are summarized as the mean ± SEM from 3 independent experiments. *Indicates p < 0.05. B Representative micrographs showing the localization of phagocytosed tau in microglia. Lamp1 and AT-8 were employed to label lysosomes and phosphor-tau, respectively. The enlarged images show the magnified region in the white boxes from the merged images. White arrowheads indicate the colocalization of tau and Lamp1, and their degree of colocalization was analysed with ImageJ with the colocalization plugin. The red and green traces in the line profile show the intensity of red and green colour in arbitrary units (a.u.) along the white line indicated in the enlarged images. Data are summarized as the mean ± SEM from 15 images analysed in each group. *Indicates p < 0.05. C Representative micrographs showing the phagocytosis assay of red fluorescent microspheres under the influence of tetrandrine (TET) and bafilomycin A1 (BafA1) in primary microglia 24 h after incubation with Sarkosyl-insoluble (SI) fractions of P301S tau mouse brain homogenates or Sarkosyl vehicle only. Data are summarized as the mean ± SEM from 15 images analysed in each group. *Indicates p < 0.05
Fig. 8
Fig. 8
Tetrandrine reduces pathological tau transmission. Representative micrograph showing coculture of SH-SY5Y cells transfected with GFP-Tau-WT or GFP-tau-P301L with primary microglia. Hyperphosphorylated tau aggregates and primary microglial cells were stained with AT8 and CD11b, respectively. Red and purple boxes indicate the magnified regions for nontransfected SH-SY5Y cells and microglia, respectively. White arrowheads indicate transmission of AT8-positive puncta to primary microglia and nontransfected SH-SY5Y cells with or without tetrandrine or with BafA1. Bar charts depict the number of AT8-positive puncta transmitted to microglia or nontransfected SH-SY5Y cells. Data are summarized as the mean ± SEM from 15 images analysed in each group. *Indicates p < 0.05

References

    1. As A. 2017 Alzheimer's disease facts and figures. Alzheimers Dement. 2017;13(4):325–373.
    1. Hardy J, Selkoe DJ. The amyloid hypothesis of Alzheimer's disease: progress and problems on the road to therapeutics. Science. 2002;297(5580):353–356. - PubMed
    1. Nixon RA, Yang D-S. Autophagy failure in Alzheimer's disease—locating the primary defect. Neurobiol Dis. 2011;43(1):38–45. - PMC - PubMed
    1. Xin S-H, Tan L, Cao X, Yu J-T, Tan L. Clearance of amyloid beta and tau in Alzheimer’s disease: from mechanisms to therapy. Neurotox Res. 2018;34(3):733–748. - PubMed
    1. Song JX, Malampati S, Zeng Y, Durairajan SSK, Yang CB, Tong BCK, et al. A small molecule transcription factor EB activator ameliorates beta-amyloid precursor protein and Tau pathology in Alzheimer's disease models. Aging Cell. 2020;19(2):e13069. - PMC - PubMed