. 2022 Oct 22;41(1):312.
doi: 10.1186/s13046-022-02519-7.

Patient-specific modeling of stroma-mediated chemoresistance of pancreatic cancer using a three-dimensional organoid-fibroblast co-culture system

Affiliations

Patient-specific modeling of stroma-mediated chemoresistance of pancreatic cancer using a three-dimensional organoid-fibroblast co-culture system

Sebastian Schuth et al. J Exp Clin Cancer Res. .

Abstract

Background: Cancer-associated fibroblasts (CAFs) are considered to play a fundamental role in pancreatic ductal adenocarcinoma (PDAC) progression and chemoresistance. Patient-derived organoids have demonstrated great potential as tumor avatars for drug response prediction in PDAC, yet they disregard the influence of stromal components on chemosensitivity.

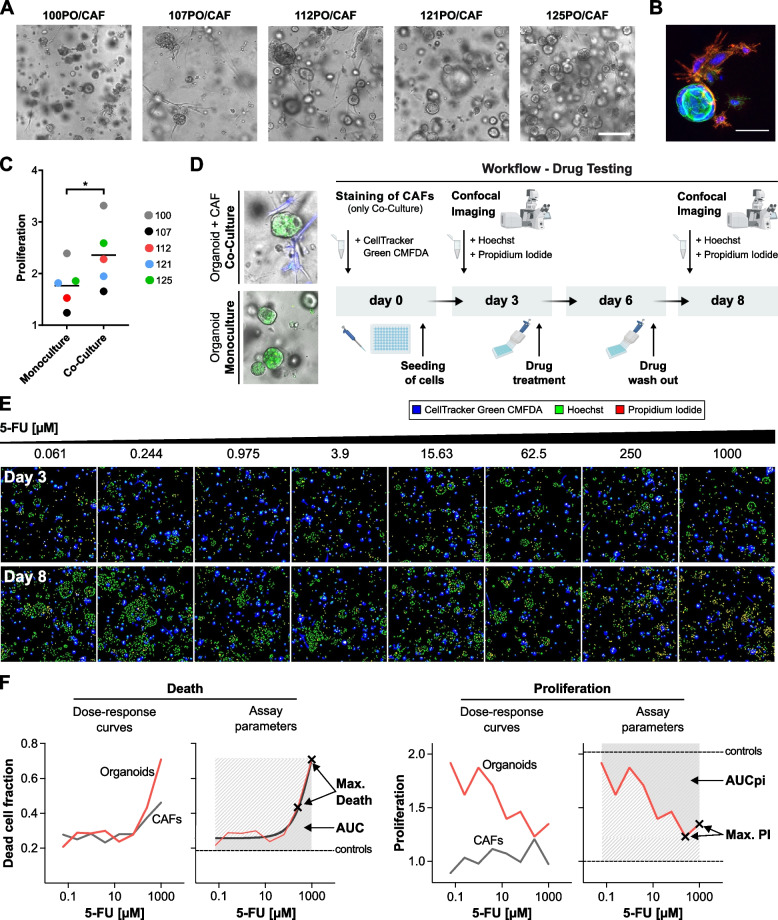
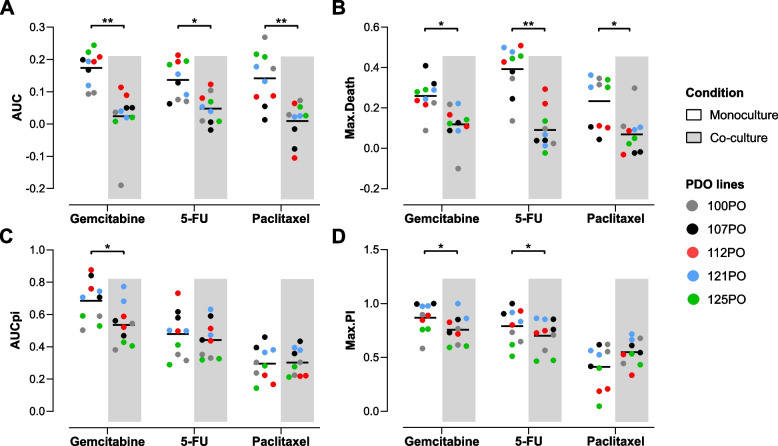
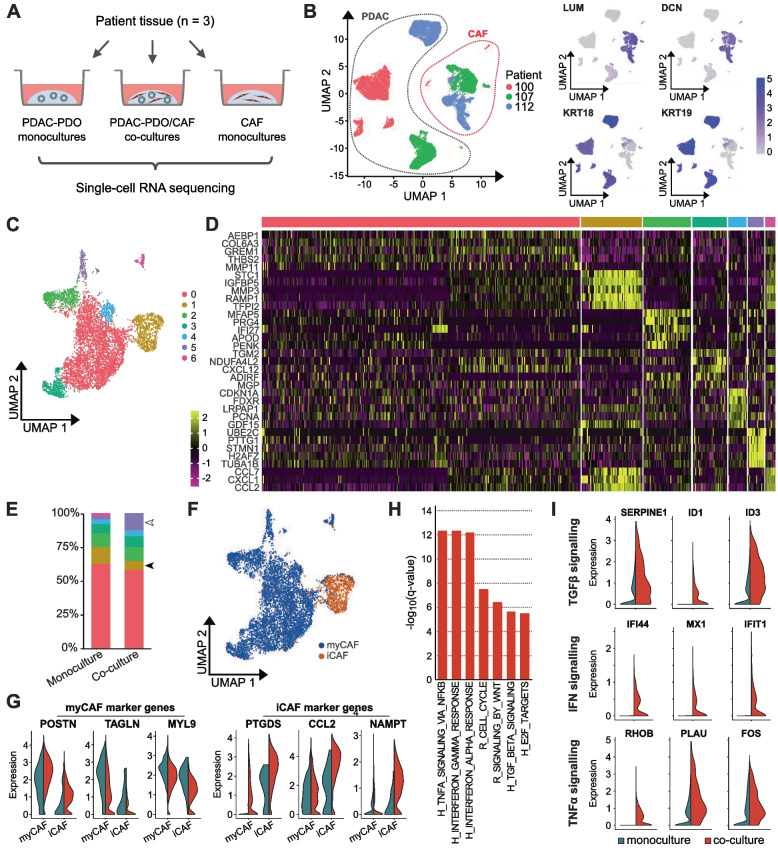
Methods: We established direct three-dimensional (3D) co-cultures of primary PDAC organoids and patient-matched CAFs to investigate the effect of the fibroblastic compartment on sensitivity to gemcitabine, 5-fluorouracil and paclitaxel treatments using an image-based drug assay. Single-cell RNA sequencing was performed for three organoid/CAF pairs in mono- and co-culture to uncover transcriptional changes induced by tumor-stroma interaction.

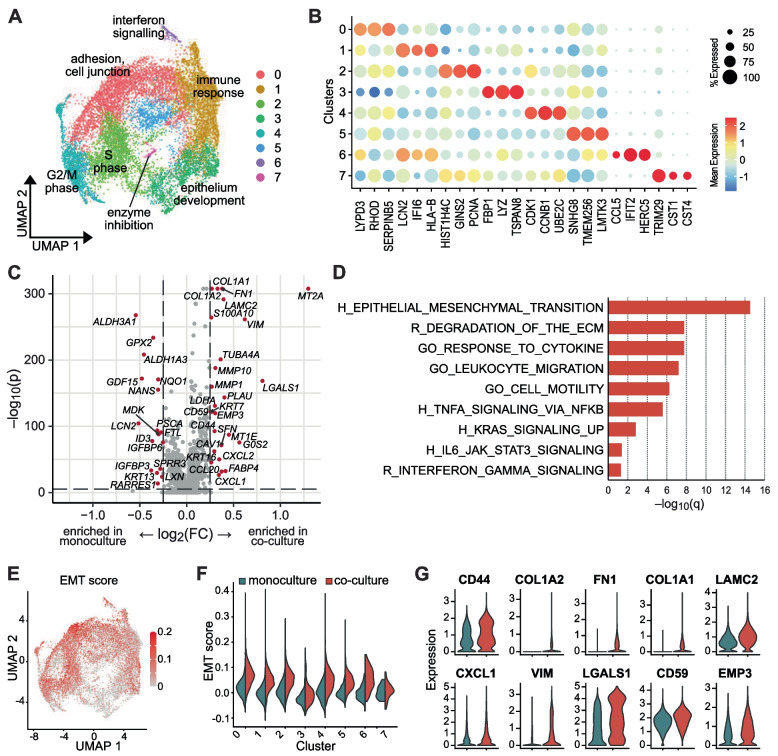
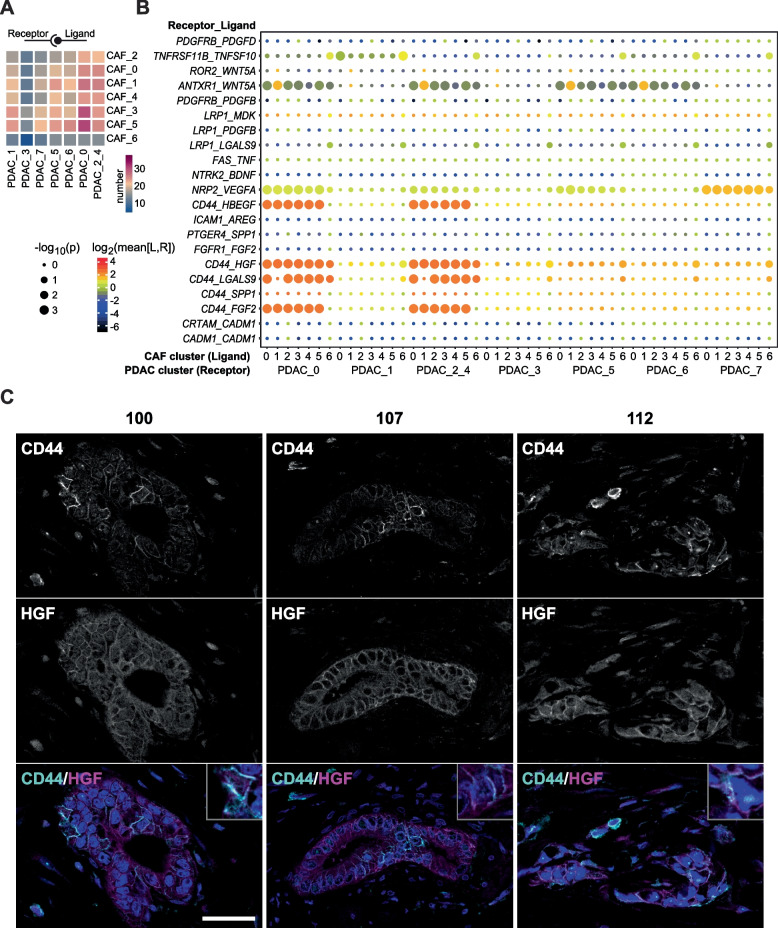
Results: Upon co-culture with CAFs, we observed increased proliferation and reduced chemotherapy-induced cell death of PDAC organoids. Single-cell RNA sequencing data evidenced induction of a pro-inflammatory phenotype in CAFs in co-cultures. Organoids showed increased expression of genes associated with epithelial-to-mesenchymal transition (EMT) in co-cultures and several potential receptor-ligand interactions related to EMT were identified, supporting a key role of CAF-driven induction of EMT in PDAC chemoresistance.

Conclusions: Our results demonstrate the potential of personalized PDAC co-cultures models not only for drug response profiling but also for unraveling the molecular mechanisms involved in the chemoresistance-supporting role of the tumor stroma.

Keywords: Cancer-associated fibroblasts; Drug screening; Pancreatic cancer; Patient-derived organoids; Personalized oncology.


Conflict of interest statement

J. Jabs was employed by DKFZ and Steinbeis GmbH during experimental work and analysis and at Merck Healthcare KGaA during writing of the manuscript. All other authors declare no conflict of interest.

Figures

Fig. 1
Fig. 1
Co-culture of PDAC organoids with CAFs and image-based drug testing to de-convolve CAF and organoid responses. A Brightfield images corresponding to the five established direct 3D co-cultures of the patient-matched CAFs and PDAC-PDOs. Scale bar: 250 μm. B Co-culture of matched CAFs and PDAC-PDOs stained for the CAF marker α-SMA (red) and actin cytoskeleton (phalloidin, green). Nuclei were stained with Hoechst (blue). Direct intercellular contact between organoid tumor cells and CAFs can be observed. Scale bar: 50 μm. C Proliferation levels of PDAC organoids measured from culture day 3 to day 8. PDAC organoids in co-culture show significantly higher proliferation levels than in monoculture. Paired t-test, * P < 0.05. D Schematic overview of the established drug test workflow for PDAC-PDO mono- and PDAC-PDO/CAF co-cultures. E Montage of maximum intensity projections as an example of the image data generated from a co-culture model treated with increasing concentration of 5-FU. CAFs (blue) were stained with CellTracker Green CMFDA to be distinguished from PDAC organoids. Hoechst (green) and propidium iodide (red) were used to stain the nuclei of all and dead cells, respectively. F Dose-response curves for cell death (left) and proliferation (right) were computed individually for PDOs and CAFs. Area under the curve (AUC, AUCpi) and maximum response values (max. Death, max. PI) for cell death and proliferation inhibition were used to evaluate drug responses
Fig. 2
Fig. 2
Decreased drug sensitivity of organoids in co-culture with matched CAFs. A, B Cell death of PDAC organoids induced by gemcitabine, 5-FU and paclitaxel was significantly reduced when co-cultured with CAFs. The mean values of the two independent replicates for each line are displayed. Paired t-test, * P < 0.05, ** P < 0.01. C, D Proliferation inhibition induced by gemcitabine in PDAC organoids was significantly reduced in co-culture (AUCpi, max. PI). For 5-FU, a significantly lower max. PI was observed for PDAC organoids in co-culture. The mean values of the two independent replicates for each line are displayed. Paired t-test, * P < 0.05
Fig. 3
Fig. 3
Inflammatory pathways are upregulated in CAFs after co-culture with PDAC organoids. A Overview of the samples used for single-cell RNA sequencing. B UMAP representation of all single-cell transcriptomes. Dotted lines indicate CAF and PDAC cells, which were distinguished by the expression of known marker genes. LUM and DCN expression identifies CAFs, while KRT18 and KRT19 expression identifies PDAC tumor cells. C Integrated UMAP representation of CAFs from monoculture and co-culture samples, with seven clusters distinguished by Louvain clustering. D Single-cell expression of the top five enriched genes for each CAF cluster in (C). E Distribution of CAFs among the seven clusters, colored as in (C), in monoculture and co-culture samples. The proportion of cells in cluster 1, with an immune response signature, is decreased in co-cultures (filled arrowhead); the proportion of cells in cluster 5, expressing cell cycle related genes, is increased in co-cultures (unfilled arrowhead). F Distribution of iCAF-like and myCAF-like cells, as identified by principal component analysis (Methods and Supplementary Fig. S2D), shown on the same UMAP as in (C). G Expression of iCAF and myCAF marker genes in the iCAF-like and myCAF-like populations identified in (F), comparing monocultures (blue) to co-cultures (red). H Selected Hallmark (H) and Reactome (R) pathways upregulated in CAFs in co-cultures compared to monocultures. I Expression of genes involved in TGFβ, IFN and TNFα signaling in CAFs in monocultures (blue) and co-cultures (red) showing increased expression of genes in co-culture conditions
Fig. 4
Fig. 4
Increased EMT in PDAC organoid cells induced by CAFs. A Integrated UMAP representation of PDAC organoid cells from monoculture and co-culture samples, with eight clusters distinguished by Louvain clustering. Keywords indicate functional cluster identities based on GO term analysis. B Expression across all PDAC organoid clusters of genes specifically enriched in one cluster. C Volcano plot depicting the fold change and significance of genes differentially expressed in PDAC organoid cells in monocultures compared to co-cultures. D Selected Hallmark (H), Reactome (R) and GO gene sets upregulated in PDAC organoid cells in co-cultures compared to monocultures. E Distribution of EMT scores in PDAC organoid cells, using the same UMAP representation as in (A). F Distribution of EMT scores by cluster in PDAC organoid cells in monocultures (blue) and co-cultures (red). G Expression of EMT-related genes in PDAC organoid cells in monocultures (blue) and co-cultures (red)
Fig. 5
Fig. 5
Potential receptor-ligand interactions between PDAC organoids and CAFs. A Number of potential ligand-receptor interactions between the different CAF and PDAC organoids cell clusters. B Potential receptor-ligand interactions between PDAC organoid and CAF cell clusters with a known or presumed role in EMT. Shown are only interactions where CAF cells present a ligand to the receptor expressed by PDAC organoid cells. C Immunofluorescence staining for CD44 (cyan) and HGF (magenta) of the parental tumor tissues of PDO/CAF lines 100, 107 and 112 confirms co-localization of a predicted receptor-ligand interaction in vivo. Single channels and composite are shown. DAPI stained nuclei are depicted in blue. Scale bar: 50 μm

References

    1. Ferlay J, Ervik M, Lam F, Colombet M, Mery L, Piñeros M, et al. Global Cancer Observatory: Cancer Today. Lyon, France: International Agency for Research on Cancer. 2020 [cited 2022 Mar 7]. Available from: https://gco.iarc.fr/today
    1. Springfeld C, Jäger D, Büchler MW, Strobel O, Hackert T, Palmer DH, et al. Chemotherapy for pancreatic cancer. La Press Médicale. 2019;48:e159–e174. doi: 10.1016/j.lpm.2019.02.025. - DOI - PubMed
    1. Klemm F, Joyce JA. Microenvironmental regulation of therapeutic response in cancer. Trends Cell Biol. 2015;25:198–213. doi: 10.1016/j.tcb.2014.11.006. - DOI - PMC - PubMed
    1. Kleeff J, Korc M, Apte M, Vecchia CL, Johnson CD, Biankin AV, et al. Pancreatic cancer. Nat Rev Dis Primers. 2016;2:16022. doi: 10.1038/nrdp.2016.22. - DOI - PubMed
    1. Olive KP, Jacobetz MA, Davidson CJ, Gopinathan A, McIntyre D, Honess D, et al. Inhibition of hedgehog signaling enhances delivery of chemotherapy in a mouse model of pancreatic cancer. Science. 2009;324:1457–1461. doi: 10.1126/science.1171362. - DOI - PMC - PubMed

MeSH terms