. 2022 Dec;43(12):2308-2323.
doi: 10.1002/humu.24491. Epub 2022 Nov 20.

SPiP: Splicing Prediction Pipeline, a machine learning tool for massive detection of exonic and intronic variant effects on mRNA splicing

Affiliations

SPiP: Splicing Prediction Pipeline, a machine learning tool for massive detection of exonic and intronic variant effects on mRNA splicing

Raphaël Leman et al. Hum Mutat. 2022 Dec.

Abstract

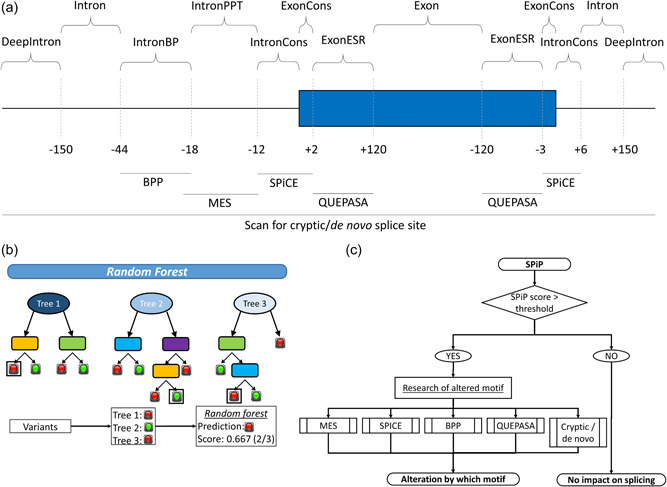
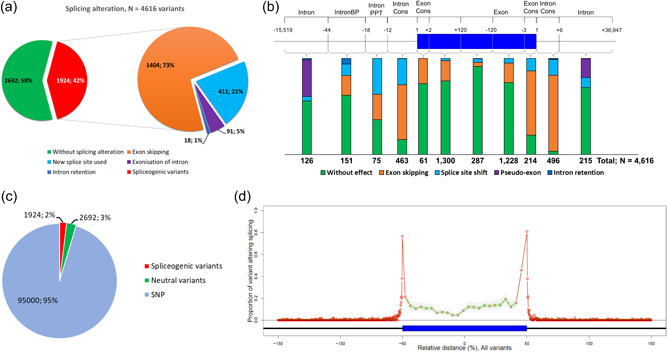
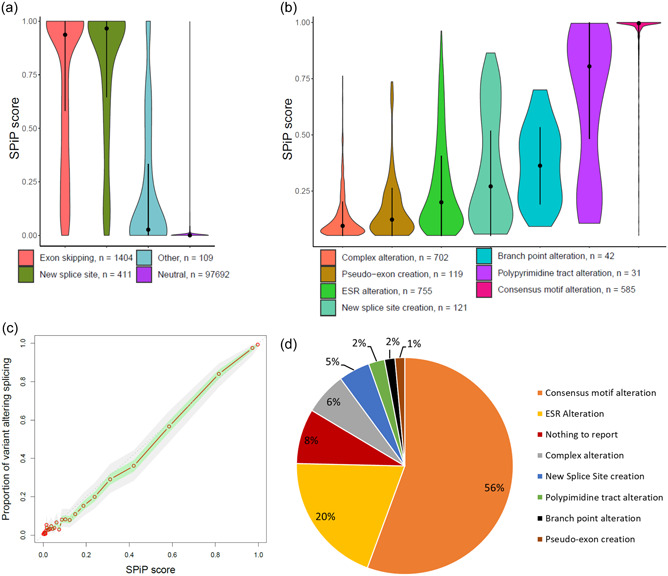
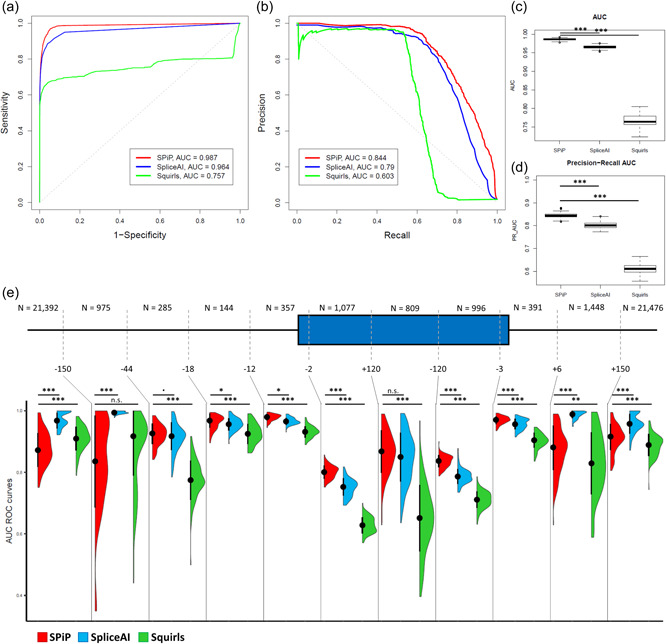
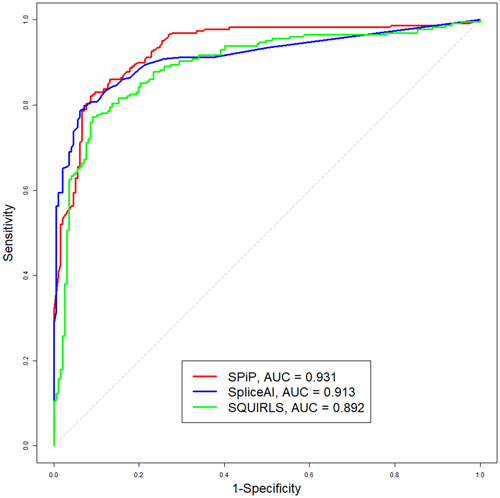
Modeling splicing is essential for tackling the challenge of variant interpretation as each nucleotide variation can be pathogenic by affecting pre-mRNA splicing via disruption/creation of splicing motifs such as 5'/3' splice sites, branch sites, or splicing regulatory elements. Unfortunately, most in silico tools focus on a specific type of splicing motif, which is why we developed the Splicing Prediction Pipeline (SPiP) to perform, in one single bioinformatic analysis based on a machine learning approach, a comprehensive assessment of the variant effect on different splicing motifs. We gathered a curated set of 4616 variants scattered all along the sequence of 227 genes, with their corresponding splicing studies. The Bayesian analysis provided us with the number of control variants, that is, variants without impact on splicing, to mimic the deluge of variants from high-throughput sequencing data. Results show that SPiP can deal with the diversity of splicing alterations, with 83.13% sensitivity and 99% specificity to detect spliceogenic variants. Overall performance as measured by area under the receiving operator curve was 0.986, better than SpliceAI and SQUIRLS (0.965 and 0.766) for the same data set. SPiP lends itself to a unique suite for comprehensive prediction of spliceogenicity in the genomic medicine era. SPiP is available at: https://sourceforge.net/projects/splicing-prediction-pipeline/.

Keywords: RNA; SPiP; machine learning; sequence variants; splicing predictions.


Conflict of interest statement

H. T. was employed by Interactive Biosoftware for the time period October 2015–September 2018 in the context of a public–private PhD project (CIFRE fellowship #2015/0335) partnership between INSERM and Interactive Biosoftware. The remaining authors declare no conflict of interest.

Figures

Figure 1
Figure 1
SPiP workflow. (a) The position of splicing motifs and their corresponding tool within the gene sequence. (b) Principle of random forest. The model generates several decision trees to classify variants according to the predictors, then the final outcome is the proportion of trees predicting an alteration. (c) Annotation pipeline of SPiP. In addition to the random forest predictions, SPiP displays which motifs are probably altered based on predictions of tools implemented in SPiP (Supporting Information: Figure S7). BPP, Branch Point Predictor; IntronBP, branch point region; IntronCons, intronic consensus splice site (either 3′ss or 5′ss); IntronPPT, polypyrimidine tract; ExonCons, exonic consensus splice site; MES, MaxEntScan; QUEPASA, Quantifying Extensive Phenotypic Arrays from Sequence Arrays; SPiCE, Splicing Prediction in Consensus Element; SPiP, Splicing Prediction Pipeline.
Figure 2
Figure 2
Characteristic of variants used in this study. (a) Distribution of splicing events observed for variants with RNA in vitro studies (N = 4616 variants). (b) Variant distribution along the pre‐mRNA molecule with their impact on splicing (N = 4616 variants). (c) Variant distribution, including “control variants” (SNPs with frequency >5%) (N = 99,616 variants). (d) Proportion of variants that impacts splicing all along the pre‐mRNA molecule (N = 99,616 variants). SNP, single‐nucleotide polymorphism.
Figure 3
Figure 3
Evaluation of SPiP on the validation set. (a) Distribution of SPiP scores according to the impact of variants on splicing: exon skipping, new splice site use, other (pseudo‐exon and pseudo‐intron retention) and neutral, without impact on splicing (N = 99,616). Black points represent the median value and black lines represent the interquartile range. (b) Among variants with positive prediction, the distribution of SPiP score according to the altered motif: alteration of consensus motif, alteration of polypyrimidine tract, alteration of branch point motif, creation of new splice site, alteration of ESR motifs, creation of pseudo‐exon, and complex alterations (several motifs impacted simultaneously). Black points represent the median value and black lines represent the interquartile range. (c) Correlation between the SPiP score and the proportion of spliceogenic variants. (d) Proportion of variants that impact splicing according to their predictions. ESR, exonic splicing regulator; NTR, nothing to report; SPiP, Splicing Prediction Pipeline.
Figure 4
Figure 4
Comparison of SPiP with SpliceAI and SQUIRLS performances on the validation set (N = 49,350 variants, validation data set minus those not scored by SpliceAI). (a) ROC curves of SPiP, SpliceAI, and SQUIRLS for a particular iteration. (b) Precision‐recall curve of SPiP, SpliceAI, and SQUIRLS for a particular iteration. (c) Distribution of AUC values for the 100 iterations. (d) AUC of precision‐recall curve for 100 iterations. (e) Performance of SPiP (red), SpliceAI (blue), and SQUIRLS (green) measured by AUC of ROC curves all along the pre‐mRNA molecule for the 100 iterations. Black dots represent the median and black segments represent the interquartile range. AUC, area under the curve; n.s., not significant; ROC, receiver‐operating characteristic; SPiP, Splicing Prediction Pipeline. p < 0.1; *p < 0.05; **p < 0.01; ***p < 0.001.
Figure 5
Figure 5
Performance of SPiP, SpliceAI, and SQUIRLS on the new collection of 426 variants

References

    1. Adamson, S. I. , Zhan, L. , & Graveley, B. R. (2018). Vex‐seq: High‐throughput identification of the impact of genetic variation on pre‐mRNA splicing efficiency. Genome Biology, 19, 71. - PMC - PubMed
    1. Anna, A. , & Monika, G. (2018). Splicing mutations in human genetic disorders: Examples, detection, and confirmation. Journal of Applied Genetics, 59, 253–268. - PMC - PubMed
    1. Buratti, E. , Chivers, M. , Královičová, J. , Romano, M. , Baralle, M. , Krainer, A. R. , & Vořechovský, I. (2007). Aberrant 5′ splice sites in human disease genes: Mutation pattern, nucleotide structure and comparison of computational tools that predict their utilization. Nucleic Acids Research, 35, 4250–4263. - PMC - PubMed
    1. Callebaut, I. , Joubrel, R. , Pissard, S. , Kannengiesser, C. , Gerolami, V. , Ged, C. , Cadet, E. , Cartault, F. , Ka, C. , Gourlaouen, I. , Gourhant, L. , Oudin, C. , Goossens, M. , Grandchamp, B. , De Verneuil, H. , Rochette, J. , Ferec, C. , & Le Gac, G. (2014). Comprehensive functional annotation of 18 missense mutations found in suspected hemochromatosis type 4 patients. Human Molecular Genetics, 23, 4479–4490. - PubMed
    1. Casadei, S. , Gulsuner, S. , Shirts, B. H. , Mandell, J. B. , Kortbawi, H. M. , Norquist, B. S. , Swisher, E. M. , Lee, M. K. , Goldberg, Y. , O'Connor, R. , Tan, Z. , Pritchard, C. C. , King, M. C. , & Walsh, T. (2019). Characterization of splice‐altering mutations in inherited predisposition to cancer. Proceedings of the National Academy of Sciences, 116, 26798–26807. - PMC - PubMed

Publication types

Substances