. 2022 Dec:492:200-211.
doi: 10.1016/j.ydbio.2022.10.003. Epub 2022 Oct 21.

GLH-1/Vasa represses neuropeptide expression and drives spermiogenesis in the C. elegans germline

Affiliations

GLH-1/Vasa represses neuropeptide expression and drives spermiogenesis in the C. elegans germline

Jesse D Rochester et al. Dev Biol. 2022 Dec.

Abstract

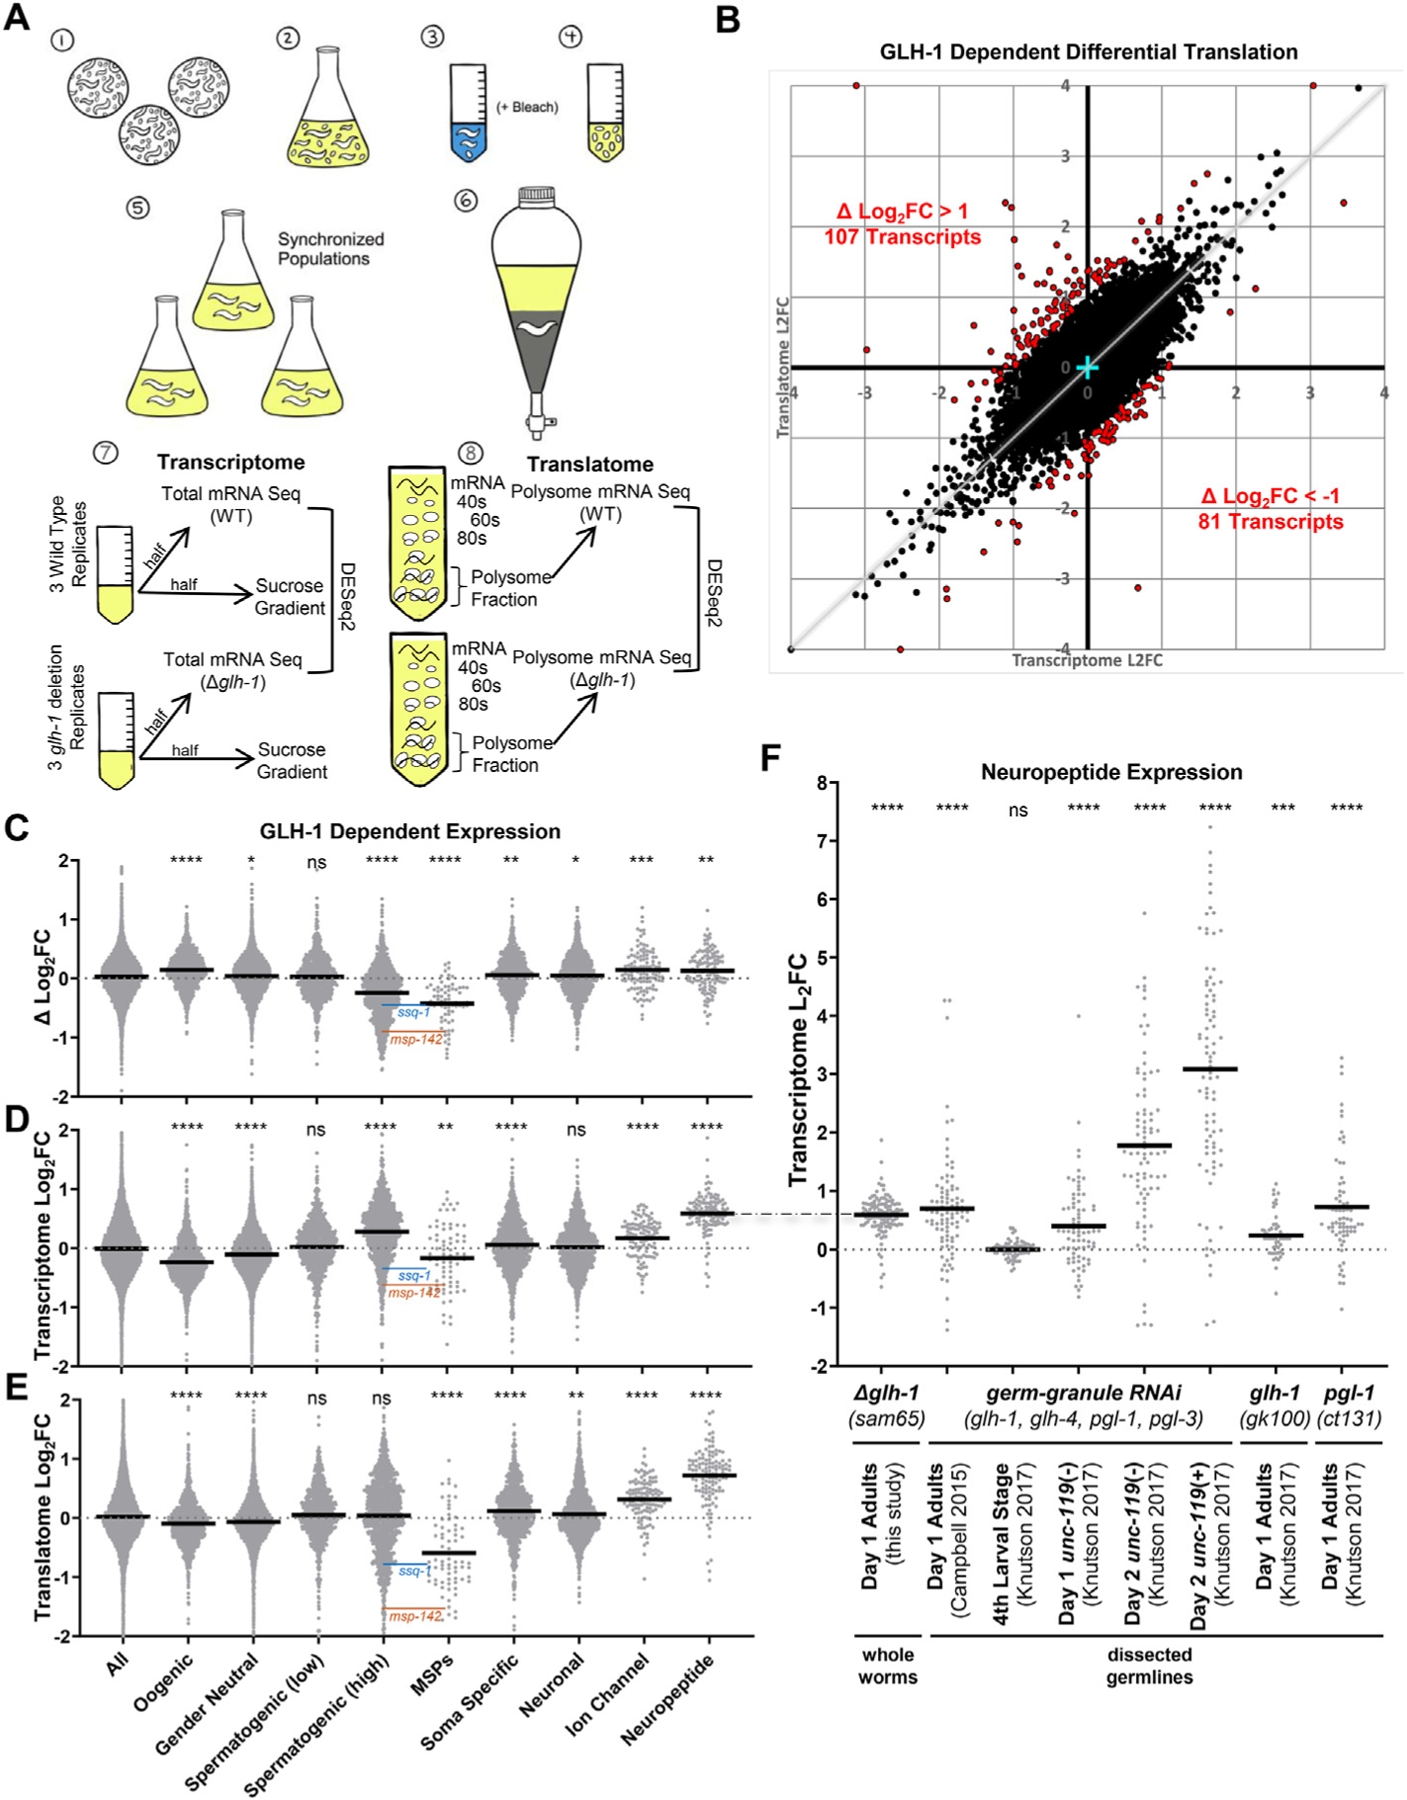
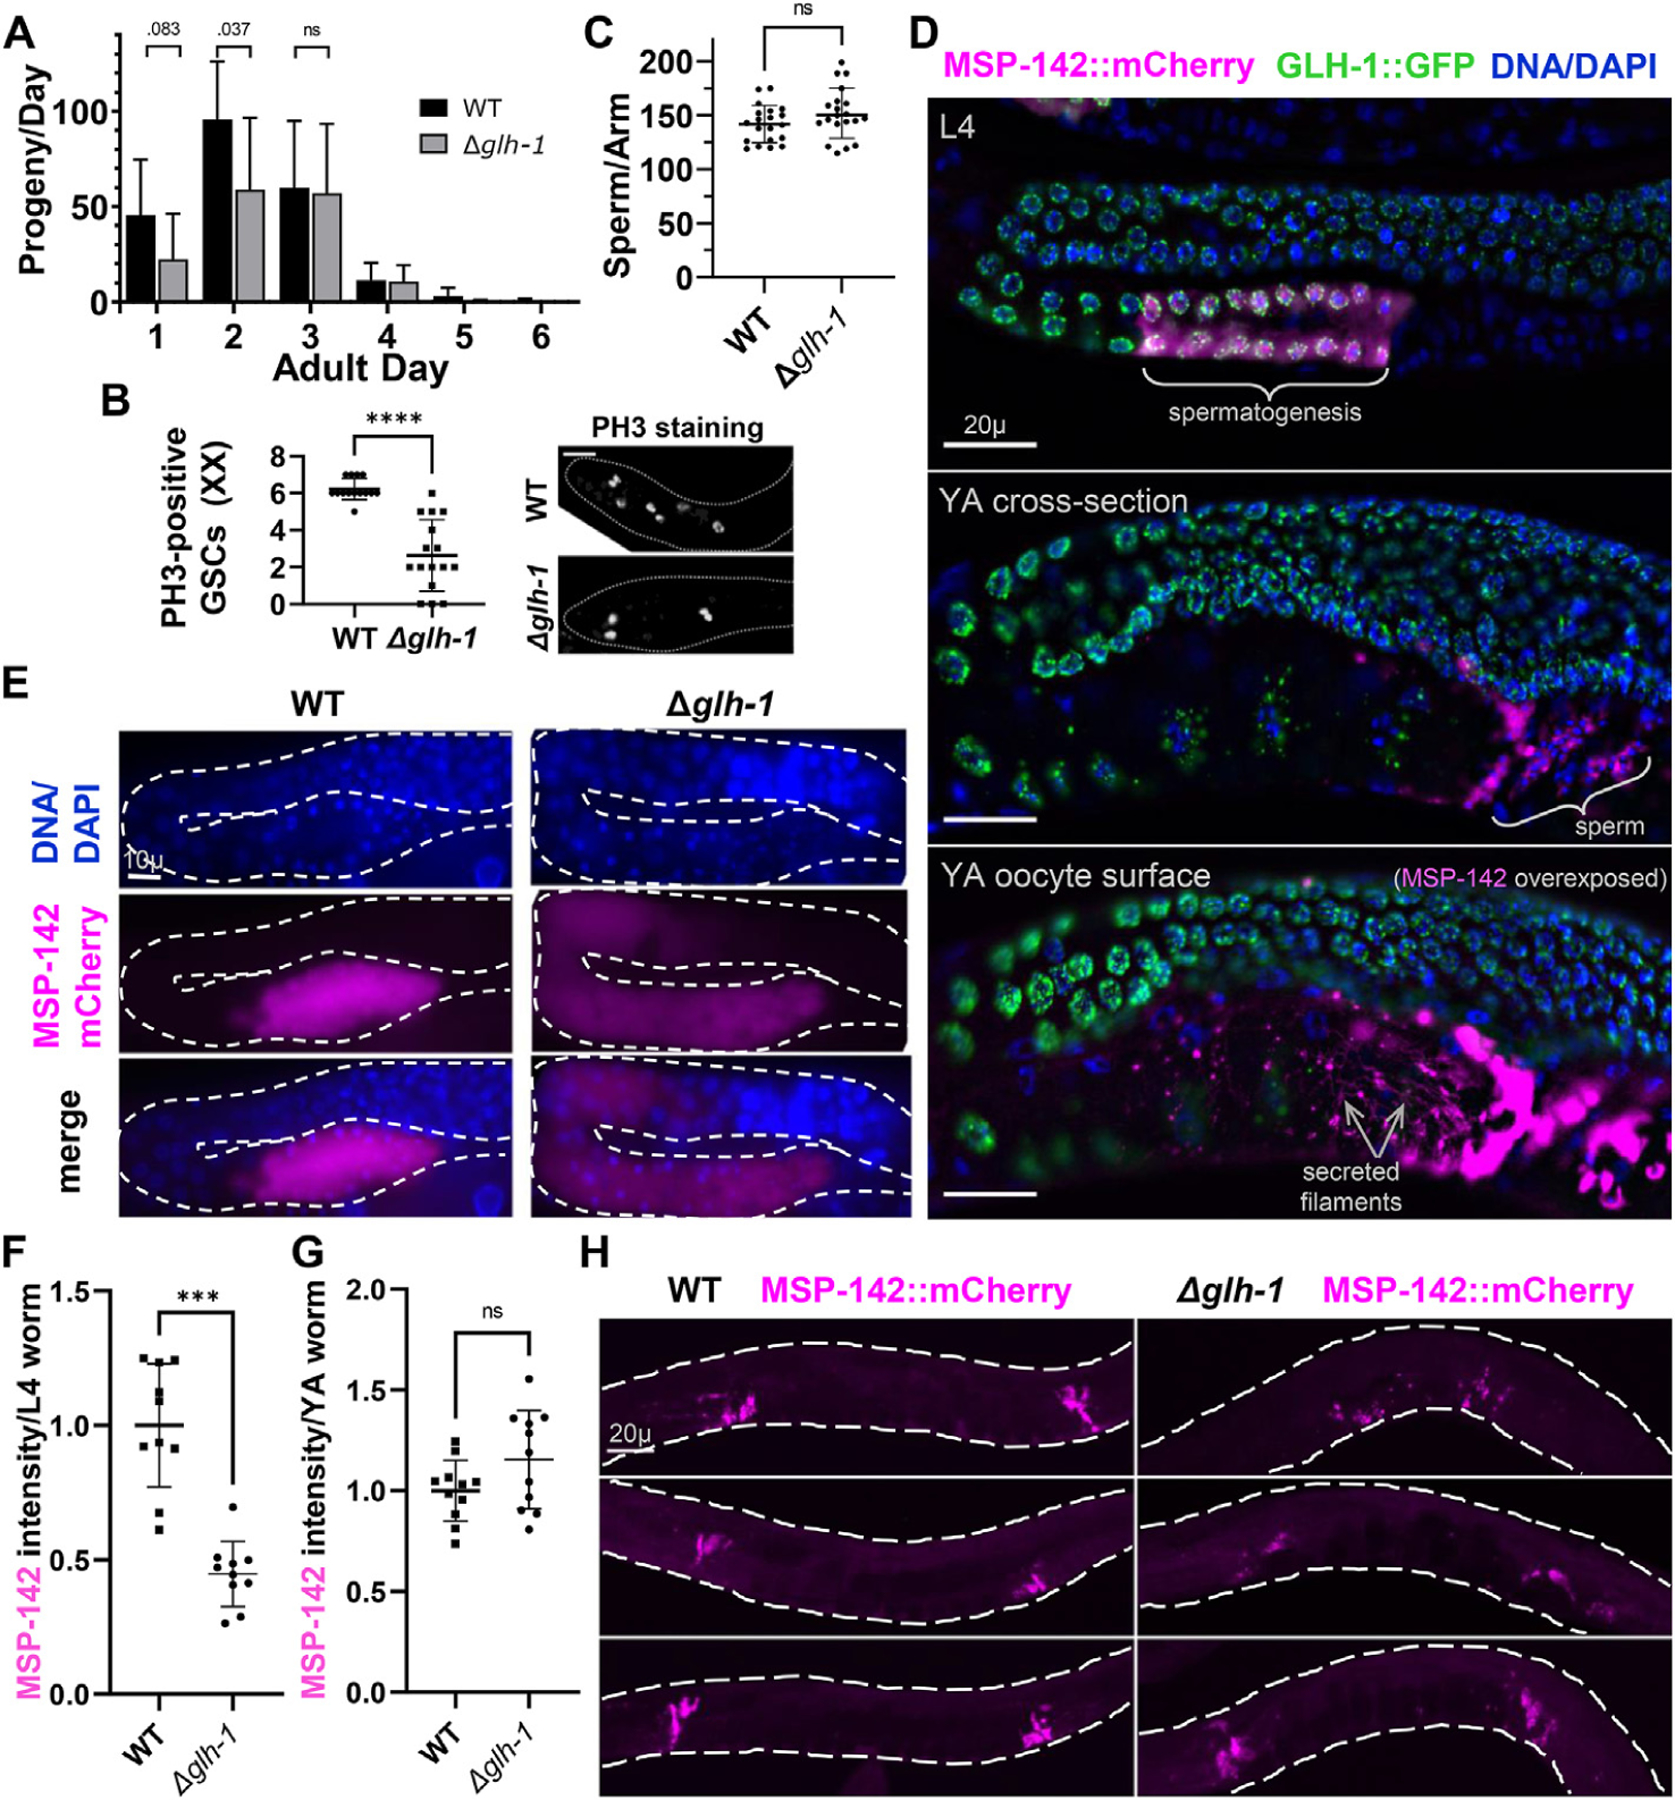
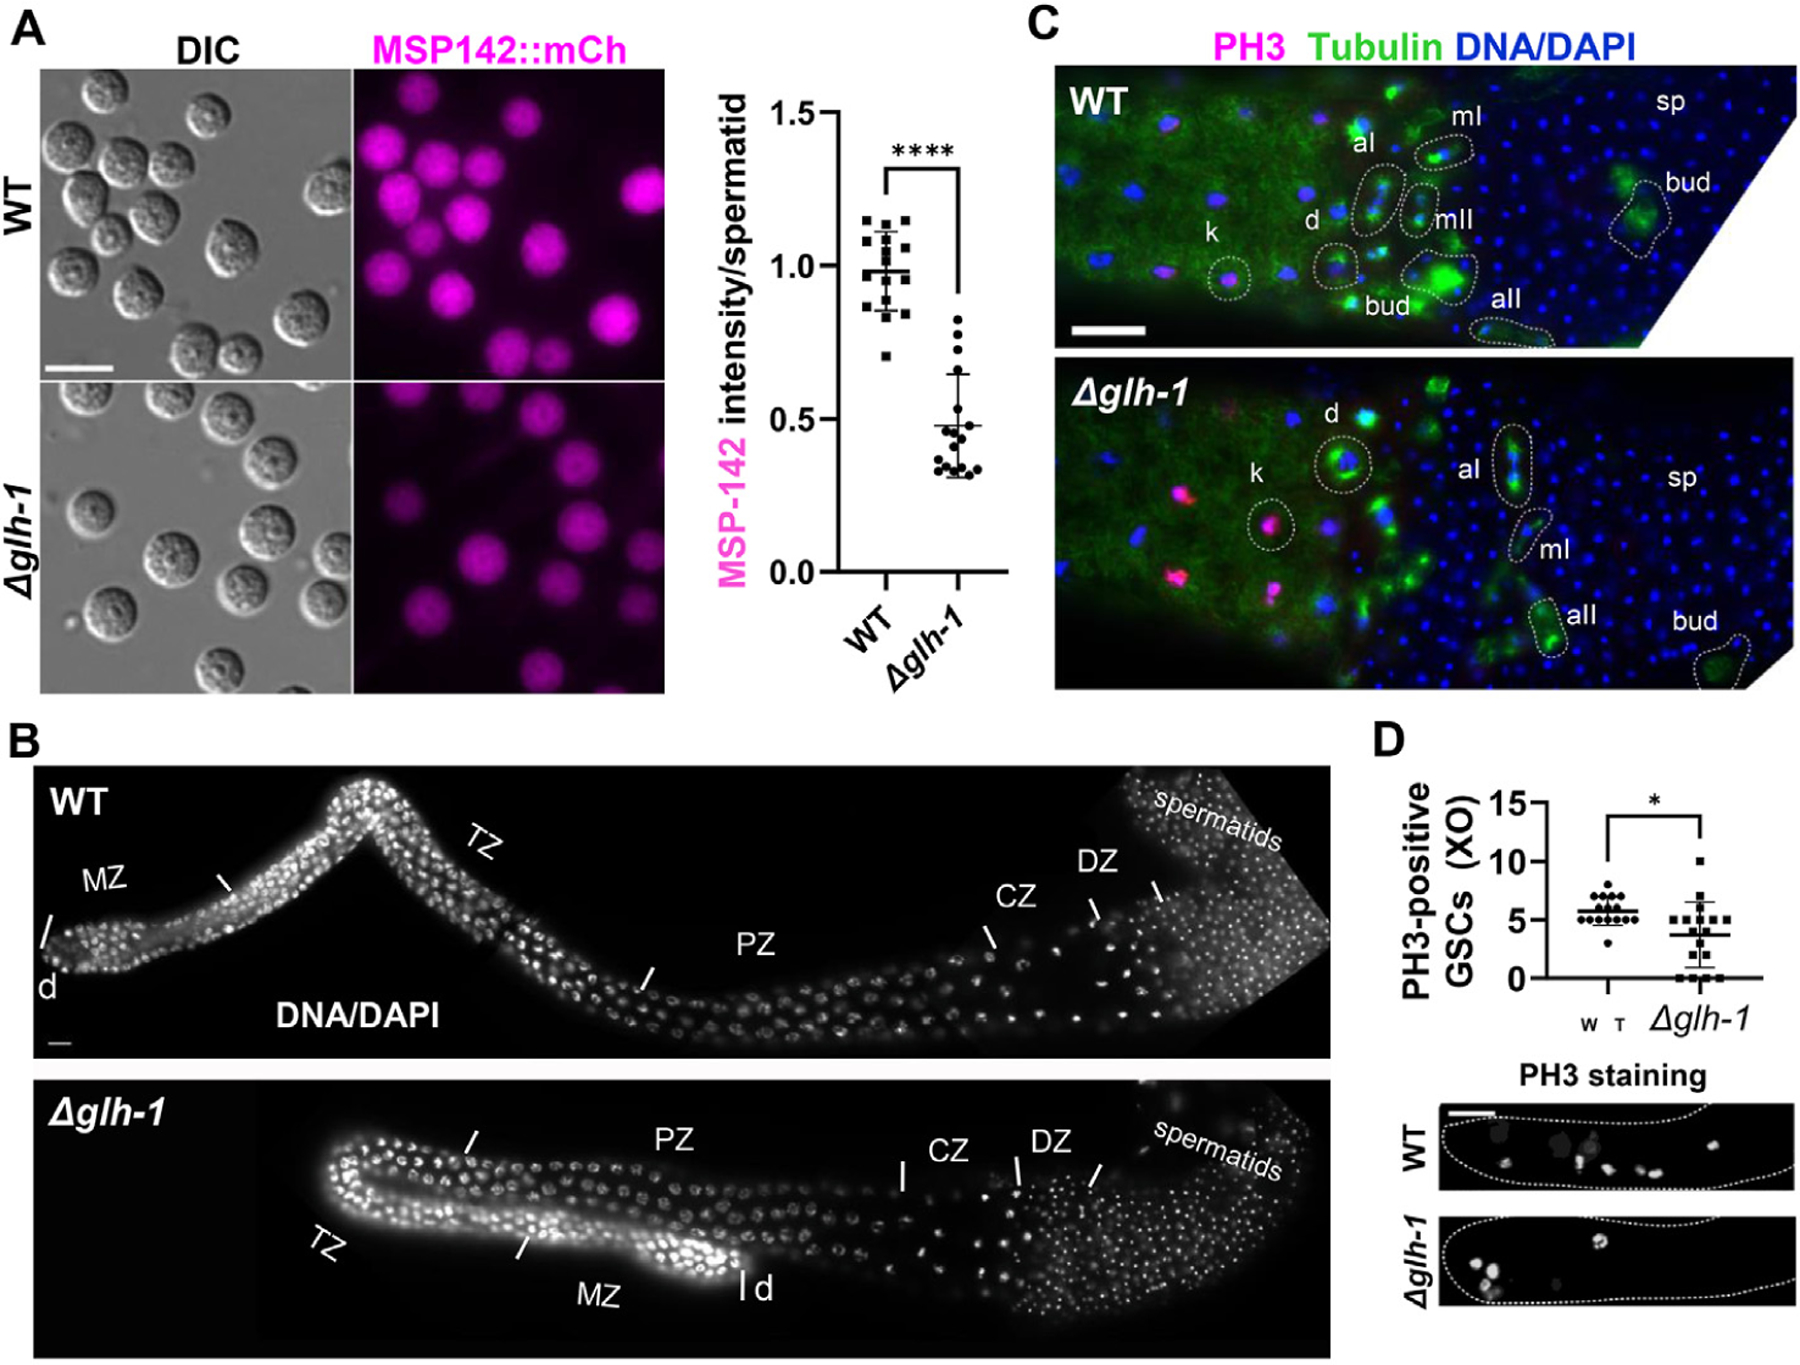
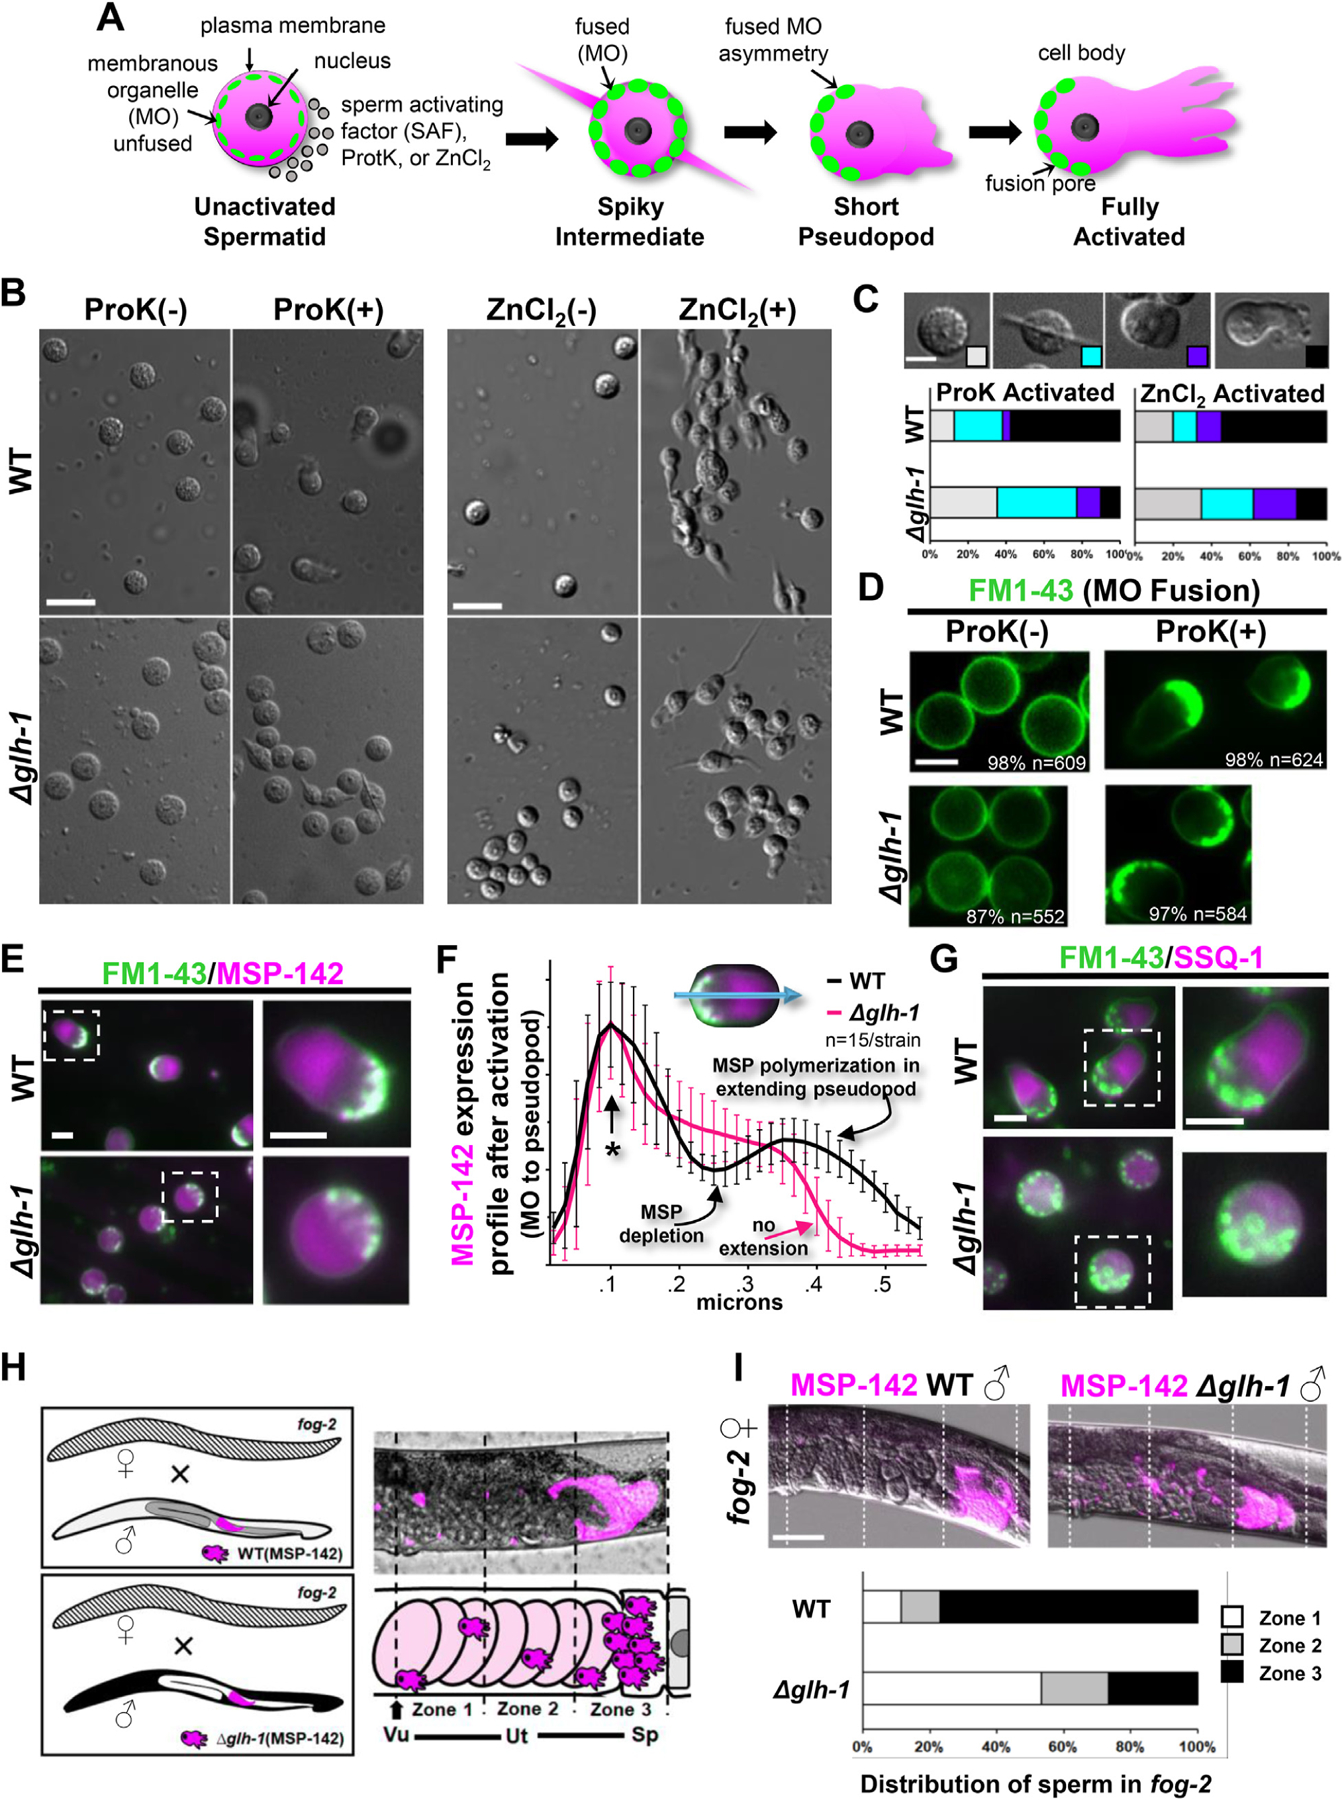
Germ granules harbor processes that maintain germline integrity and germline stem cell capacity. Depleting core germ granule components in C. elegans leads to the reprogramming of germ cells, causing them to express markers of somatic differentiation in day-two adults. Somatic reprogramming is associated with complete sterility at this stage. The resulting germ cell atrophy and other pleiotropic defects complicate our understanding of the initiation of reprogramming and how processes within germ granules safeguard the totipotency and immortal potential of germline stem cells. To better understand the initial events of somatic reprogramming, we examined total mRNA (transcriptome) and polysome-associated mRNA (translatome) changes in a precision full-length deletion of glh-1, which encodes a homolog of the germline-specific Vasa/DDX4 DEAD-box RNA helicase. Fertile animals at a permissive temperature were analyzed as young adults, a stage that precedes by 24 ​h the previously determined onset of somatic reporter-gene expression in the germline. Two significant changes are observed at this early stage. First, the majority of neuropeptide-encoding transcripts increase in both the total and polysomal mRNA fractions, suggesting that GLH-1 or its effectors suppress this expression. Second, there is a significant decrease in Major Sperm Protein (MSP)-domain mRNAs when glh-1 is deleted. We find that the presence of GLH-1 helps repress spermatogenic expression during oogenesis, but boosts MSP expression to drive spermiogenesis and sperm motility. These insights define an early role for GLH-1 in repressing somatic reprogramming to maintain germline integrity.

Keywords: C. elegans; DDX4; GLH-1; Germ granules; Germline; MSP; Major sperm protein; Neuropeptides; P granules; Polysomes; Sperm; Spermiogenesis; Vasa.


Figures

Fig. 1.
Fig. 1.
GLH-1 impact on the transcriptome and translatome. A) Schematic of expression profiling experiments. Starved plates (1) were used to inoculate S-media cultures containing freeze-dried OP50 (2). Following incubation at 20 °C, gravid adults were beach treated (3) to harvest embryos (4). Embryos were hatched overnight on unseeded plates to obtain a synchronized population and used to inoculate new S-media cultures containing freeze-dried OP50 (5). Following incubation at 20 °C, young adults were precipitated, washed, and flash-frozen (6). Lysates were prepared from the synchronized WT and Δglh-1 mutants. Half of the lysate was used for total mRNA isolation (7), while the other half was placed in a sucrose gradient for polysome fractionation (8). B) Log2(Fold Change) from total mRNA-seq (transcriptome, X-axis) plotted against the Log2(Fold Change) from polysome mRNA-seq (translatome, Y-axis). Red points indicate differentially translated transcripts where the ΔLog2FC (difference between transcriptome and translatome) was >1 (107 transcripts) or < −1 (81 transcripts). Four data points fell outside the boundaries of the graph and are shown on edge. Cyan cross marks 0,0. Grey diagonal indicates a 1 to 1 correlation between the transcriptome and translatome. Violin plots showing Log2(Fold Change) in C) translation efficiency (difference between transcriptome and translatome), D) transcriptome, and E) translatome in Δglh-1 mutants compared to WT. F) Violin plots showing Log2(Fold Change) of neuropeptide mRNA accumulation in this and other datasets. For C–F, bold horizontal line = mean, and significance from “all” shown as ****p < 0.0001, ***p < 0.001, **p < 0.01, *p < 0.05, ns p > 0.05. ssq-1 (blue) and msp-142 (orange) levels are indicated in the Spermatogenic (high) and MSP datasets. The dash-dot line connecting D to F indicates a duplication of the same Day 1 Adult data in both panels.
Fig. 2.
Fig. 2.
GLH-1 impact on fertility and MSP-142 expression. A) Self-fertility of hermaphrodites in WT and Δglh-1 mutants during adulthood. B) Quantification of PH3-positive germ cells in distal gonadal ends in WT (n = 14) and Δglh-1 mutant (n = 16) hermaphrodite gonads. Fluorescence images of distal gonadal ends in WT and Δglh-1 mutant gonads immunostained with the anti-PH3 antibody. Representative images are shown. The dashed lines indicate the shape of gonad arms: scale bar, 20 μm. C) Quantification of the number of DAPI-stained sperm in WT Δglh-1 mutant hermaphrodites. D) GLH-1:GFP and MSP-142:mCherry expression in L4-stage and young adult (YA) stage animals. Expression of MSP-142 at the YA stage. Gonads were fixed and counter-stained with DAPI (blue): scale bars, 20 μm. E) MSP-142:mCherry expression in L4 stage WT and Δglh-1 mutant animals. Gonads were fixed and counter-stained with DAPI (blue): scale bar, 10 μm. F and G) Quantification of MSP-142:mCherry intensity in WT (n = 10 for F, n = 11 for G) and Δglh-1 mutant (n = 10 for F, n = 11 for G) L4 and YA stage animals. H) Representative images of MSP-142:mCherry in WT and Δglh-1 mutant young adults: scale bar, 20 μm. Error bars indicate s.d., ****p < 0.0001, ***p < 0.001, ns p > 0.05.
Fig. 3.
Fig. 3.
Male germline dependence on GLH-1. A) Fluorescence live images of spermatids dissected from MSP-142:mCherry males in WT and Δglh-1 mutants: scale bar, 8 μm. The plot shows the MSP-142:mCh fluorescence intensity in spermatids from WT and Δglh-1 mutant males. n = 16 for WT, n = 17 for Δglh-1. Error bars indicate s.d. ****, p < 0.0001. B) DAPI-stained YA male dissected gonads labeled by the following developmental stages: d, distal end. MZ, mitotic zone. TZ, transition zone. PZ, pachytene zone. CZ, condensation zone. DZ, division zone: scale bar, 10 μm. C) Spermatogenesis stages are similar in WT and Δglh-1 mutant males. Meiosis I and II were observed in dissected WT (n = 20) and Δglh-1 mutant (n = 20) male gonads after co-immunostaining with anti-PH3 (magenta), anti-α-tubulin (green), and DAPI (blue). k, karyosome. d, diakinesis. mI, metaphase I. aI, anaphase I. mII, metaphase II. aII, anaphase II. bud, budding spermatid. sp, spermatid: scale bar, 10 μm. D) Quantification of PH3-positive germ cells in distal gonadal ends in WT (n = 16) and Δglh-1 mutant (n = 17) male gonads. Error bars indicate s.d. *, p < 0.05. Representative images are shown. Dashed lines indicate the shape of gonad arms: scale bar, 20 μm.
Fig. 4.
Fig. 4.
GLH-1 impact on sperm activation. A) Activation of spermatozoa during C. elegans spermiogenesis. Treatment of C. elegans spermatids with spermatid-activating factors (SAFs) stimulates the round spermatids to extend pseudopods, transforming them into motile spermatozoa. Membranous organelles (MOs) fuse with the plasma membrane to release contents into the extracellular space. B) Live images of sperm after in vitro activation by Proteinase K (ProK) or ZnCl2 treatment from WT and Δglh-1 mutant males. Representative images are shown: scale bar, 8 μm. C) Categorized morphologies of sperm after in vitro activation by ProK or ZnCl2. Stages were defined by the morphology of sperm and its pseudopod extension observed by DIC microscope: scale bar, 4 μm. Quantification of sperm of WT (n = 118 for ProK activation, n = 146 for ZnCl2 activation) and Δglh-1 mutant (n = 198 for ProK activation, n = 199 for ZnCl2 activation). D) Live fluorescent images of sperm from WT and Δglh-1 mutant males stained with FM1–43 to observe MOs after in vitro activation by ProK. Representative images are shown, with the percent and number of sperm with the pictured FM1–43 distribution: scale bar, 4 μm. E) Live fluorescent images of sperm from WT and Δglh-1 mutant males stained with FM1–43 after in vitro activation by ProK treatment: scale bar, 4 μm. F) Average expression intensity profiles (ImageJ) of MSP-142:mCherry in sperm stained with FM1–43 following in vitro activation by ProK. Error bars indicate s.d. An asterisk marks the FM1–43 stained end of activated sperm, where plot profiles were aligned: scale bar, 4 μm. G) Live fluorescent images of sperm stained with FM1–43 after in vitro activation by ProK treatment on SSQ-1:mCherry from WT and Δglh-1 mutant males: scale bar, 4 μm. H) Scheme of sperm migration assay. WT and Δglh-1 mutant MSP-142:mCherry expressing males were crossed to fog-2 females. The uterus was divided into 3 zones from the vulva (zone 1, arrow) to the spermatheca (zone 3). Vu, vulva. Ut, uterus. Sp, spermatheca. I) Quantification of WT and Δglh-1 mutant male sperm migration in fog-2 females (n = 26 for WT male, n = 30 for Δglh-1 mutant male). The fluorescent intensity of each zone was measured and calculated proportionally against the total fluorescent intensity of all three zones: scale bar, 50 μm.

References

    1. Bezares-Calderon LA, Becerra A, Salinas LS, Maldonado E, Navarro RE, 2010. Bioinformatic analysis of P granule-related proteins: insights into germ granule evolution in nematodes. Dev. Gene. Evol 220, 41–52. 10.1007/s00427-010-0327-3. - DOI - PubMed
    1. Bray Nicolas L., et al., 2016. Near-optimal probabilistic RNA-seq quantification. Nature Biotech 34 (5), 525–527. 10.1038/nbt.3519. - DOI - PubMed
    1. Brenner S, 1974. The genetics of Caenorhabditis elegans. Genetics 77, 71–94. - PMC - PubMed
    1. Campbell AC, Updike DL, 2015. CSR-1 and P granules suppress sperm-specific transcription in the C. elegans germline. Development 142, 1745–1755. 10.1242/dev.121434. - DOI - PMC - PubMed
    1. Cao Y, 2022. Neural is fundamental: neural stemness as the ground state of cell tumorigenicity and differentiation potential. Stem Cell Rev Rep 18 (1), 37–55. 10.1007/s12015-021-10275-y. - DOI - PubMed

Publication types