. 2022 Oct 23;13(1):6318.
doi: 10.1038/s41467-022-34096-w.

A noncanonical function of EIF4E limits ALDH1B1 activity and increases susceptibility to ferroptosis

Affiliations

A noncanonical function of EIF4E limits ALDH1B1 activity and increases susceptibility to ferroptosis

Xin Chen et al. Nat Commun. .

Abstract

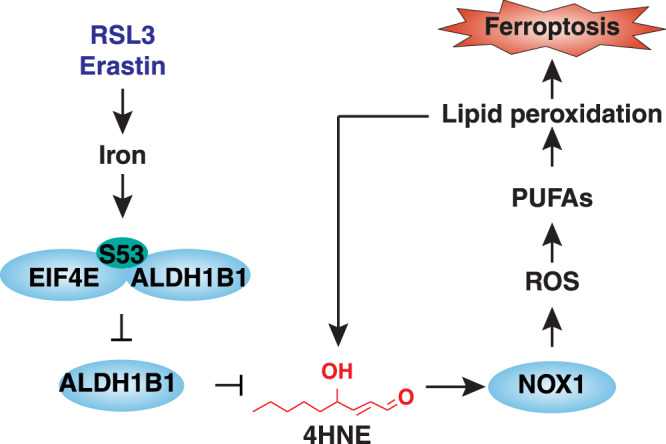
Ferroptosis is a type of lipid peroxidation-dependent cell death that is emerging as a therapeutic target for cancer. However, the mechanisms of ferroptosis during the generation and detoxification of lipid peroxidation products remain rather poorly defined. Here, we report an unexpected role for the eukaryotic translation initiation factor EIF4E as a determinant of ferroptotic sensitivity by controlling lipid peroxidation. A drug screening identified 4EGI-1 and 4E1RCat (previously known as EIF4E-EIF4G1 interaction inhibitors) as powerful inhibitors of ferroptosis. Genetic and functional studies showed that EIF4E (but not EIF4G1) promotes ferroptosis in a translation-independent manner. Using mass spectrometry and subsequent protein-protein interaction analysis, we identified EIF4E as an endogenous repressor of ALDH1B1 in mitochondria. ALDH1B1 belongs to the family of aldehyde dehydrogenases and may metabolize the aldehyde substrate 4-hydroxynonenal (4HNE) at high concentrations. Supraphysiological levels of 4HNE triggered ferroptosis, while low concentrations of 4HNE increased the cell susceptibility to classical ferroptosis inducers by activating the NOX1 pathway. Accordingly, EIF4E-dependent ALDH1B1 inhibition enhanced the anticancer activity of ferroptosis inducers in vitro and in vivo. Our results support a key function of EIF4E in orchestrating lipid peroxidation to ignite ferroptosis.


Conflict of interest statement

The authors declare no competing interests.

Figures

Fig. 1
Fig. 1. 4EGI-1 and 4E1RCat act as ferroptosis inhibitors.
a Flow chart of our screening strategy. b Cell viability of HT-1080 cells following treatment with RSL3 (0.5 μM) in the absence or presence of 4EGI-1 (10, 5, 2.5, 1.25 μM) or 4E1RCat (10, 5, 2.5, 1.25 μM) for 24 h. Mean ± SD, n = 3. c Cell viability of HT-1080 cells following treatment with RSL3 (0.5 μM), erastin (5 μM), ML162 (0.5 μM), ML210 (5 μM), FIN56 (2.5 μM), or FINO2 (10 μM) in the absence or presence of 4EGI-1 (10 μM) or 4E1RCat (10 μM) for 24 h. Mean ± SD, n = 3. d The accumulation of iron in HT-1080 and Calu-1 cells treated with RSL3 (0.5 μM) or erastin (5 μM) in the absence or presence of 4EGI-1 (10 μM) or 4E1RCat (10 μM) for 24 h. Mean ± SD, n = 3. e The accumulation of lipid hydroperoxides in HT-1080 and Calu-1 cells treated with RSL3 (0.5 μM, 4 h) or erastin (5 μM, 6 h) in the absence or presence of 4EGI-1 (10 μM) or 4E1RCat (10 μM). Mean ± SD, n = 3. f, g The antioxidant activity of the indicated compounds (10 μM) was analyzed by a 2,2-diphenyl-1-picrylhydrazyl (DPPH) or FENIX (STY-BODIPY) assay. Mean ± SD, n = 4; one-way ANOVA with Tukey’s multiple comparisons test. h The iron chelator activity of the indicated compounds (40 μM) was analyzed by using the ferrozine Fe2+ binding assay. Mean ± SD, n = 3; one-way ANOVA with Tukey’s multiple comparisons test. i, j Cell viability and intracellular glutathione (GSH) level of Calu-1 cells following treatment with RSL3 (0.5 μM) or erastin (5 μM) in the absence or presence of 4EGI-1 (10 μM), 4E1RCat (10 μM), or ferrostatin-1 (Fer-1, 1 μM) for 72 h. Mean ± SD, n = 3; two-way ANOVA with Tukey’s multiple comparisons test. k Immunoprecipitation (IP) analysis of EIF4E-binding proteins in Calu-1 cells following treatment with 4EGI-1 (10 μM) or 4E1RCat (10 μM) for 24 h. IB immunoblot. Mean ± SD, n = 3; one-way ANOVA with Tukey’s multiple comparisons test.
Fig. 2
Fig. 2. EIF4E mediates ferroptosis independent of protein synthesis.
a Western blot analysis of the indicated proteins in control and EIF4E-knockdown (EIF4EKD) HT-1080 and Calu-1 cells. b Analysis of cell viability in the indicated cells following treatment with RSL3 or erastin for 24 h. Mean ± SD, n = 3. c Analysis of cell death in the indicated cells following treatment with RSL3 (0.5 μM) or erastin (5 μM) for 24 h. Mean ± SD, n = 3. d Analysis of lipid peroxidation in the indicated cells following treatment with RSL3 (0.5 μM, 4 h) or erastin (5 μM, 6 h). Mean ± SD, n = 3. e Analysis of iron accumulation in the indicated cells following treatment with RSL3 (0.5 μM) or erastin (5 μM) for 24 h. Mean ± SD, n = 3. f Western blot analysis of the indicated proteins in HT-1080 and Calu-1 cells following treatment with RSL3 (0.5 μM) or erastin (5 μM). FBS: medium having 20% fetal bovine serum for 9 h. g, h Western blot analysis of puromycylated peptides in HT-1080 and Calu-1 cells following treatment with RSL3 (0.5 μM), erastin (5 μM), 4EGI-1 (10 μM), or 4E1RCat (10 μM). The cells were incubated with or without puromycin (10 μg/ml) for 10 min prior to cell lysis. i Western blot analysis of the indicated proteins in HT-1080 and Calu-1 cells following treatment with RSL3 (0.5 μM) or erastin (5 μM) for 9 h. j The EIF4E-knockdown HT-1080 cells (EIF4EKD1) were transfected with wild-type (WT) EIF4E or EIF4E-S209A mutant along with cap-dependent luciferase reporter cDNA. 48 h after transfection, the transfected cells were treated with 4EGI-1 (10 μM) or 4E1RCat (10 μM) and harvested for luciferase assay (RLA). Mean ± SD, n = 3; one-way ANOVA with Tukey’s multiple comparisons test; ns not significant. k Analysis of cell death in indicated HT-1080 cells following treatment with RSL3 (0.5 μM) or erastin (5 μM) for 24 h. Mean ± SD, n = 3. l Western blot analysis of protein expression in indicated HT-1080 cells.
Fig. 3
Fig. 3. The EIF4E-ALDH1B1 complex facilities ferroptosis.
a HT-1080 and Calu-1 cells were treated with RSL3 (0.5 μM, 4 h). EIF4E was immunoprecipitated using an anti-EIF4E antibody and subjected to mass spectrometry analysis. b Analysis of indicated mRNA in the corresponding siRNA knockdown EIF4EKD HT-1080 and EIF4EKD Calu-1 cells (n = 3). c Cell viability of indicated cells treated with RSL3 (0.5 μM) or erastin (5 μM) for 24 h (n = 3). d Western blot analysis of protein expression in indicated cells. e Cell death analysis of indicated cells treated with RSL3 (0.5 μM), erastin (5 μM), or ferrostatin-1 (Fer-1; 1 μM) for 24 h. Mean ± SD, n = 3; two-way ANOVA with Tukey’s multiple comparisons test. f, g Immunoprecipitation (IP) analysis of EIF4E-binding proteins in indicated cells treated with RSL3 (0.5 μM), 4EGI-1 (10 μM), or 4E1RCat (10 μM) for 4 h. Mean ± SD, n = 3; one-way ANOVA with Tukey’s multiple comparisons test. IB immunoblot. h Western blot analysis of whole-cell lysates (WCL) or cell fractionation (C: cytoplasmic; M: membrane/organelle; N: nuclear/cytoskeletal) of indicated cells treated with RSL3 (0.5 μM, 4 h). i Western blot analysis of the indicated proteins in indicated cells treated with RSL3 (0.5 μM) or erastin (5 μM) for the indicated time. j, l Immunoprecipitation (IP) analysis of EIF4E-ALDH1B1 complex in whole-cell extracts (j) or membrane protein extracts (l) of Calu-1 cells treated with RSL3 (0.5 μM) and/or deferoxamine (100 μM) for 4 h. Mean ± SD, n = 3; one-way ANOVA with Tukey’s multiple comparisons test. IB immunoblot. k Analysis of intracellular iron in Calu-1 cells treated with RSL3 (0.5 μM), 20% FBS, or staurosporine (0.25 μM) for 4 h. Mean ± SD, n = 3; one-way ANOVA with Tukey’s multiple comparisons test. m His-tag affinity pull-down analysis of the binding of recombinant protein EIF4E to ALDH1B1 or ALDH3A1. n Immunoprecipitation (IP) analysis of EIF4E-ALDH1B1 complex in indicated Calu-1 cells treated with RSL3 (0.5 μM, 4 h). IB immunoblot. o Cell death analysis of indicated Calu-1 cells treated with RSL3 (0.5 μM, 24 h). Mean ± SD, n = 3.
Fig. 4
Fig. 4. 4HNE is a product and mediator of ferroptosis.
a Immunofluorescence analysis showing staining of 4HNE in indicated Calu-1 cells treated with RSL3 (0.5 μM, 4 h) (scale bar = 10 µm). Mean ± SD, n = 3; two-way ANOVA with Tukey’s multiple comparisons test. b Cell viability of control and ALDH1B1-overexpressing (ALDH1B1OE) HT-1080 and Calu-1 cells treated with 4HNE for 24 h. Mean ± SD, n = 3. c Cell viability of ALDH1B1-knockdown HT-1080 and Calu-1 cells treated with 4HNE (50 μM) and/or ferrostatin-1 (Fer-1; 1 μM)/ZVAD-FMK (10 μM) for 24 h. Mean ± SD, n = 3; one-way ANOVA with Tukey’s multiple comparisons test. d Cell viability of indicated HT-1080 cells treated with RSL3 (0.5 μM) and erastin (5 μM) in the absence or presence of 4HNE (12.5 μM) for 24 h. Mean ± SD, n = 3; two-way ANOVA with Tukey’s multiple comparisons test. e, f Cell death (e, 24 h) or lipid peroxidation (f, 6 h) of indicated cells treated with 4HNE (12.5 μM), RSL3 (0.1 μM), and erastin (1 μM) in the absence or presence of ferrostatin-1 (Fer-1; 1 μM), 4EGI-1 (10 μM), 4E1RCat (10 μM), ZVAD-FMK (10 μM), necrosulfonamide (NSA; 1 µM), 2-acetylphenothiazine (2AC; 10 μM), diphenyleneiodonium (DPI; 1 μM), baicalein (10 μM), or zileuton (10 μM) (n = 3). g NOX activity of indicated cells treated with IL4 (50 ng/ml) or 4HNE (12.5 μM) plus RSL3 (0.1 μM) or erastin (1 μM) for 6 h. Mean ± SD, n = 3. h Analysis of gene expression in indicated cells treated with 4HNE (12.5 μM) in the presence of RSL3 (0.1 μM) or erastin (1 μM) for 24 h (n = 3). i Analysis of NOX1 and CYBB/NOX2 gene expression in indicated cells. Mean ± SD, n = 3. j Cell death of indicated cells treated with 4HNE (12.5 μM) plus RSL3 (0.1 μM) or erastin (1 μM) for 24 h. Mean ± SD, n = 3. k Lipid peroxidation of indicated cells treated with 4HNE (12.5 μM) plus RSL3 (0.1 μM, 4 h) or erastin (1 μM, 6 h). Mean ± SD, n = 3.
Fig. 5
Fig. 5. EIF4E and ALDH1B1 regulates ferroptosis sensitivity in vivo.
a A scheme of treatment in an HT-1080 xenograft tumor model with IKE. Athymic nude mice were injected subcutaneously with indicated ALDH1B1-knockdown (ALDH1B1KD) or EIF4E-knockdown (EIF4EKD) HT-1080 cells for 7 days and then treated with IKE (40 mg/kg, i.p., once every other day) at day 7 for 2 weeks. b Tumor volumes were calculated weekly (n = 6 mice/group; two-way ANOVA with Tukey’s multiple comparisons test; data are presented as mean ± SD). c Photographs of isolated tumors on day 14 after treatment. di The levels of 4HNE (d) and PTGS2 mRNA (e) in isolated tumors, serum HMGB1 (f), caspase-3 activity (g), ALDH1B1 protein (h), and EIF4E protein (i) in isolated tumors at day 14 after treatment were assayed (n = 6 mice/group; two-way ANOVA with Tukey’s multiple comparisons test; data were presented as mean ± SD).
Fig. 6
Fig. 6. 4HNE suppresses tumor growth by inducing ferroptosis in vivo.
a Athymic nude mice were injected subcutaneously with HT-1080 cells for 7 days and then given intratumoral treatment with 4HNE (5 mg/kg, once every other day) in the absence or presence of ZVAD-FMK (5 mg/kg, once every other day) or liproxstatin-1 (5 mg/kg, once every other day) at day 7 for 2 weeks. Tumor volumes were calculated weekly (n = 6 mice/group; two-way ANOVA with Tukey’s multiple comparisons test; data were presented as mean ± SD). b Photographs of isolated tumors on day 14 after treatment. ch The levels of PTGS2 mRNA (c), serum HMGB1 (d), and caspase-3 activity in isolated tumors (e); body weight (f), serum ALT (g), and serum BUN (h) at day 14 after treatment were assayed (n = 6 mice/group; one-way ANOVA with Tukey’s multiple comparisons test; data were presented as mean ± SD). i Athymic nude mice were injected subcutaneously with indicated HT-1080 cells for 7 days and then given intratumoral treatment with 4HNE (5 mg/kg, once every other day) at day 7 for 2 weeks. Tumor volumes were calculated weekly (n = 6 mice/group; two-way ANOVA with Tukey’s multiple comparisons test; data are presented as mean ± SD). j, k The levels of PTGS2 mRNA in tumor (j) and serum HMGB1 (k) at day 14 after treatment were assayed (n = 6 mice/group; one-way ANOVA with Tukey’s multiple comparisons test; data were presented as mean ± SD).
Fig. 7
Fig. 7. A model illustrating the function of EIF4E and ALDH1B1 in regulating 4HNE-mediated ferroptosis.
EIF4E promotes ferroptosis by directly blocking ALDH1B1, thereby promoting the accumulation of toxic 4HNE and subsequent NOX1-dependent lipid peroxidation.

References

    1. Dixon SJ, et al. Ferroptosis: an iron-dependent form of nonapoptotic cell death. Cell. 2012;149:1060–1072. doi: 10.1016/j.cell.2012.03.042. - DOI - PMC - PubMed
    1. Xie Y, et al. Ferroptosis: process and function. Cell Death Differ. 2016;23:369–379. doi: 10.1038/cdd.2015.158. - DOI - PMC - PubMed
    1. Stockwell BR, et al. Ferroptosis: a regulated cell death nexus linking metabolism, redox biology, and disease. Cell. 2017;171:273–285. doi: 10.1016/j.cell.2017.09.021. - DOI - PMC - PubMed
    1. Yang WS, et al. Peroxidation of polyunsaturated fatty acids by lipoxygenases drives ferroptosis. Proc. Natl Acad. Sci. USA. 2016;113:E4966–E4975. doi: 10.1073/pnas.1603244113. - DOI - PMC - PubMed
    1. Wenzel SE, et al. PEBP1 wardens ferroptosis by enabling lipoxygenase generation of lipid death signals. Cell. 2017;171:628–641 e626. doi: 10.1016/j.cell.2017.09.044. - DOI - PMC - PubMed

Publication types

MeSH terms