. 2022 Oct 23;20(1):456.
doi: 10.1186/s12951-022-01664-7.

Silver nano-reporter enables simple and ultrasensitive profiling of microRNAs on a nanoflower-like microelectrode array on glass

Affiliations

Silver nano-reporter enables simple and ultrasensitive profiling of microRNAs on a nanoflower-like microelectrode array on glass

Ying Gan et al. J Nanobiotechnology. .

Abstract

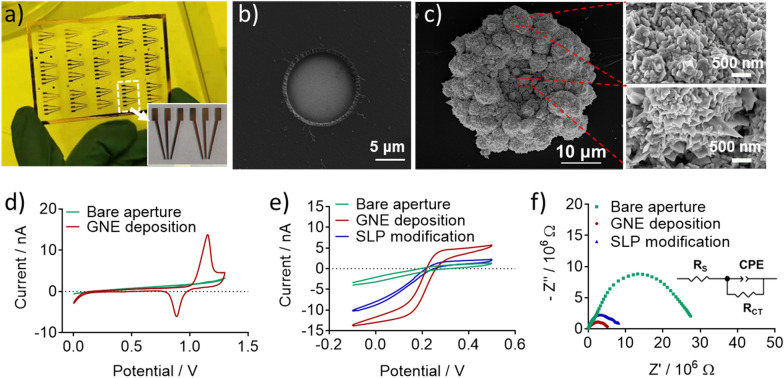
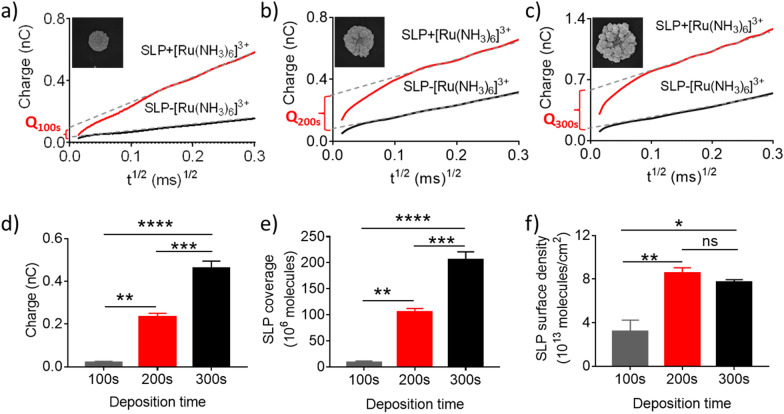
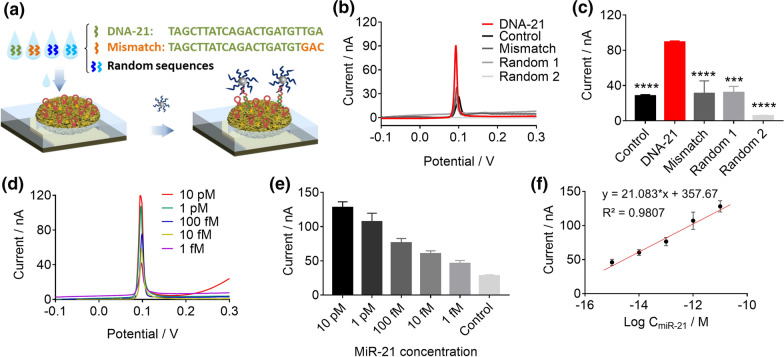
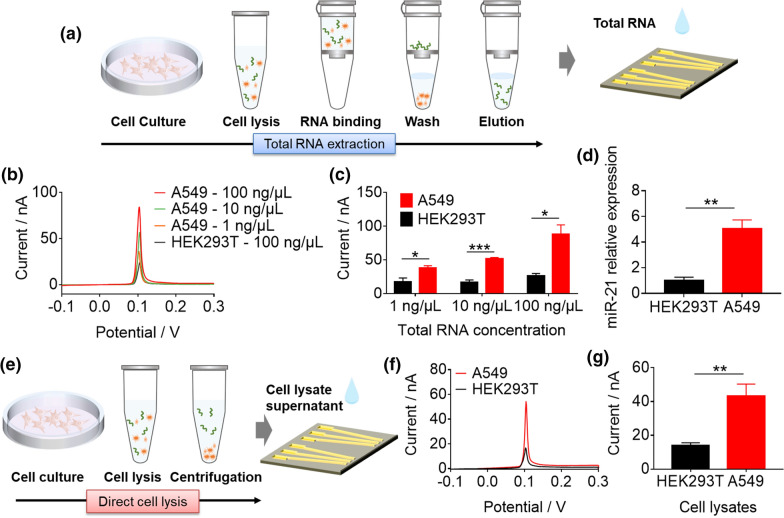
MicroRNAs (miRNAs) are small non-coding RNAs with ~ 22 nucleotides, playing important roles in the post-transcriptional regulation of gene expression. The expression profiles of many miRNAs are closely related to the occurrence and progression of cancer and can be used as biomarkers for cancer diagnosis and prognosis. However, their intrinsic properties, such as short length, low abundance and high sequence homology, represent great challenges in miRNA detection of clinical samples. To overcome these challenges, we developed a simple, ultrasensitive detection platform of electrochemical miRNAs chip (e-miRchip) with a novel signal amplification strategy using silver nanoparticle reporters (AgNRs) for multiplexed, direct, electronic profiling of miRNAs. A two-step hybridization strategy was used to detect miRNAs, where the target miRNA hybridizes with a stem-loop probe to unlock the probe first, and the opened stem-loop can further hybridize with AgNRs for signaling amplification. To enhance the detection sensitivity, the gold nanoflower electrodes (GNEs) were constructed in the microaperture arrays of the e-miRchips by electroplating. With the optimal size of the GNEs, the e-miRchip showed excellent performance for miR-21 detection with a detection limit of 0.56 fM and a linear range extended from 1 fM to 10 pM. The e-miRchip also exhibited good specificity in differentiating the 3-base mismatched sequences of the target miRNA. In addition, the e-miRchip was able to directly detect miR-21 expression in the total RNA extracts or cell lysates collected from lung cancer cells and normal cells. This work demonstrated the developed e-miRchip as an efficient and promising miniaturized point-of-care diagnostic device for the early diagnosis and prognosis of cancers.

Keywords: Electrochemical biosensor; Microarray; Nanostructured electrodes; Silver nanoparticle; microRNAs.


Conflict of interest statement

The authors declare that they have no competing interests.

Figures

Scheme 1
Scheme 1
Proposed e-miRchip platform for miRNA analysis. a The e-miRchip was fabricated with photolithography with the deposition and etching of the conductive gold and insulating parylene layers on glass to make the designed microaperture array. Electrodeposition of gold was performed to fabricate GNEs in the microaperture (i), and the GNEs were functionalized with SLP immobilization and 6-mercapto-1-hexanol (MCH) backfilling (ii). The miR-21 was captured by the SLPs (iii) and the signals were amplified with the AgNRs (iv). b Direct, ultrasensitive detection of miR-21 expression in lung cancer. The expression of miR-21 from the lung cancer cells is examined by direct electrochemical measurement on the e-miRchip
Fig. 1
Fig. 1
Characterization of e-miRchip and the GNE grown on the microaperture arrays. a Photograph of the microaperture array with 15 detection units (Inset: a zoom-in view of the detection unit in the white box labeled area). Each unit contained 6 apertures divided into 2 groups. b The SEM image of the bare microaperture. c SEM images of the GNE and the zoom-in high-resolution images of the red box labeled regions. d CV curves before and after GNE deposition (200 s) in 10 mM H2SO4 with the scan rate of 0.05 V/s. e CV curves of the e-miRchips with the bare aperture, GNE deposition and SLP immobilization on the GNE in 2 mM K3[Fe(CN)6] and 0.1 M KCl solution with the scan rate of 0.05 V/s. f EIS spectra of the e-miRchips in 2 mM K3[Fe(CN)6]/K4[Fe(CN)6] and 0.1 M KCl solution. Inset: Randle’s equivalent circuit, Rs: solution resistance, CPE: constant phase angle element, RCT: charge-transfer resistance
Fig. 2
Fig. 2
The performance of the synthesized AgNRs for miRNA sensing. a A schematic diagram of AgNRs (vs. the bare AgNPs) in reporting and amplifying the signals of the hybridization of miRNAs via the electrooxidation process. b A schematic diagram of AgNR synthesis. c UV–vis spectra and the representative photographs (inset) of the bare AgNPs and the AgNRs in 10 mM PBS. d The hydrodynamic diameter of the bare AgNPs and AgNRs by DLS measurement. The TEM images of the bare AgNPs (e) and AgNRs (f). g CV scans after AgNPs or AgNRs added on the e-miRchip. The control group represents the solvent for nano-reporters (10 mM PBS). h The comparison of the oxidation peak current obtained from (g). N ≥ 3 per group, ****p < 0.0001
Fig.3
Fig.3
The optimization of electroplating time to fabricate GNE for nucleic acid sensing. The SEM images of the top views (a) and side views (b) of GNEs with deposition time of 100 s, 200 s and 300 s (left to right). The comparison of diameter (c) and height (d) of GNEs with different deposition time based on the SEM images of a and b, respectively. e The changes of the “petals” to “bud” ratio of GNEs with the deposition time characterized by SEM imaging. f The CV scans of GNEs with different deposition time in 10 mM H2SO4 with a scan rate of 0.05 V/s. g The ECSAs calculated from CVs obtained in f. h The comparison of the detection performance of 1 pM DNA-21 among the three different sizes of GNEs. The control group was the hybridization buffer without DNA-21. (i) The S/N ratio calculated from h. N ≥ 3 per group, ns: not significant, *p < 0.05, **p < 0.01, ***p < 0.001, ****p < 0.0001
Fig.4
Fig.4
Characterization of the surface charge, SLP coverage and SLP surface density of the GNEs fabricated with different electroplating time. ac The chronocoulometry response curves and the SEM images (inset) of the SLP modified GNEs with deposition time of 100 s (a), 200 s (b), and 300 s (c). The calculated surface charges (d), SLP coverage (e), and the SLP density (f) of different GNEs based on the chronocoulometry curves from ac. N ≥ 3 per group, ns: not significant, *p < 0.05, **p < 0.01, ***p < 0.001, ****p < 0.0001
Fig. 5
Fig. 5
The specificity and sensitivity of e-miRchip in detecting miR-21. a A schematic diagram for verification of the specificity of e-miRchip by three non-complementary sequences (a 3-base mismatched sequence and two random sequences) in comparison with the complementary sequence (DNA-21). b CVs of the electrooxidation process of e-miRchip in sensing DNA-21, 3 bases mismatched DNA-21 (Mismatch) and two random sequences (Random 1 and Random 2); the concentration of all tested sequences was at 100 fM. c The oxidation peak current obtained from b. d CVs of the electrooxidation process of e-miRchip in the presence of miR-21 at various concentrations from 1 fM to 10 pM. e The oxidation peak current obtained from d. f The calibration curve obtained by plotting the electrooxidation peak current with miR-21 concentrations. N ≥ 3 per group, ***p < 0.001, ****p < 0.0001
Fig. 6
Fig. 6
The analysis of miR-21 expression levels by e-miRchip in the total RNA extracts and cell lysates from the A549 lung cancer cells and HEK-293 T cells. a The schematic diagram of the workflow for miR-21 detection in total RNA samples obtained from cultured cells. b Electrooxidation process of CVs and their peak currents c from analyzing the total RNAs of A549 cells at the concentrations of 1 ng/μL, 10 ng/μL and 100 ng/μL, and the total RNA (100 ng/μL) of HEK293T cells. d The miR-21 expression in A549 and HEK293T cells measured by RT-qPCR at the total RNA concentration of 2 ng/μL. e The schematic diagram of the workflow for the direct detection of miR-21 in cell lysates from A549 and HEK293T cells. f Electrooxidation process of CVs and their peak currents g for direct miR-21 detection in the cell lysates. N ≥ 3 per group, *p < 0.05, **p < 0.01, ***p < 0.001

References

    1. Huang AC, Postow MA, Orlowski RJ, Mick R, Bengsch B, Manne S, Xu W, Harmon S, Giles JR, Wenz B, Adamow M, Kuk D, Panageas KS, Carrera C, Wong P, Quagliarello F, Wubbenhorst B, D'Andrea K, Pauken KE, Herati RS, Staupe RP, Schenkel JM, McGettigan S, Kothari S, George SM, Vonderheide RH, Amaravadi RK, Karakousis GC, Schuchter LM, Xu X, Nathanson KL, Wolchok JD, Gangadhar TC, Wherry EJ. T-cell invigoration to tumour burden ratio associated with anti-PD-1 response. Nature. 2017;545(7652):60–65. - PMC - PubMed
    1. Siravegna G, Marsoni S, Siena S, Bardelli A. Integrating liquid biopsies into the management of cancer. Nat Rev Clin Oncol. 2017;14(9):531–548. - PubMed
    1. Ignatiadis M, Sledge GW, Jeffrey SS. Liquid biopsy enters the clinic—implementation issues and future challenges. Nat Rev Clin Oncol. 2021;18(5):297–312. - PubMed
    1. Cortez MA, Bueso-Ramos C, Ferdin J, Lopez-Berestein G, Sood AK, Calin GA. MicroRNAs in body fluids—the mix of hormones and biomarkers. Nat Rev Clin Oncol. 2011;8(8):467–477. - PMC - PubMed
    1. Ouyang TL, Liu ZY, Han ZY, Ge QY. MicroRNA detection specificity: recent advances and future perspective. Anal Chem. 2019;91(5):3179–3186. - PubMed

LinkOut - more resources