. 2022 Oct 23;10(1):149.
doi: 10.1186/s40478-022-01453-1.

High-resolution transcriptomics informs glial pathology in human temporal lobe epilepsy

Affiliations

High-resolution transcriptomics informs glial pathology in human temporal lobe epilepsy

Balagopal Pai et al. Acta Neuropathol Commun. .

Erratum in

Abstract

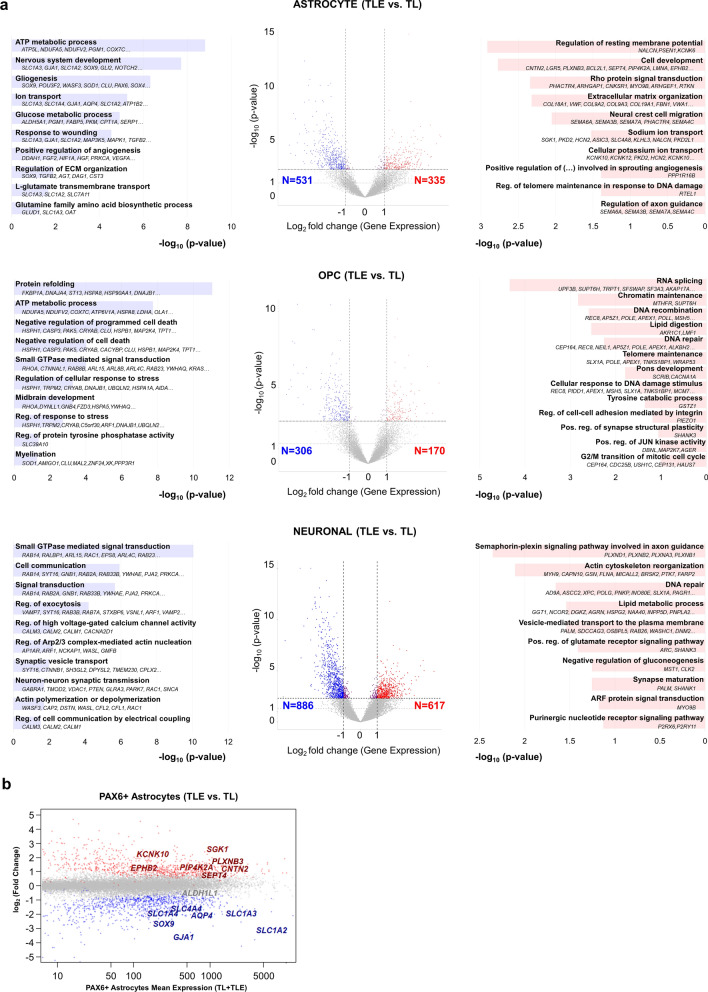
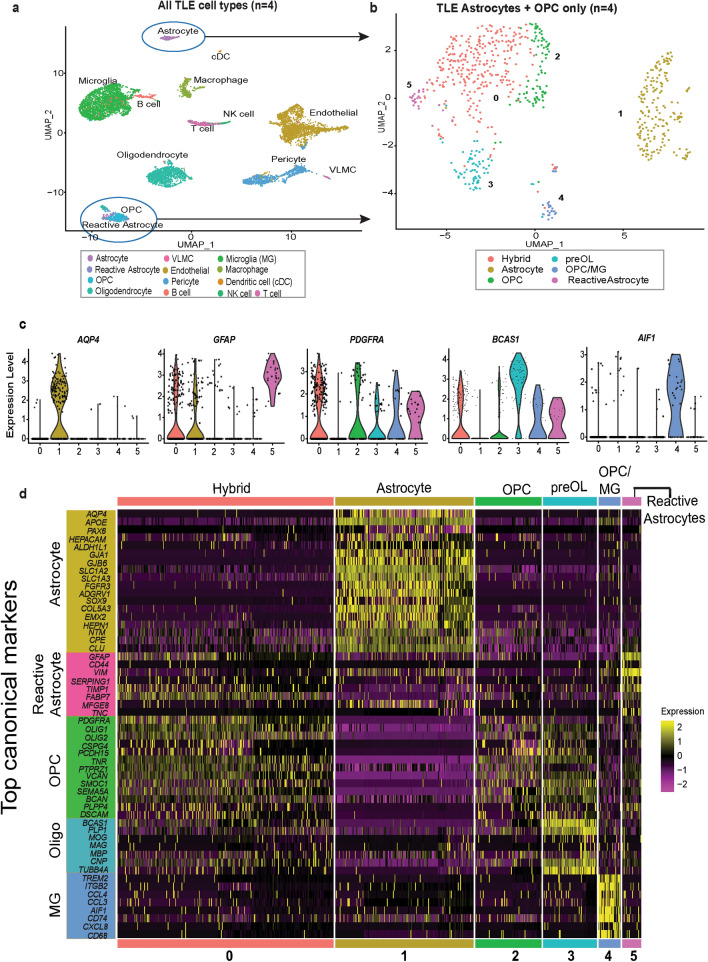
The pathophysiology of epilepsy underlies a complex network dysfunction between neurons and glia, the molecular cell type-specific contributions of which remain poorly defined in the human disease. In this study, we validated a method that simultaneously isolates neuronal (NEUN +), astrocyte (PAX6 + NEUN-), and oligodendroglial progenitor (OPC) (OLIG2 + NEUN-) enriched nuclei populations from non-diseased, fresh-frozen human neocortex and then applied it to characterize the distinct transcriptomes of such populations isolated from electrode-mapped temporal lobe epilepsy (TLE) surgical samples. Nuclear RNA-seq confirmed cell type specificity and informed both common and distinct pathways associated with TLE in astrocytes, OPCs, and neurons. Compared to postmortem control, the transcriptome of epilepsy astrocytes showed downregulation of mature astrocyte functions and upregulation of development-related genes. To gain further insight into glial heterogeneity in TLE, we performed single cell transcriptomics (scRNA-seq) on four additional human TLE samples. Analysis of the integrated TLE dataset uncovered a prominent subpopulation of glia that express a hybrid signature of both reactive astrocyte and OPC markers, including many cells with a mixed GFAP + OLIG2 + phenotype. A further integrated analysis of this TLE scRNA-seq dataset and a previously published normal human temporal lobe scRNA-seq dataset confirmed the unique presence of hybrid glia only in TLE. Pseudotime analysis revealed cell transition trajectories stemming from this hybrid population towards both OPCs and reactive astrocytes. Immunofluorescence studies in human TLE samples confirmed the rare presence of GFAP + OLIG2 + glia, including some cells with proliferative activity, and functional analysis of cells isolated directly from these samples disclosed abnormal neurosphere formation in vitro. Overall, cell type-specific isolation of glia from surgical epilepsy samples combined with transcriptomic analyses uncovered abnormal glial subpopulations with de-differentiated phenotype, motivating further studies into the dysfunctional role of reactive glia in temporal lobe epilepsy.


Conflict of interest statement

The authors declare that there is no conflict of interest regarding the publication of this article.

Figures

Fig. 1
Fig. 1
Simultaneous isolation of astrocyte, neuronal, and OPC-enriched nuclei from human temporal neocortex (a-b) Fluorescence-activated nuclei sorting (FANS) using anti-NEUN, anti-PAX6, and anti-OLIG2 antibodies simultaneously isolates three distinct nuclei populations from human postmortem control (TL) and epilepsy (TLE) temporal lobe neocortex: NEUN + , PAX6 + ( NEUN–), and OLIG2 + ( NEUN–), excluding the OLIG2LOW fraction. TN = triple negative (NEUN–PAX6–OLIG2–) population. See also Additional file 1: Fig. S1a. (c) Gene expression analysis by RT-qPCR confirms high expression of the genes used as markers for isolation and shows significantly enriched expression of the astrocytic markers GFAP and ALDH1L1 in PAX6 + ( NEUN–) nuclei and of the OPC markers CSPG4 (NG2) and PDGFRA in OLIG2 + ( NEUN–) nuclei (n = 4 TL control brains). Bars represent mean ± SEM. P-values calculated from one-tailed t-test compared to NEUN + population. PAX6 + vs. NEUN + : PAX6 p = 0.055; ALDH1L1 p = 0.067; GFAP p = 0.019. OLIG2 + vs. NEUN + : OLIG2 p = 0.0014; CSPG4 p = 0.012; PDGFRA p = 0.0008. (d) Quantification of expression of the myelinating oligodendrocyte marker PLP1 by RT-qPCR, showing its significantly higher expression in the OLIG2LOW gated nuclei population compared to all others. Bars represent mean ± SEM, (n = 3 TLE brains). *p < 0.05 one-tailed t-test. (e) Representative immunofluorescence images of PAX6, OLIG2, and NEUN expression in developing germinal matrix (left), adult postmortem TL neocortex (center) and adult TLE neocortex (right). In adult TL and TLE neocortex, PAX6 expression is seen in GFAP + astrocytes (arrows) and NEUN + neurons but is absent in OLIG2 + oligodendroglial cells (arrowheads). Scale bar = 50 µM. See also Additional file 1: Fig. S1e
Fig. 2
Fig. 2
Nuclear RNA-seq confirms cell type specificity in TL and TLE FANS-isolated populations. (a) RNA-seq principal component analysis reveals separation driven by sorted cell type. (b) Heatmap representations of nuclear gene expression (rld-normalized) RNA-seq data, derived from sorted PAX6 + , NEUN + , and OLIG2 + populations. Strong and selective enrichment of astrocytic, neuronal, and OPC markers is seen in each respective FANS population (normalized by row), with lack of contaminant microglial (M), endothelial (E), and pericyte / smooth muscle cell (P/SMC) gene expression in the sorted populations (normalized by column). (c) Gene set enrichment analyses (GSEA) confirm significant, cell type-specific enrichment. Rld-normalized nuclei RNA-seq data (PAX6 + , OLIG2 + , NEUN +) is analyzed against the top 500 overexpressed set of genes unique to resting human astrocytes [46] or to mouse OPCs [52]. For each gene set, each gene expression value is calculated relative to the average expression of all other populations and then sorted by highest relative expression
Fig. 3
Fig. 3
Dysregulated genes and biological processes in human temporal lobe epilepsy astrocyte, OPC and neuronal populations. (a) Differential expression analysis (TLE vs. TL) for each sorted cell type is represented by a volcano plot, depicting significantly upregulated (red) and downregulated (blue) genes in the epilepsy astrocyte, OPC, and neuronal populations. Functional enrichment analyses, performed using HOMER and DAVID (D) tools, depict top-enriched biological processes dysregulated in epilepsy, for each cell type (log2 fold change < -1 for downregulated and > 1 for upregulated, Benjamini–Hochberg adjusted p-value < 0.1). See Additional file 4: Table S3, Additional file 5: Table S4 for complete list. (b) MA plot shows the relative expression of genes differentially up- and down-regulated in PAX6 + epilepsy astrocytes, marked by red and blue dots, respectively
Fig. 4
Fig. 4
Single-cell transcriptomics of human temporal lobe epilepsy reveals mixed lineage glial subpopulations. (a) Uniform Manifold Approximation and Projection (UMAP) plot for integrated TLE samples from four different patients (14431, 13059, 19619, and 20188; see Table1). Clusters are colored by annotated cell types and indicated by labels. See also Additional file 7: Fig. S2a. (b) UMAP plot of subclustered astrocyte and OPC subpopulations from (a) after reclustering. Glial subpopulations cluster in six distinct clusters (0–5), colored by cluster ID. (c) Violin plots of log-normalized gene expression for canonical cell type-specific glial markers across the six subclusters identified in (b): AQP4 (Astrocyte), GFAP (Reactive astrocyte), PDGFRA (OPC), BCAS1 (premyelinating oligodendrocyte) and AIF1 (Microglia). Hybrid cluster 0 shows elevated expression of both PDGFRA and GFAP. (d) Heatmap of log-normalized and z-scored gene expression data from the subclustered TLE glia object, plotting canonical cell-type lineage markers for Astrocytes, Reactive astrocytes, OPC, Oligodendrocytes (Oligo), and microglia (MG) across glial subclusters 0–5, highlighting dual OPC/reactive astrocyte signatures in hybrid cluster 0. See also Additional file 7: Fig. S2b (same analysis plotting top 10 differentially expressed genes per cluster)
Fig. 5
Fig. 5
Comparison of normal and epilepsy temporal lobe scRNA-seq datasets confirms aberrant glial phenotypes. (a) UMAP representation of TLE data from Fig. 4a integrated with normal TL single-cell RNAseq data from Darmanis et al., PNAS 2015 [39]. Normal TL is denoted in red and TLE in gray. (b-d) Violin plots (top) and scaled gradient feature plots (bottom) representing projections of normal “TL astrocyte” (b), normal “TL OPC” (c) and normal “TL microglia'' (d) signature scores onto the diseased TLE astrocyte and OPC subclustered dataset in Fig. 4b, depicting abnormal enrichment of OPC-like signatures in TLE hybrid glia and reactive astrocytes (* = p-adj. < 0.05; ** = p-adj. < 0.005; *** = p-adj. < 0.0005 using Wilcoxon rank test, with Benjamini Hochberg correction for multiple hypothesis testing). (e) UMAP representation of Monocle3 pseudotime lineage trajectory analysis of TLE subclustered glia shown with astrocyte as the root cluster, depicting greater pseudotime similarity between OPCs, hybrid glia, and reactive astrocytes compared to astrocytes. See also Additional file 10: Fig. S4
Fig. 6
Fig. 6
Glial proliferation in human temporal lobe epilepsy. (a-b) Representative immunofluorescence images from the subset of TLE samples with high proliferation, as assessed by Ki67 labeling. A large portion of Ki67-positive cells co-express the microglial marker IBA1 (arrows), although Ki67 + IBA1 cells are not uncommonly seen as well (arrowheads) (a). Representative immunofluorescence images of GFAP, OLIG2 and Ki67 co-expression in TLE tissue (b). (c) Quantification of cell type-specific contribution to proliferation in the subset of TLE samples with high proliferation index, assessed by co-expression of Ki67 with OLIG2 and/or GFAP. Ki67 + cells were examined within the entire TLE tissue section, 14–58 40X fields overall. (d) Violin plot of log-normalized EGFR expression across the six TLE glial subpopulations from Fig. 4b. (e) FACS plots showing isolation strategy to purify EGFR + (CD34–CD45–) cells from fresh TLE tissue. A small but distinct population of EGFR + (DAPI–CD34–CD45–) cells are isolated, and subjected to primary cell culture along with EGFR– cells. FACS excludes dead cells (DAPI +), endothelial (CD34 +) and inflammatory (CD45 +) cells from the culture analysis. Numbers in boxes indicate % from total DAPI– cells. (f) EGFR + cells form proliferative clusters in vitro, significantly more compared to their EGFR– counterpart, when grown under low-adherence neural stem cell condition medium (n = 5 TLE samples, 10cells/µl (2000 cells/well); 1–3 wells per sample, week 2). Box-plots represent median, minimum and maximum value. P-value calculated using one-tailed U-Mann Whitney non-parametric test. (g) Representative microscope images (10X) of proliferative clusters growing from TLE EGFR + cells. (h) Human TLE tissue immunofluorescence demonstrates occasional co-localization of the rare EGFR + cells with the proliferative marker Ki67. In (a–b) nuclei are counterstained with DAPI. Scale bar = 50 µM unless otherwise specified

References

    1. Bell GS, Sander JW: The epidemiology of epilepsy: the size of the problem. Seizure 2001, 10(4):306–314; quiz 315–306. - PubMed
    1. Bien CG, Kurthen M, Baron K, Lux S, Helmstaedter C, Schramm J, Elger CE. Long-term seizure outcome and antiepileptic drug treatment in surgically treated temporal lobe epilepsy patients: a controlled study. Epilepsia. 2001;42(11):1416–1421. - PubMed
    1. Mitchell JW, Seri S, Cavanna AE. Pharmacotherapeutic and Non-Pharmacological Options for Refractory and Difficult-to-Treat Seizures. Journal of central nervous system disease. 2012;4:105–115. - PMC - PubMed
    1. Legido A, Katsetos CD. Experimental studies in epilepsy: immunologic and inflammatory mechanisms. Seminars in pediatric neurology. 2014;21(3):197–206. - PubMed
    1. Noebels J. Pathway-driven discovery of epilepsy genes. Nat Neurosci. 2015;18(3):344–350. - PMC - PubMed

Publication types