. 2022 Oct 4;25(10):105274.
doi: 10.1016/j.isci.2022.105274. eCollection 2022 Oct 21.

Night vision restored in days after decades of congenital blindness

Affiliations

Night vision restored in days after decades of congenital blindness

Samuel G Jacobson et al. iScience. .

Abstract

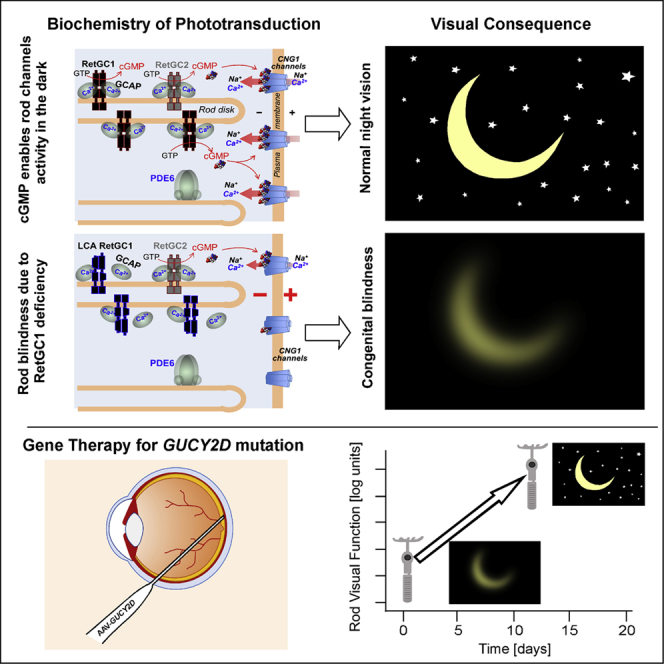
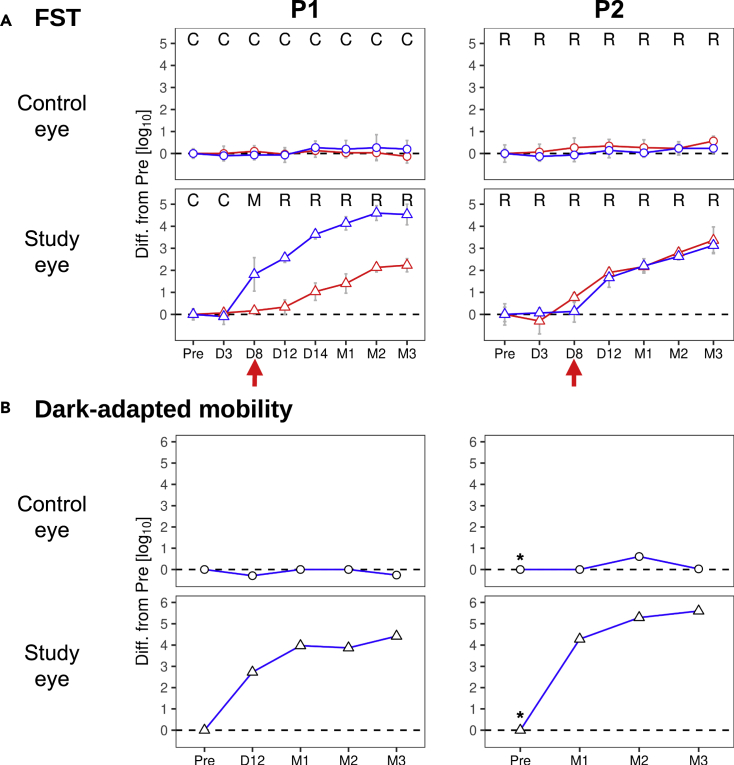
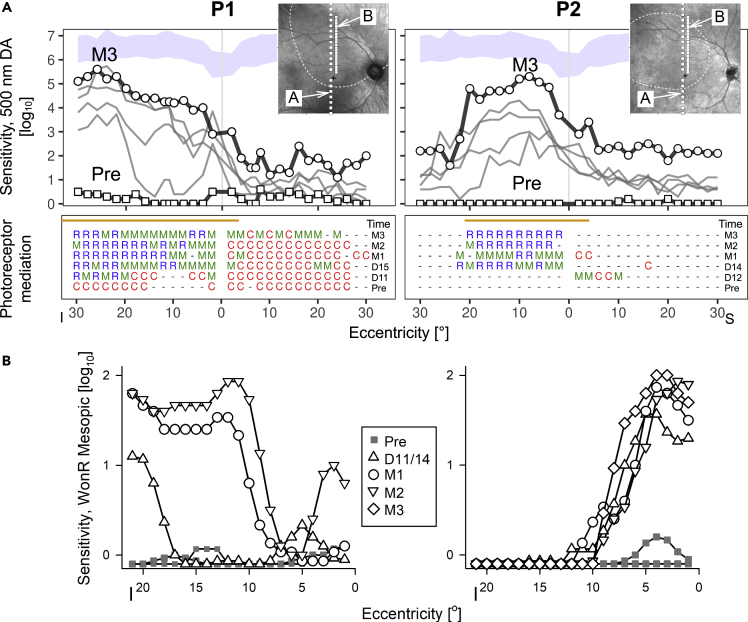
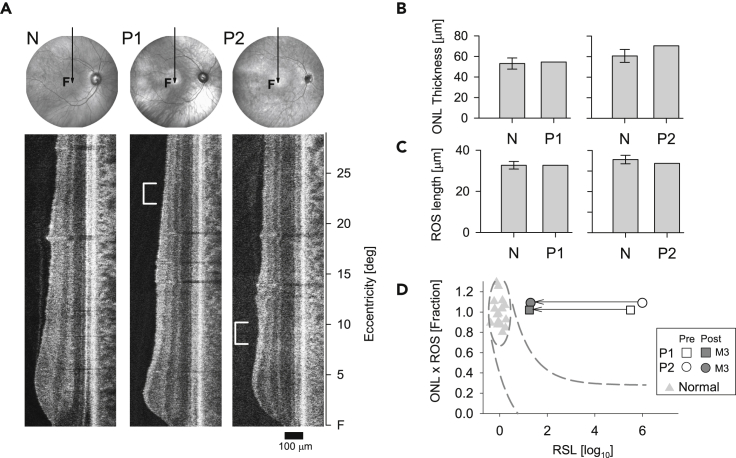
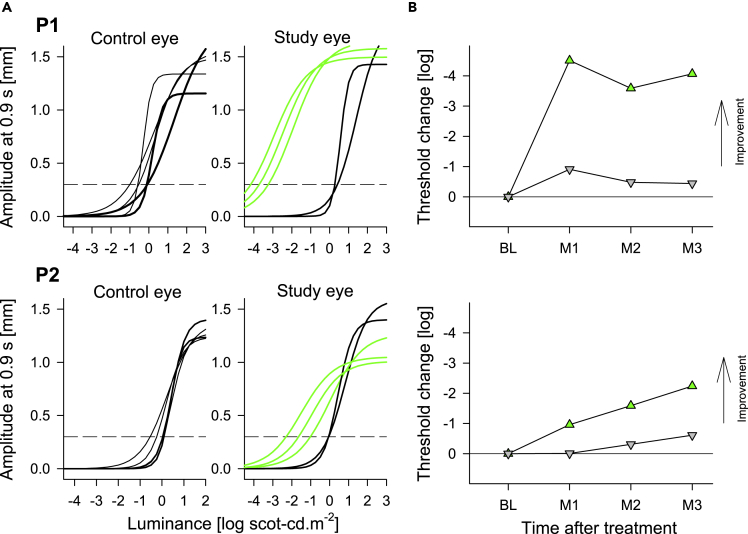
Signaling of vision to the brain starts with the retinal phototransduction cascade which converts visible light from the environment into chemical changes. Vision impairment results when mutations inactivate proteins of the phototransduction cascade. A severe monogenically inherited blindness, Leber congenital amaurosis (LCA), is caused by mutations in the GUCY2D gene, leading to a molecular defect in the production of cyclic GMP, the second messenger of phototransduction. We studied two patients with GUCY2D-LCA who were undergoing gene augmentation therapy. Both patients had large deficits in rod photoreceptor-based night vision before intervention. Within days of therapy, rod vision in both patients changed dramatically; improvements in visual function and functional vision in these hyper-responding patients reached more than 3 log10 units (1000-fold), nearing healthy rod vision. Quick activation of the complex molecular pathways from retinal photoreceptor to visual cortex and behavior is thus possible in patients even after being disabled and dormant for decades.

Keywords: Clinical genetics; Health sciences; Medicine.


Conflict of interest statement

S.E.B. and S.L.B. are scientific founders of and equity holders in Atsena Therapeutics, Inc. and are patent holders on the use of AAV-GUCY2D for the treatment of LCA1. C.N.K., D.Y., and K.P.F. are employees of Atsena Therapeutics, Inc. All other authors have no competing financial interests.

Figures

None
Graphical abstract
Figure 1
Figure 1
Time course of improvement in visual function and functional vision after treatment in two GUCY2D-LCA patients (A) FST sensitivity for blue and red stimuli (blue and red lines and symbols, respectively) measured at pre-treatment baseline (Pre) and at subsequent timepoints post-treatment. Top row, circles: control eye; bottom row, triangles: study eye. R, M, C: rod, cone or mixed (rod detecting blue and cone detecting red stimuli) photoreceptors, respectively, mediating perception. Vertical red arrows: earliest time with noticeable post-treatment rod sensitivity increase. Rod sensitivity increases (from Pre) at latest time point in the study eye were >4.6 log units (l.u.) for P1 and 3.1 l.u. for P2, respectively. Dashed line: no change level; error bars: ±2SD from multiple measurements, n ≥ 6. (B) Thresholds for successful performance of a mobility task measured before treatment (Pre) and post-treatment. When using the control eye both patients required luminances >5.5 l.u. above normal for successful navigation which did not change after treatment (circles). In contrast, when using the study eye (bottom row) P1 (left) showed functional increases after treatment of 2.7 l.u. to 4.4 l.u. (triangles) compared to Pre. The study eye of P2 (right) showed functional increases after treatment of 4.3 l.u. to 5.6 l.u. (triangles) compared to Pre. These increases brought the functional vision threshold for the study eye within 1 L.u of the normal median threshold. (∗), baseline of P2 imputed from value at M1 in the control eye.
Figure 2
Figure 2
Localizing the efficacy (A) Dark-adapted sensitivities to a 500 nm target across a vertical profile centered at the fovea, in study eyes pre- and post-treatment (days 11 to M3 for P1, and day 12 to M3 for P2). An increase in sensitivity co-located with the injection bleb (orange line shows extent along vertical median) is evident (top). Bottom, photoreceptor mediation (C, R, M for cone, rod and mixed rod/cone, respectively; dashes: mediation unable to be determined due to floor effect). The time sequence indicates the appearance of rod mediation after treatment. Squares, Pre; circles, latest visit; I, inferior; S, superior visual field. (B) Microperimetry measurements of sensitivity to white stimuli on a dim red mesopic background as a function of eccentricity in the inferior field. Loci where the brightest available stimulus was not seen are plotted below the 0 dB line. Insets, NIR reflectance images overlaid with the loci tested (white squares) with perimetry (A) and microperimetry (B), the location of the injection bleb (white dashed lines), and the anatomical fovea (black cross).
Figure 3
Figure 3
Retinal structure before treatment and structure-function relationship (A) Fundus images (near-infrared) and OCT scans along the vertical meridian through the fovea of a normal subject (N), and patients 1 and 2 (P1, P2) before treatment. Scan position depicted by the arrow on fundus images; F, fovea. White brackets to the left side of the patient scans delimit the location of the peak sensitivity gained after treatment (500 nm, DA, Figure 2A) at 22–24° superior retina for P1 and 8°–10° superior retina for P2. (B and C) Bar graphs are measurements of ONL (outer nuclear layer) thickness and ROS (rod outer segment) length at the location corresponding to post-treatment peak sensitivity (marked by brackets on the scans) and average normal value (N) at the same location (n = 13, error bar, SD). (D) The relationship between photoreceptor layer structure and rod sensitivity loss (RSL) at the marked location in P1 and P2. Open symbols are RSL before treatment and filled symbols (dark gray) after 3 months (M3) post-treatment in P1 and P2. The ellipse encircling normal data (gray triangles) describes normal variability. Dashed lines represent the idealized model of the relationship between structure and function.
Figure 4
Figure 4
Dark-adapted pupillary light reflexes in patients P1 and P2 at baseline and post-operative visits (A) Non-linear functions best fit to pupillary response amplitudes measured at 0.9 s after the start of 1 s long stimuli over a 6 log unit dynamic range of luminances presented to dark-adapted eyes. Thicker lines represent the pre-treatment time points, thinner black and green lines represent the post-treatment time points in untreated (control) and treated (study) eyes, respectively. Horizontal dashed lines demarcate criterion amplitude of 0.3 mm used to define response thresholds. (B) Change in response threshold from average pre-treatment values. Green up-triangles are treated study eyes; gray down-triangles are untreated control eyes. BL, baseline, M, month.
Figure 5
Figure 5
Biochemical consequences of GUCY2D-LCA missense mutations in patients P1 and P2 (A) In cyto co-localization of RetGC1 mutants with GCAP1. The cDNA coding for RetGC1 tagged with mOrange fluorescent protein (red) replacing a part of RetGC1 ECD are co-expressed in HEK293 cells with bovine GCAP1 harboring enhanced GFP tag at the C-terminus (green). The rightmost panel in each row presents typical distribution of the fluorescence intensities for the two fluorochromes across the cell (scanned along the dashed lines in the cells shown in the ‘merged’ images). Upper row, wild type RetGC1; middle row, Arg588Trp; bottom row, Trp708Arg. GCAP1GFP fluorescence co-localizes with wild type RetGC1 in the ER membranes, but it fails to co-localize with Arg588Trp or Trp708Arg RetGC1 and remains uniformly distributed throughout the cytoplasm and the nucleus. (B) Full-length wild type, Arg588Trp, and Trp708Arg RetGC1 expression in HEK293 cells was verified by Western immunoblotting. The HEK293 membrane samples containing wild type RetGC1 (n = 9 to 11 measurements), Arg588Trp (n = 3 to 4), and Trp708Arg (n = 5 to 8) were assayed for guanylyl cyclase activity (mean average ±SD) by incubating them for 30 min at 30°C in the presence (+) or in the absence (−) of 20 μM GCAP1, GCAP2, or GCAP3.

References

    1. Baehr W., Karan S., Maeda T., Luo D.G., Li S., Bronson J.D., Watt C.B., Yau K., Frederick J.M., Palczewski K. The function of guanylate cyclase 1 and guanylate cyclase 2 in rod and cone photoreceptors. J. Biol. Chem. 2007;282:8837–8847. doi: 10.1074/jbc.M610369200. - DOI - PMC - PubMed
    1. Bouzia Z., Georgiou M., Hull S., Robson A.G., Fujinami K., Rotsos T., Pontikos N., Arno G., Webster A.R., Hardcastle A.J., et al. GUCY2D-associated Leber congenital amaurosis: a retrospective natural history study in preparation for trials of novel therapies. Am. J. Ophthalmol. 2020;210:59–70. doi: 10.1016/j.ajo.2019.10.019. - DOI - PMC - PubMed
    1. Boye S.E., Boye S.L., Pang J., Ryals R., Everhart D., Umino Y., Neeley A.W., Besharse J., Barlow R., Hauswirth W.W. Functional and behavioral restoration of vision by gene therapy in the guanylate cyclase-1 (GC1) knockout mouse. PLoS One. 2010;5:e11306. doi: 10.1371/journal.pone.0011306. - DOI - PMC - PubMed
    1. Boye S.L., Conlon T., Erger K., Ryals R., Neeley A., Cossette T., Pang J., Dyka F.M., Hauswirth W.W., Boye S.E. Long-term preservation of cone photoreceptors and restoration of cone function by gene therapy in the guanylate cyclase-1 knockout (GC1KO) mouse. Invest. Ophthalmol. Vis. Sci. 2011;52:7098–7108. doi: 10.1167/iovs.11-7867. - DOI - PMC - PubMed
    1. Boye S.L., Peshenko I.V., Huang W.C., Min S.H., McDoom I., Kay C.N., Liu X., Dyka F.M., Foster T.C., Umino Y., et al. AAV-mediated gene therapy in the guanylate cyclase (RetGC1/RetGC2) double knockout mouse model of Leber congenital amaurosis. Hum. Gene Ther. 2013;24:189–202. doi: 10.1089/hum.2012.193. - DOI - PMC - PubMed