. 2022 Sep 30;25(10):105207.
doi: 10.1016/j.isci.2022.105207. eCollection 2022 Oct 21.

Weighted cue integration for straight-line orientation

Affiliations

Weighted cue integration for straight-line orientation

Shahrzad Shaverdian et al. iScience. .

Erratum in

Abstract

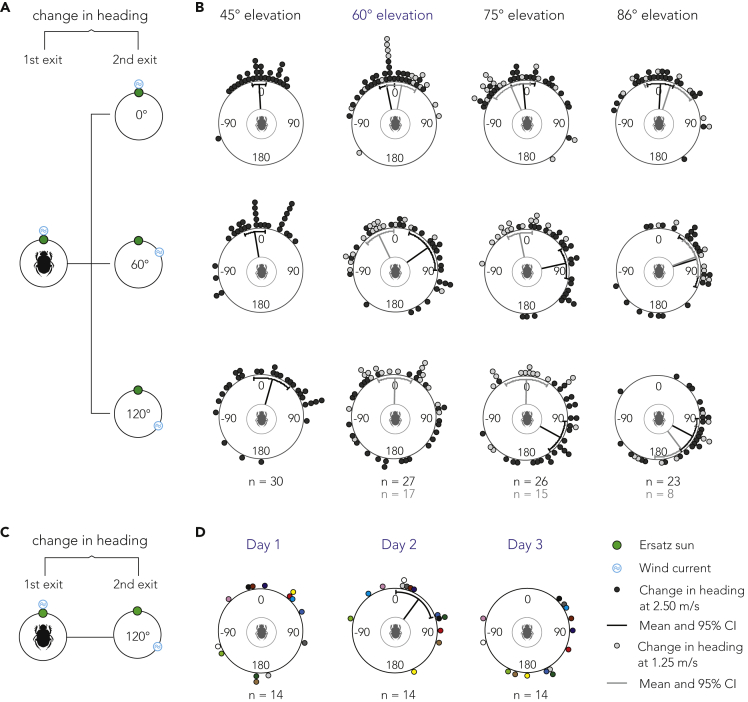
Animals commonly integrate multiple sources of information to guide their behavior. Among insects, previous studies have suggested that the relative reliability of cues affects their weighting in behavior, but have not systematically explored how well alternative integration strategies can account for the observed directional choices. Here, we characterize the directional reliability of an ersatz sun at different elevations and wind at different speeds as guiding cues for a species of ball-rolling dung beetle. The relative reliability is then shown to determine which cue dominates when the cues are put in conflict. We further show through modeling that the results are best explained by continuous integration of the cues as a vector-sum (rather than switching between them) but with non-optimal weighting and small individual biases. The neural circuitry in the insect central complex appears to provide an ideal substrate for this type of vector-sum-based integration mechanism.

Keywords: Biological sciences; Ethology; Zoology.


Conflict of interest statement

The authors declare no competing interests.

Figures

None
Graphical abstract
Figure 1
Figure 1
Mean menotactic orientation precision at each elevation and wind speed. Error bars indicate standard error of the mean. The mean precision at 60 and 75 elevation is highlighted to allow comparison to the wind (dashed lines). The mean precision at 60 is close to that at 2.5 m/s wind speed, and similarly the mean precision at 75 is less than that at 2.5 m/s wind speed but much greater than would be expected at 1.25 m/s. This relationship matches our cue conflict results. The line fits are those used in Equation 2, excluding the additive constants (which are only required for the κ estimation stage, see STAR Methods, Simulated cue representation). Circular insets illustrate ten paths traveled by a highly directed (left, R-value = 0.91) and a weakly directed (right, R-value = 0.21) beetle.
Figure 2
Figure 2
Behavioral results from a cue conflict experiment (A) Schematic procedure of the cue conflict experiment. Change in heading was calculated for individual beetles between two consecutive exits; initial condition (1st exit where the initial bearing is established) to conflict condition (2nd exit where the wind had changed direction by 0°, 60°, or 120° relative to the ersatz sun). (B) The changes in headings at wind speed 2.5 m/s are illustrated as black circles and at 1.25 m/s as gray circles. Lines extending from the centers indicate mean vectors, black lines for 2.5 m/s and gray lines for 1.25 m/s, and end in a 95% confidence interval of the spread. (C) Schematic procedure of the experiment where a 2.5 m/s wind cue was subjected to a 120° azimuthal shift in the presence of a sun cue at 60° elevation. (D) The changes in headings at three different days. Each colored data point illustrates the change in heading of the same individual across days.
Figure 3
Figure 3
An illustration of the different model outcomes for two sets of input samples Top row: The two sample distributions used as input to the models. Each cue is described by a noise distribution which is sampled to generate behavior. The noise distributions are von Mises with κBlue=2.05, κGreen=2, μGreen=0, and μBlue{0,60,120} (columns). Weights are computed from κs. BVS (Biased Vector Sum): Noise is added to the weights (vector magnitudes) which are then passed through an adjustment function. This strategy can generate different outputs for the same inputs due to the added noise. NVS (Non-optimal Vector Sum): Weights are adjusted and then the vectors are summed. WVS (Weighted Vector Sum): Angular samples are converted to vectors and then summed. WTA (Winner-take-all): Weights are compared and the cue with the greatest weight wins complete influence. WAM (Weighted Arithmetic Mean): A simple weighted average of the angles. For model definitions, please see STAR Methods, Integration models.

References

    1. Alais D., Burr D. The ventriloquist effect results from near-optimal bimodal integration. Curr. Biol. 2004;14:257–262. doi: 10.1016/j.cub.2004.01.029. - DOI - PubMed
    1. Baird E., Byrne M.J., Scholtz C.H., Warrant E.J., Dacke M. Bearing selection in ball-rolling dung beetles: is it constant? J. Comp. Physiol. A Neuroethol. Sens. Neural. Behav. Physiol. 2010;196:801–806. doi: 10.1007/s00359-010-0559-8. - DOI - PubMed
    1. Baird E., Byrne M.J., Smolka J., Warrant E.J., Dacke M. The dung beetle dance: an orientation behaviour? PLoS One. 2012;7:e30211. doi: 10.1371/journal.pone.0030211. - DOI - PMC - PubMed
    1. Batschelet E. Academic Press Inc.; 1981. Circular Statistics in Biology.
    1. Byrne M., Dacke M., Nordström P., Scholtz C., Warrant E. Visual cues used by ball-rolling dung beetles for orientation. J. Comp. Physiol. A Neuroethol. Sens. Neural Behav. Physiol. 2003;189:411–418. doi: 10.1007/s00359-003-0415-1. - DOI - PubMed

LinkOut - more resources