. 2022 Oct 7:12:1010853.
doi: 10.3389/fcimb.2022.1010853. eCollection 2022.

The oral-gut axis: Salivary and fecal microbiome dysbiosis in patients with inflammatory bowel disease

Affiliations

The oral-gut axis: Salivary and fecal microbiome dysbiosis in patients with inflammatory bowel disease

Mohamed M H Abdelbary et al. Front Cell Infect Microbiol. .

Abstract

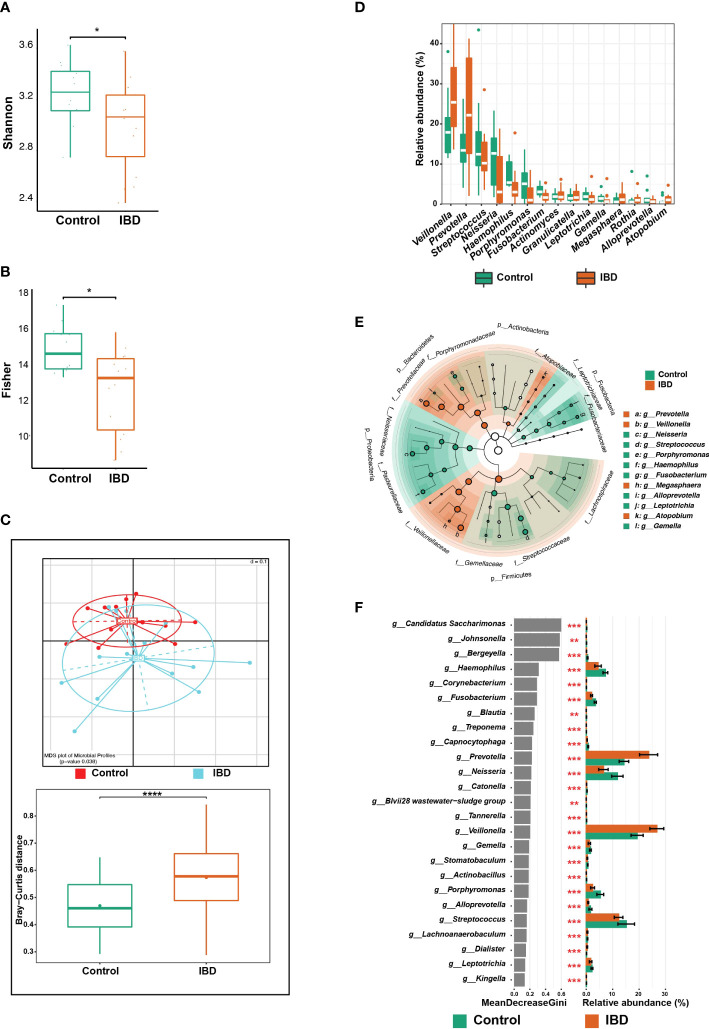
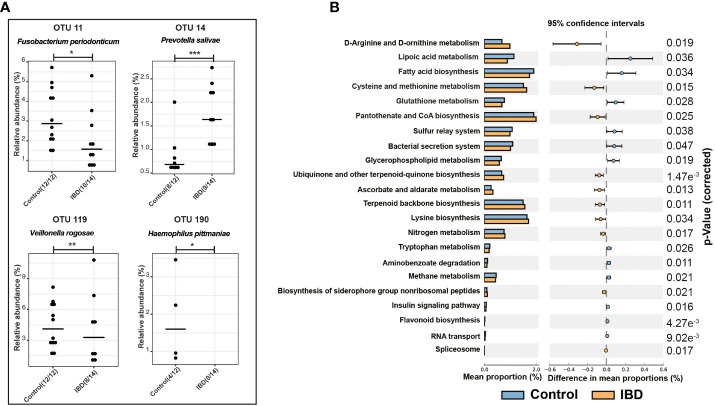
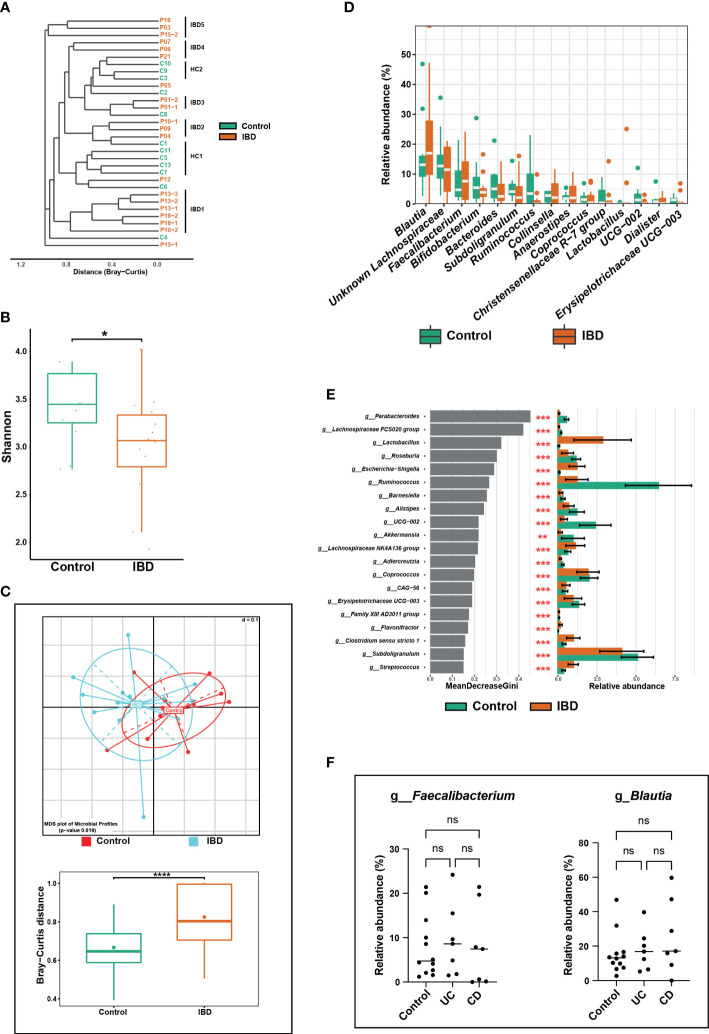
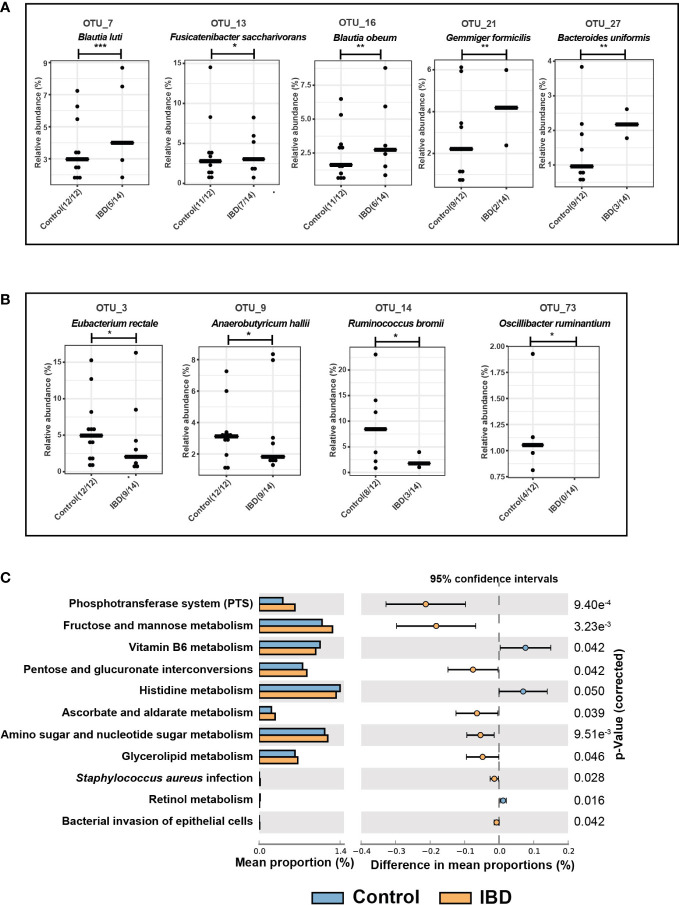
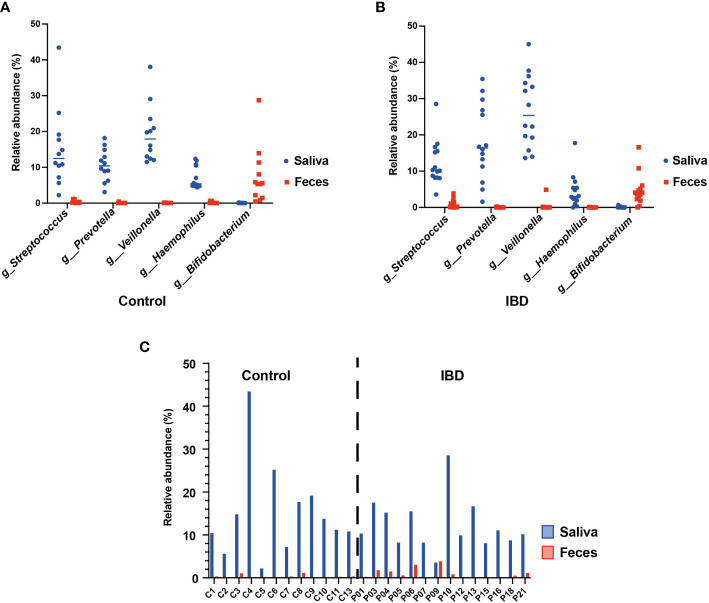
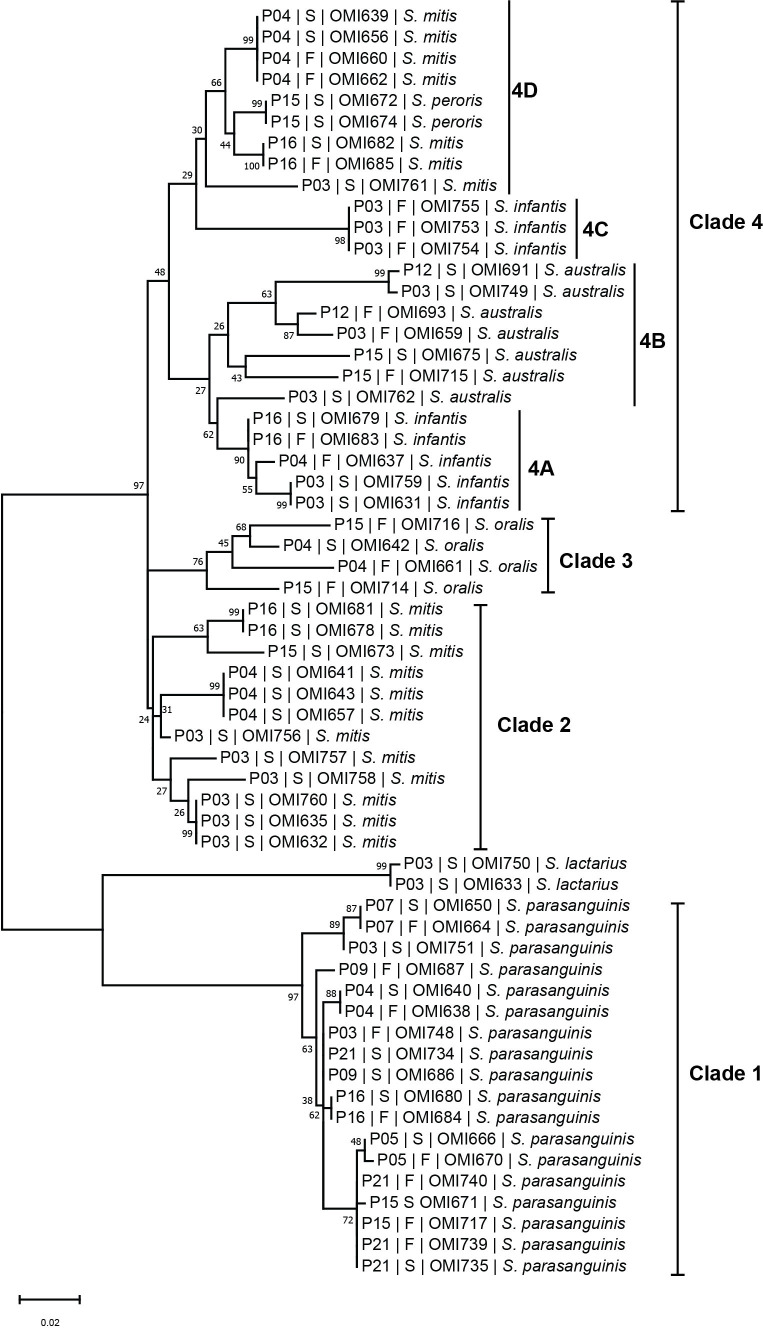
Inflammatory bowel disease (IBD) is a group of chronic inflammatory disorders that fall into two main categories: Crohn's disease (CD) and ulcerative colitis (UC). The gastrointestinal tract extends from the mouth to the anus and harbors diverse bacterial communities. Several sequencing-based studies have identified an intestinal enrichment of oral-associated bacteria and demonstrated their ability to induce intestinal inflammation in mice, suggesting that intestinal pathobionts originate from the oral cavity, particularly members of the genus Streptococcus. This study aimed to investigate the composition of the salivary and fecal microbiome of IBD patients (n = 14) compared to healthy controls (n = 12) and to determine the abundance of common bacterial taxa in both niches. Metagenomic DNA was extracted from saliva and fecal samples, and the 16S rRNA gene was targeted for sequencing. Our results revealed that the overall microbial composition of saliva was significantly altered in the IBD patients compared to the control subjects (p = 0.038). At the genus level, Veillonella and Prevotella were highly abundant in IBD (median: 25.4% and 22.2%, respectively) compared to the control group (17.9% and 13.4%, respectively). In contrast, Neisseria, Streptococcus, Haemophilus, and Fusobacterium were associated with a healthy gut state. Regarding the fecal microbiome, the IBD group had a significantly higher abundance of Clostridium sensu stricto 1 and Escherichia-Shigella (both comprising pathogenic bacteria) compared with the control group. Members of both bacterial groups have previously been shown to positively correlate with intestinal inflammation and high expression of pro-inflammatory cytokines that disrupt intestinal barrier integrity. In addition, we demonstrate that the increased abundance of Clostridium sensu stricto 1 and Escherichia-Shigella has also been associated with significant upregulation of certain metabolic pathways in the feces of the IBD group, including bacterial invasion of epithelial cells. Streptococcus was the only common genus detected in both the salivary and fecal microbiome and represented the oral-gut axis in our study. Using culture-based methods, we isolated 57 and 91 Streptococcus strains from saliva as well as 40 and 31 strains from fecal samples of the controls and IBD patients, respectively. The phylogenetic tree of streptococci based on sodA sequences revealed several patient-specific clusters comprising salivary and fecal streptococcal isolates from the same patient and belonging to the same species, suggesting that the oral cavity is an endogenous reservoir for intestinal strains.

Keywords: Prevotella spp.; Streptococcus spp.; Veillonella spp.; fecal microbiome; inflammatory bowel disease; oral-gut axis; salivary microbiome.


Conflict of interest statement

The authors declare that the research was conducted in the absence of any commercial or financial relationships that could be construed as a potential conflict of interest.

Figures

Figure 1
Figure 1
Changes in the salivary microbiome of IBD patients compared to healthy controls. (A) Boxplots show alpha diversity analysis performed on 15 saliva samples from 14 IBD patients (including one additional sample from P01) and 12 from 12 control subjects. (B) Boxplots showing the significance of Fisher’s test comparing the alpha diversity of the two groups without the additional sample from P01. (C) Beta diversity analysis represented by multidimensional scaling (MDS) and pairwise Bray-Curtis distances (boxplots). (D) Boxplots showing differentially abundant genera. (E) LEfSe cladogram demonstrating the phylogenetic relationship among genera that were enriched in both groups, where the dot size represents the mean abundance of the genus. (F) The top 25 significant genera were identified using random forest models, ranked by the index of accuracy and Gini. The symbols (*), (**), (***), and (****) indicate the significance values of P < 0.05, P < 0.01, P < 0.001, and P < 0.0001, respectively.
Figure 2
Figure 2
Differential OTUs abundances and metabolic functions of the salivary microbiome. (A) Significantly abundant OTUs that were increased in the salivary microbiome of IBD patients and healthy controls and their representative species according to BLAST analysis. (B) PICRUSt analysis showing KEGG pathways significantly enriched in the salivary microbiome of IBD and healthy controls. The symbols (*), (**), and (***) indicate the significance values of P < 0.05, P < 0.01, and P < 0.001, respectively.
Figure 3
Figure 3
Alterations in the fecal microbiome of IBD patients compared to healthy controls. (A) Phylogenetic tree based on the microbiome distance between IBD patients and control subjects showing different clusters. (B) Shannon index representing alpha diversity of IBD (n = 14) and control subjects (n = 12). (C) Beta diversity analysis represented by multidimensional scaling (MDS) and pairwise Bray-Curtis distances (boxplots) between both groups. (D) Boxplots showing differentially abundant genera. (E) The top 20 significant genera were identified using random forest models, ranked by the index of accuracy and Gini. (F) Comparison of relative abundance of the genera Faecalibacterium and Blautia between control, ulcerative colitis (UC), and Crohn’s disease (CD) groups. The symbols (ns), (*), (**), and (***) indicate the significance values of P > 0.05 (not significant), P < 0.05, P < 0.01, and P < 0.001, respectively.
Figure 4
Figure 4
Differential OTUs abundances and metabolic functions of the fecal microbiome. (A) Significantly increased OTUs in the fecal microbiome of IBD patients and their representative species according to BLAST analysis. (B) Significantly increased OTUs in the fecal microbiome of healthy controls and their assigned species. (C) PICRUSt analysis showing KEGG pathways significantly enriched in the fecal microbiome of IBD and healthy controls. The symbols (*), (**), and (***) indicate the significance values of P < 0.05, P < 0.01, and P < 0.001, respectively.
Figure 5
Figure 5
The oral-gut axis: core oral taxa (Streptococcus, Prevotella, Veillonella, Haemophilus, and Bifidobacterium) detected in the 16S rRNA sequences of the salivary and fecal microbiome. (A) comparison between the salivary and fecal microbiome of healthy controls. (B) comparison between the salivary and fecal microbiome of IBD patients. (C) Individual comparison between the relative abundance of Streptococcus from the salivary and fecal microbiome of healthy controls and IBD patients.
Figure 6
Figure 6
The streptococcal sodA sequence-based phylogenetic tree. Mid-rooted maximum likelihood phylogenetic tree based on sodA gene sequences of 60 streptococcal strains isolated from saliva (“S”) and fecal (“F”) samples of IBD patients (“P”).

References

    1. Al Nabhani Z., Dulauroy S., Lécuyer E., Polomack B., Campagne P., Berard M., et al. (2019). Excess calorie intake early in life increases susceptibility to colitis in adulthood. Nat. Metab. 1, 1101–1109. doi: 10.1038/s42255-019-0129-5 - DOI - PubMed
    1. Altschul S. F., Gish W., Miller W., Myers E. W., Lipman D. J. (1990). Basic local alignment search tool. J. Mol. Biol. 215, 403–410. doi: 10.1016/S0022-2836(05)80360-2 - DOI - PubMed
    1. Benjamini Y., Hochberg Y. (1995). Controlling the false discovery rate: A practical and powerful approach to multiple testing. J. R. Stat. Society: Ser. B (Methodological) 57, 289–300. doi: 10.1111/j.2517-6161.1995.tb02031.x - DOI
    1. Bourgonje A. R., Roo-Brand G., Lisotto P., Sadaghian Sadabad M., Reitsema R. D., de Goffau M. C., et al. (2022). Patients with inflammatory bowel disease show IgG immune responses towards specific intestinal bacterial genera. Front. Immunol. 13, 842911. doi: 10.3389/fimmu.2022.842911 - DOI - PMC - PubMed
    1. Brennan C. A., Garrett W. S. (2019). Fusobacterium nucleatum — symbiont, opportunist and oncobacterium. Nat. Rev. Microbiol. 17, 156–166. doi: 10.1038/s41579-018-0129-6 - DOI - PMC - PubMed

Publication types