Randomized Controlled Trial
. 2022 Oct 6:13:1008438.
doi: 10.3389/fimmu.2022.1008438. eCollection 2022.

Cytokine levels associated with favorable clinical outcome in the CAPSID randomized trial of convalescent plasma in patients with severe COVID-19

Affiliations
Randomized Controlled Trial

Cytokine levels associated with favorable clinical outcome in the CAPSID randomized trial of convalescent plasma in patients with severe COVID-19

Sixten Körper et al. Front Immunol. .

Abstract

Objectives: To determine the profile of cytokines in patients with severe COVID-19 who were enrolled in a trial of COVID-19 convalescent plasma (CCP).

Methods: Patients were randomized to receive standard treatment and 3 CCP units or standard treatment alone (CAPSID trial, ClinicalTrials.gov NCT04433910). The primary outcome was a dichotomous composite outcome (survival and no longer severe COVID-19 on day 21). Time to clinical improvement was a key secondary endpoint. The concentrations of 27 cytokines were measured (baseline, day 7). We analyzed the change and the correlation between serum cytokine levels over time in different subgroups and the prediction of outcome in receiver operating characteristics (ROC) analyses and in multivariate models.

Results: The majority of cytokines showed significant changes from baseline to day 7. Some were strongly correlated amongst each other (at baseline the cluster IL-1ß, IL-2, IL-6, IL-8, G-CSF, MIP-1α, the cluster PDGF-BB, RANTES or the cluster IL-4, IL-17, Eotaxin, bFGF, TNF-α). The correlation matrix substantially changed from baseline to day 7. The heatmaps of the absolute values of the correlation matrix indicated an association of CCP treatment and clinical outcome with the cytokine pattern. Low levels of IP-10, IFN-γ, MCP-1 and IL-1ß on day 0 were predictive of treatment success in a ROC analysis. In multivariate models, low levels of IL-1ß, IFN-γ and MCP-1 on day 0 were significantly associated with both treatment success and shorter time to clinical improvement. Low levels of IP-10, IL-1RA, IL-6, MCP-1 and IFN-γ on day 7 and high levels of IL-9, PDGF and RANTES on day 7 were predictive of treatment success in ROC analyses. Low levels of IP-10, MCP-1 and high levels of RANTES, on day 7 were associated with both treatment success and shorter time to clinical improvement in multivariate models.

Conclusion: This analysis demonstrates a considerable dynamic of cytokines over time, which is influenced by both treatment and clinical course of COVID-19. Levels of IL-1ß and MCP-1 at baseline and MCP-1, IP-10 and RANTES on day 7 were associated with a favorable outcome across several endpoints. These cytokines should be included in future trials for further evaluation as predictive factors.

Keywords: COVID-19; chemokines; convalescent plasma; interleukins; predictive factors; randomized trial.


Conflict of interest statement

The authors declare that the research was conducted in the absence of any commercial or financial relationships that could be construed as a potential conflict of interest.

Figures
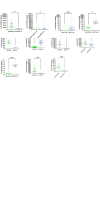
Figure 1
Figure 1
Dynamics of serum cytokine levels in the study cohort at baseline (day 0) and day 7 after randomization. Results are presented in pg/ml. Circles show individual measurements, the horizontal lines represent medians and IQR. Groups were compared by the Kruskal-Wallis-Test with Dunn´s post hoc test. *p<0.05, **p<0.01, ***p<0.001, ****p<0.0001, ns, not significant.
Figure 2
Figure 2
Heat map of the absolute values of the correlation matrix at baseline (day 0) (A) and on day 7 (B) of all patients. Clustered cytokines are indicated by the solid lines in the dendrograms and the clusters are indicated by the colors above and beside the graph. Non-clustered cytokines are shown by the dashed lines in the dendrogram. Clusters were formed by the unweighted group method. Cluster reports for the absolute values of the correlation matrix are presented in Table 2A .
Figure 3
Figure 3
Heat map of the absolute values of the correlation matrix on day 7 stratified by randomization group: control (A) and CCP (B). Clustered cytokines are indicated by the solid lines in the dendrograms and the clusters are indicated by the colors above and beside the graph. Non-clustered cytokines are shown by the dashed lines in the dendrogram. Clusters were formed by the unweighted group method. Cluster reports for the absolute values of the correlation matrix are presented in Table 2B .
Figure 4
Figure 4
Heat map of the absolute values of the correlation matrix on day 7 in an analysis including both control group and CCP group stratified by reaching the primary endpoint on day 21: failure (A) and success (B). Clustered cytokines are indicated by the solid lines in the dendrograms and the clusters are indicated by the colors above and beside the graph. Non-clustered cytokines are shown by the dashed lines in the dendrogram. Clusters were formed by the unweighted group method. Cluster reports for the absolute values of the correlation matrix are presented in Table 2B .
Figure 5
Figure 5
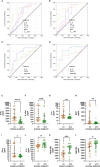
Receiver operating characteristics analysis of day 0 levels of IP-10, IFN-γ, IL-1ß and MCP-1 and primary endpoint (failure versus success on day 21). Low levels of these cytokines on day 0 indicate a positive condition, i.e. patients reached the primary endpoint.(A) All patients (irrespective of allocation to randomization group). Area under the curve (AUC) and p-values for AUC >0.5 were as follows: IP-10: AUC 0.74; p=0.0002; IFN-γ: AUC 0.67, p=0.013; MCP-1: AUC 0.64, p=0.03; IL-1ß: AUC 0.64, p=0.04).(B) Patients in the CCP group Area under the curve (AUC) and p-values for AUC >0.5 were as follows: IP-10: AUC 0.82; p<0.0001; IFN-γ: AUC 0.79, p=0.0002; MCP-1: AUC 0.76, p=0.002; IL-1ß: AUC 0.70, p=0.04). (C) Comparison of day 0 levels of IP-10, IFN-γ, MCP-1 and IL-1ß (from left to right) between patients not reaching the primary endpoint (brown symbols) or reaching the primary endpoint on day 21 (green symbols). Groups were compared by Mann-Whitney test. *p<0.05, **p<0.01, ***p<0.001, ****p<0.0001.
Figure 6
Figure 6
Receiver operating characteristics analysis of day 7 cytokine levels and primary endpoint (failure vs. success on day 21). (A) All patients (irrespective of allocation to randomization group). Low levels of IP-10, IL-1RA, MCP-1, IL-6 and IFN-γ on day 7 indicate treatment success. Area under the curve (AUC) and p-values for AUC >0.5 were as follows: IP-10: AUC 0.85; p<0.0001; IL-1RA: AUC 0.78, p<0.0001; IL-6: AUC 0.72, p=0.0012; MCP-1: AUC 0.71, p=0.0033; IFN-γ: AUC 0.70, p=0.0038). (B) Patients in the CCP group. Low levels of IP-10, IL-1RA, MCP-1 and IL-6 on day 7 indicate treatment success. AUC and p-values for AUC >0.5 were as follows: IP-10: AUC 0.82; p<0.0001; IL-1RA: AUC 0.89, p<0.0001; IL-6: AUC 0.71, p=0.0345; MCP-1: AUC 0.70, p=0.0499; IFN-γ: AUC 0.69, p=0.0516). (C) All patients (irrespective of allocation to randomization group). High levels of PDGF-BB, RANTES and IL-9 on day 7 indicate treatment success. AUC and p-values for AUC >0.5 were as follows: PDGF-BB: AUC 0.78; p<0.0001; RANTES: AUC 0.68, p=0.0080; IL-9: AUC 0.65, p=0.0260). (D) Patients in the CCP group. High levels of PDGF-BB, RANTES and IL-9 on day 7 indicate treatment success. AUC and p-values for AUC >0.5 were as follows: PDGF-BB: AUC 0.84; p<0.0001; RANTES: AUC 0.77, p=0.0012; IL-9: AUC 0.69, p=0.0279). (E-L) Bivariate comparison of day 7 levels of IP-10, IL-1RA, IL-6, MCP-1, IFN-γ, IL-9, PDGF-BB and RANTES between the patients not reaching the primary endpoint (brown symbols) or reaching the primary endpoint on day 21 (green symbols). Groups were compared by Mann-Whitney test. *p<0.05, **p<0.01, ***p<0.001, ****p<0.0001. ns, not significant.
Figure 7
Figure 7
Multivariate analyses of primary endpoint (survival and no longer meeting criteria for severe COVID-19 on day 21) including cytokine levels on day 0. The following variable were included in the model: Treatment group (control group, high titer plasma, low titer plasma), age (as continuous variable), gender (female (f)) and male (m), baseline WHO Severity Score (≤4 vs. > 4) (11) and the level of the respective cytokine on day 0 (≤ median (“low”) versus > median (“high”)). One cytokine each was included in the models: IL-1ß (A), IFN-γ (B), MCP-1 (C) or IP-10 (D).
Figure 8
Figure 8
Multivariate analyses of primary endpoint (survival and no longer meeting criteria for severe COVID-19 on day 21) including cytokine levels on day 7. The following variable were included in the model: Treatment group (control group, high titer plasma, low titer plasma), age (as continuous variable), gender, baseline WHO Severity Score (≤4 vs. > 4) (11) and the level of the respective cytokine on day 7 (≤ median (“low”) versus > median (“high”)). One cytokine each was included in the models: IL-1RA (A), IFN-γ (B), MCP-1 (C), IP-10 (D), IL-6 (E), RANTES (F), PDGF-BB (G) or IL-9 (H).
Figure 9
Figure 9
Multivariate analyses of the key secondary endpoint time to clinical improvement (≤ median vs. > median) including cytokine levels on day 7. The following variables were included in the model: Treatment group (control group, high titer plasma, low titer plasma), age (as continuous variable), gender, baseline WHO Severity Score (≤4 vs. > 4) (11) and the level of the respective cytokine on day 7 (≤ median (“low”) versus > median (“high”)). One cytokine each was included in the models: IL-1RA (A), IFN-γ (B), MCP-1 (C), IP-10 (D), IL-6 (E), RANTES (F), PDGF-BB (panel G) or IL-9 (panel H).
Figure 10
Figure 10
Multivariate analyses of the key secondary endpoint time to clinical improvement (≤ median vs. > median) including cytokine levels on day 0. The following variable were included in the model: Treatment group (control group, high titer plasma, low titer plasma), age (as continuous variable), gender, baseline WHO Severity Score (≤4 vs. > 4) (11) and the level of the respective cytokine on day 0 (≤ median (“low”) versus > median (“high”)). One cytokine each was included in the models: IL-1ß (A), IFN-γ (B), MCP-1 (C) or IP-10 (D).

References

    1. Ashrafzadeh-Kian S, Campbell MR, Jara Aguirre JC, Walsh J, Kumanovics A, Jenkinson G, et al. . Role of immune mediators in predicting hospitalization of SARS-CoV-2 positive patients. Cytokine (2022) 150:155790. doi: 10.1016/j.cyto.2021.155790 - DOI - PMC - PubMed
    1. Bandopadhyay P, D'Rozario R, Lahiri A, Sarif J, Ray Y, Paul SR, et al. . Nature and dimensions of systemic hyperinflammation and its attenuation by convalescent plasma in severe COVID-19. J Infect Dis (2021) 224:565–74. doi: 10.1093/infdis/jiab010 - DOI - PMC - PubMed
    1. Guo Y, Li T, Xia X, Su B, Li H, Feng Y, et al. . Different profiles of antibodies and cytokines were found between severe and moderate COVID-19 patients. Front Immunol (2021) 12:723585. doi: 10.3389/fimmu.2021.723585 - DOI - PMC - PubMed
    1. Hariharan A, Hakeem AR, Radhakrishnan S, Reddy MS, Rela M. The role and therapeutic potential of NF-kappa-B pathway in severe COVID-19 patients. Inflammopharmacology (2021) 29:91–100. doi: 10.1007/s10787-020-00773-9 - DOI - PMC - PubMed
    1. Huang C, Wang Y, Li X, Ren L, Zhao J, Hu Y, et al. . Clinical features of patients infected with 2019 novel coronavirus in wuhan, China. Lancet (2020) 395:497–506. doi: 10.1016/S0140-6736(20)30183-5 - DOI - PMC - PubMed

Publication types

Associated data