. 2022 Oct 7:13:946791.
doi: 10.3389/fimmu.2022.946791. eCollection 2022.

Changes in the urinary proteome before and after quadrivalent influenza vaccine and COVID-19 vaccination

Affiliations

Changes in the urinary proteome before and after quadrivalent influenza vaccine and COVID-19 vaccination

Xuanzhen Pan et al. Front Immunol. .

Abstract

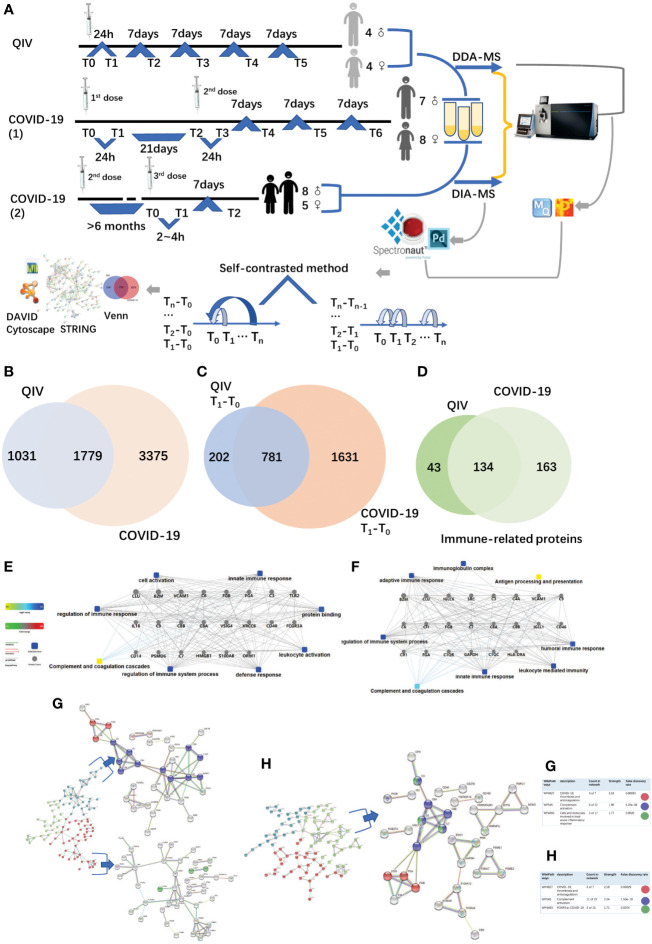
The proteome of urine samples from quadrivalent influenza vaccine cohort were analyzed with self-contrasted method. Significantly changed urine protein at 24 hours after vaccination was enriched in immune-related pathways, although each person's specific pathways varied. We speculate that this may be because different people have different immunological backgrounds associated with influenza. Then, urine samples were collected from several uninfected SARS-CoV-2 young people before and after the first, second, and third doses of the COVID-19 vaccine. The differential proteins compared between after the second dose (24h) and before the second dose were enriched in pathways involving in multicellular organismal process, regulated exocytosis and immune-related pathways, indicating no first exposure to antigen. Surprisingly, the pathways enriched by the differential urinary protein before and after the first dose were similar to those before and after the second dose. It is inferred that although the volunteers were not infected with SARS-CoV-2, they might have been exposed to other coimmunogenic coronaviruses. Two to four hours after the third vaccination, the differentially expressed protein were also enriched in multicellular organismal process, regulated exocytosis and immune-related pathways, indicating that the immune response has been triggered in a short time after vaccination. Multicellular organismal process and regulated exocytosis after vaccination may be a new indicator to evaluate the immune effect of vaccines. Urinary proteome is a terrific window to monitor the changes in human immune function.

Keywords: COVID–19; QIV; proteome; urine; vaccination.


Conflict of interest statement

The authors declare that the research was conducted in the absence of any commercial or financial relationships that could be construed as a potential conflict of interest.

Figures

Figure 1
Figure 1
Overview of the two cohorts and the proteomic workflow. (A) Two cohorts and an illustration of the experimental design. A total of 170 urine samples (36 vaccines) were analyzed from QIV and COVID-19 cohorts. The data-dependent/independent acquisition(DDA/DIA) technique was applied for quantitative proteomics. Integrated data analysis involved protein expression, clustering, and functional correlational network strategies. (B) Venn diagram of total proteins in the QIV cohort compared with the COVID-19 cohort. (C) Venn diagram of differential proteins in the QIV cohort compared with the COVID-19 cohort(T1-T0). (D) Venn diagram of immune-related proteins in the QIV cohort compared with the COVID-19 cohort. Venn diagrams show the overlaps between total, differential(T1-T0), and immune-related proteins. (E, F) The interaction diagrams of immune-related proteins of QIV cohort and COVID-19 cohort respectively involved in tight junctions. Square box represents GO/KEGG pathways, the significance of the pathways represented by −log(p value) (Fisher’s exact test) was shown by color scales with dark blue as most significant. (G) STRING highest confidence(minimum required interaction score: 0.9) PPI network analysis of the immune-related proteins in QIV cohort. The average node degree is 1.13, average local clustering coefficient is 0.387, and PPI enrichment p-value is< 1.0e-16. (H) STRING highest confidence(minimum required interaction score: 0.9) PPI network analysis of the immune-related proteins in COVID-19 cohort. The average node degree is 1.41, average local clustering coefficient is 0.368, and PPI enrichment p-value is< 1.0e-16. The legends under illustrations of (G, H) are on the right side of Figures, which include “count in network (The first number indicates how many proteins in the network are annotated with a particular term. The second number indicates how many proteins in total (in the network and in the background) have this term assigned)”; “strength (Log10(observed/expected).This measure describes how large the enrichment effect is. It’s the ratio between i) the number of proteins in the network that are annotated with a term and ii) the number of proteins that we expect to be annotated with this term in a random network of the same size.)”; “false discovery rate (This measure describes how significant the enrichment is. Shown are p-values corrected for multiple testing within each category using the Benjamini–Hochberg procedure.)”.
Figure 2
Figure 2
Differences in the immune response of each volunteer after QIV vaccination. (A) Total immune-related BP (p-value< 0.05) of everyone by DAVID. The differential proteins(fold change > 2 or< 0.5, p-value<0.05) were obtained by self-contrasted method individually (comparison including: T1-T0, T2-T0, T3-T0, T4-T0, T5-T0; T1-T0, T2-T1, T3-T2, T4-T3, T5-T4). (B) Significantly changed proteins (fold change > 2 or< 0.5, p-value<0.05) in T1 compared T0 was enriched by omicsbean, and their up/down-regulate and PPI were different. Network nodes and edges represent proteins and protein–protein associations. Green/red solid lines represent inhibition/activation; gray dotted lines represent GO pathways. Color bar from red to green represents the fold change of protein level from increasing to decreasing. The significance of the pathways represented by −log(p value) (Fisher’s exact test) was shown by color scales with dark blue as most significant. (C) Venn diagram of the significantly changed proteins (fold change > 2 or< 0.5, p-value<0.05) obtained by the two comparison methods at all different time points for each vaccine recipients. The proteins and their fold change to obtain the overall immune system profile of each person by STRING and omicsbean. These pathway p-value were adjusted.
Figure 3
Figure 3
Functional analysis of differentially changed proteins in the first and second dose of COVID-19 vaccinees. (A) Demonstration of enriched top 40 immune-related biological processes by differential proteins(fold change > 2 or< 0.5, p-value<0.05) in the comparison between T0(before the first dose of vaccination) and T1(24h after the vaccination) of each vaccine, p-value adjusted< e-10. (B) The pathway activation strength value of enriched immune-related biological process(T1-T0), which served as the activation profiles of the Signaling pathways based on the expression of individual genes. Vaccinees immune responses were suppressed, activated or concurrence. The z-score algorithm was used to predict the activation state (either activated or inhibited)30 of the biological process. If the z-score ≤ −2, the process is predicted to be statistically significantly inhibited. (C) GO and KEGG pathway were enriched for this dataset (T1-T0), these enriched processes are statistically significant with p-value adjusted(p-value: calculated with Fish exact test with Hypergeometric algorithm; p-value adjusted: using ‘Benjamini-Hochberg’ method for multiple tests). Network nodes and edges represent proteins and protein–protein associations. Green/red solid lines represent inhibition/activation; gray dotted lines represent GO pathways. Color bar from red to green represents the fold change of protein level from increasing to decreasing. The significance of the pathways represented by −log(p value) (Fisher’s exact test) was shown by color scales with dark blue as most significant. (D) Demonstration of enriched top 40 immune-related biological processes by differential proteins(fold change > 2 or< 0.5, p-value<0.05) in the comparison between T2(before the second dose of vaccination) and T3(24h after the vaccination) of each vaccine, p-value adjusted< e-5. (B) The pathway activation strength value of enriched immune-related biological process(T3-T2). More individuals with upregulated immune systems. (F) Venn diagram of significant top 40 immune-related pathways showing the overlaps between the first and second doses of COVID-19 vaccine(T1-T0; T3-T2). (G) Venn diagram showing the overlaps of total differentially expressed proteins among before and after 1st dose, 2nd dose, and 3rd dose ( T1T01st ; T3T22nd ; T1T03rd ).
Figure 4
Figure 4
Functional analysis of differentially changed proteins in the third dose(booster dose) of COVID-19 vaccinees. (A) Design of the times point of sampling between the vaccinees and the control. All of them had received the first and the second doses of vaccine for more than six months. (B) Demonstration of enriched top 40 immune-related biological processes by differential proteins (fold change > 2 or < 0.5, p-value <0.05) in the comparison between T0 (before the third dose of vaccination) and T1 (2~4h after the vaccination, the first urination after vaccination) of each vaccine, p-value adjusted < e-12. (C) The interaction diagrams showing significant pathways including KEGG pathway and molecular function (T1-T03rd). The KEGG pathways contains complement and coagulations cascades, endocytosis, phagosome, leukocyte transendothelial migration and antigen processing and presentation (p-value adjusted < 1.1e-2). The enriched molecular function contains antigen binding, virus receptor activity, virion binding, immunoglobulin receptor binding(p-value adjusted < 5.70e-23). (D) Demonstration of enriched top 40 significant immune-related biological processes and KEGG pathways (p-value adjusted < 0.05)by differential proteins(fold change > 2 or < 0.5, p-value < 0.05) in the comparison between T0(before the third dose of vaccination) and T2 (7days after the vaccination) of each vaccine. (E) The interaction diagrams (T2-T03rd) showing significant pathways including KEGG pathway(p-value adjusted < 1.18e-3) and molecular function (p-value adjusted < 5.35e-4). (p-value adjusted < 1.18e-3). Network nodes and edges represent proteins and protein–protein associations. Green/red solid lines represent inhibition/activation; gray dotted lines represent GO pathways. Color bar from red to green represents the fold change of protein level from increasing to decreasing. The significance of the pathways represented by −log (p value) (Fisher’s exact test) was shown by color scales with dark blue as most significant. P-value adjusted was used 'Benjamini-Hochberg' method for multiple tests.

Similar articles

Cited by

References

    1. Gao Y. Urine-an untapped goldmine for biomarker discovery? Sci China Life Sci (2013) 56:1145–6. doi: 10.1007/s11427-013-4574-1 - DOI - PubMed
    1. Rodríguez-Suárez E, Siwy J, Zürbig P, Mischak H. Urine as a source for clinical proteome analysis: From discovery to clinical application. Biochim Biophys Acta (2014) 1844:884–98. doi: 10.1016/j.bbapap.2013.06.016 - DOI - PubMed
    1. Xiao X, Zou L, Sun W. “Human Urine Proteome: A Powerful Source for Clinical Research,” In: Gao Y, editor. Urine. Singapore: Springer Singapore; (2019). p. 9–24.
    1. Chen Z, Liu J, Lin L, Xie H, Zhang W, Zhang H, et al. . Analysis of differentially expressed proteome in urine from non-small cell lung cancer patients. Zhongguo Fei Ai Za Zhi (2015) 18:138–45. doi: 10.3779/j.issn.1009-3419.2015.03.03 - DOI - PMC - PubMed
    1. Wang W, Wang S, Zhang M. Identification of urine biomarkers associated with lung adenocarcinoma. Oncotarget (2017) 8:38517–29. doi: 10.18632/oncotarget.15870 - DOI - PMC - PubMed

Publication types