Comparative analysis of the repertoire of insulin-reactive B cells in type 1 diabetes-prone and resistant mice
- PMID: 36275764
- PMCID: PMC9579539
- DOI: 10.3389/fimmu.2022.961209
Comparative analysis of the repertoire of insulin-reactive B cells in type 1 diabetes-prone and resistant mice
Abstract
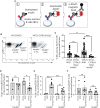
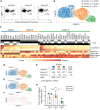
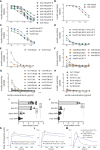
Seropositivity for autoantibodies against multiple islet antigens is associated with development of autoimmune type 1 diabetes (T1D), suggesting a role for B cells in disease. The importance of B cells in T1D is indicated by the effectiveness of B cell-therapies in mouse models and patients. B cells contribute to T1D by presenting islet antigens, including insulin, to diabetogenic T cells that kill pancreatic beta cells. The role of B cell receptor (BCR) affinity in T1D development is unclear. Here, we employed single cell RNA sequencing to define the relationship between BCR affinity for insulin and B cell phenotype during disease development. We utilized immunoglobulin (Ig) heavy chain (VH125) mouse models in which high-affinity insulin-reactive B cells (IBCs) were previously shown to be anergic in diabetes-resistant VH125.C57BL/6-H2g7 and activated in VH125. NOD mice developing disease. Here, high-affinity IBCs were found in the spleen of prediabetic VH125. NOD mice and exhibited marginal zone or follicular phenotypes. Ig light chains expressed by these B cells are unmutated and biased toward Vκ4-74 and Vκ4-57 usage. Receptors expressed by anergic high-affinity IBCs of diabetes-resistant VH125.C57BL/6-H2g7 are also unmutated; however, in this genetic background light chains are polymorphic relative to those of NOD. Light chains derived from NOD and C57BL/6-H2g7 genetic backgrounds conferred divergent kinetics of binding to insulin when paired with the VH125 heavy chain. These findings suggest that relaxation of tolerance mechanisms in the NOD mouse leads to accumulation and partial activation of B cells expressing germline encoded high-affinity BCRs that support development of autoimmunity.
Keywords: B cell receptor (BCR); BCR affinity; immunoglobulin light chain; insulin; non-obese diabetes (NOD) mice; type 1 diabetes (T1D).
Copyright © 2022 Banach, Harley, Getahun and Cambier.
Conflict of interest statement
ITWH is partly funded by the Pfizer Global Grants Foundation Rheumatology program #51849703, but those funds did not support his work on this project. The remaining authors declare that the research was conducted in the absence of any commercial or financial relationships that could be construed as a potential conflict of interest.
Figures


Similar articles
-
Silencing of high-affinity insulin-reactive B lymphocytes by anergy and impact of the NOD genetic background in mice.Diabetologia. 2018 Dec;61(12):2621-2632. doi: 10.1007/s00125-018-4730-z. Epub 2018 Sep 25. Diabetologia. 2018. PMID: 30255377 Free PMC article.
-
Insulin-Reactive T Cells Convert Diabetogenic Insulin-Reactive VH125 B Cells Into Tolerogenic Cells by Reducing Germinal Center T:B Cell Interactions in NOD Mice.Front Immunol. 2020 Nov 12;11:585886. doi: 10.3389/fimmu.2020.585886. eCollection 2020. Front Immunol. 2020. PMID: 33262765 Free PMC article.
-
Soluble Antigen Arrays for Selective Desensitization of Insulin-Reactive B Cells.Mol Pharm. 2019 Apr 1;16(4):1563-1572. doi: 10.1021/acs.molpharmaceut.8b01250. Epub 2019 Feb 25. Mol Pharm. 2019. PMID: 30681867 Free PMC article.
-
B cells and type 1 diabetes ...in mice and men.Immunol Lett. 2014 Aug;160(2):128-32. doi: 10.1016/j.imlet.2014.01.010. Epub 2014 Jan 25. Immunol Lett. 2014. PMID: 24472603 Free PMC article. Review.
-
Control of type 1 autoimmune diabetes by naturally occurring CD4+CD25+ regulatory T lymphocytes in neonatal NOD mice.Ann N Y Acad Sci. 2005 Jun;1051:72-87. doi: 10.1196/annals.1361.048. Ann N Y Acad Sci. 2005. PMID: 16126946 Review.
Cited by
-
Molecular characterization and complexity of the immunoglobulin repertoire in the silver-black fox (Vulpes vulpes).BMC Vet Res. 2025 Mar 28;21(1):214. doi: 10.1186/s12917-025-04676-1. BMC Vet Res. 2025. PMID: 40155920 Free PMC article.
-
The role of B cells in the pathogenesis of type 1 diabetes.Front Immunol. 2024 Dec 24;15:1450366. doi: 10.3389/fimmu.2024.1450366. eCollection 2024. Front Immunol. 2024. PMID: 39776900 Free PMC article. Review.
-
Factors Governing B Cell Recognition of Autoantigen and Function in Type 1 Diabetes.Antibodies (Basel). 2024 Apr 1;13(2):27. doi: 10.3390/antib13020027. Antibodies (Basel). 2024. PMID: 38651407 Free PMC article. Review.
-
Novel approaches to the treatment of type 1 diabetes.J Diabetes. 2022 Nov;14(11):724-726. doi: 10.1111/1753-0407.13333. Epub 2022 Nov 7. J Diabetes. 2022. PMID: 36345147 Free PMC article. No abstract available.
References
-
- Noorchashm H, Lieu YK, Noorchashm N, Rostami SY, Greeley SAS, Schlachterman A, et al. . I-Ag7-Mediated antigen presentation by b lymphocytes is critical in overcoming a checkpoint in T cell tolerance to islet β cells of nonobese diabetic mice. J Immunol (1999) 163(2):743–50. - PubMed
Publication types
MeSH terms
Substances
Grants and funding
LinkOut - more resources
Full Text Sources
Medical
Molecular Biology Databases

