

Milder outcomes of SARS-CoV-2 genetically confirmed reinfections compared to primary infections with the delta variant: A retrospective case-control study
- PMID: 36275814
- PMCID: PMC9582599
- DOI: 10.3389/fmed.2022.962653
Milder outcomes of SARS-CoV-2 genetically confirmed reinfections compared to primary infections with the delta variant: A retrospective case-control study
Abstract
Background: SARS-CoV-2 infection does not confer long immunity. However, studies suggest that prior infection is associated with lower risk of reinfection and milder outcomes of recurrent infections. The aims of this retrospective observational case-control study were to describe the clinical and molecular characteristics of genetically confirmed Delta reinfection cases and to assess the potential protective role of preceding infection on the severity of reinfection.
Methods: We used next generation sequencing (NGS) to explore if cases with two positive real time RT-PCR tests > 90 days apart were infected with a different SARS-CoV-2 variant. Cases with confirmed reinfection between August 1st and October 31st, 2021 (the Delta wave) in Slovenia were matched 1:4 by age, sex and timeframe (week of positive test) with individuals with primary infection. Sociodemographic and epidemiologic data, vaccination status, and data on hospitalization and outcome of infection were retrieved from several centralized and standardized national databases. Additional epidemiologic surveys were performed on a limited number of cases and controls.
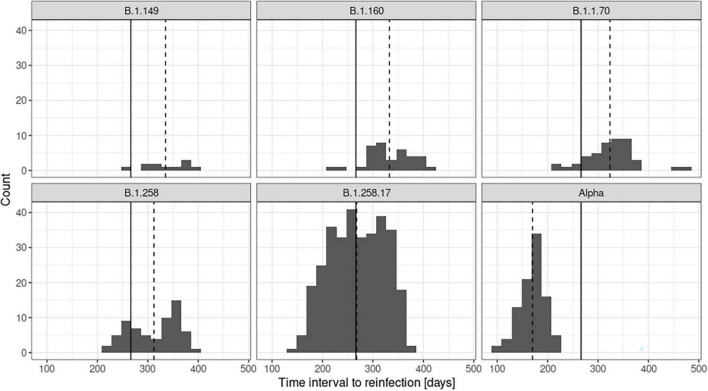
Results: We identified 628 cases of genetically confirmed reinfection during the study period and matched them with 2,512 control subjects with Delta primary infection. Primary infections in individuals with reinfection were mainly caused by B.1.258.17 (51.1%), followed by B.1.1.7 (15.1%) and reinfection was detected on average 271 days after primary infection (range 101-477 days). Our results show a substantially lower probability of hospitalization in cases with reinfection compared with controls (OR: 0.21, p = 0.017), but no significant difference was observed in intensive care unit admission and deaths. We observed a significantly lower proportion of vaccinated individuals among cases compared to controls (4.5% vs. 28.2%), suggesting that hybrid immunity leads to lower probability of reinfection. Detailed analysis of the temporal distribution of variants, responsible for reinfections, showed no significant differences in reinfection potential.
Conclusion: Reinfection with the SARS-CoV-2 Delta variant resulted in fewer hospitalizations compared to the primary Delta infection, suggesting that primary infection may, to some extent, produce at least short lasting protective immunity. This study provides additional insight into the reinfection dynamics that may allow appropriate public health measures to be taken in subsequent waves of the COVID-19 pandemic.
Keywords: COVID-19; Delta variant; NGS; SARS-CoV-2; genetically confirmed variant; protective immunity; reinfection; severity.
Copyright © 2022 Suljič, Sočan, Mrzel, Lunar, Korva, Štorman, Prosenc, Janežič, Žohar-Čretnik, Zupanič, Poljak and Avšič-Županc.
Conflict of interest statement
The authors declare that the research was conducted in the absence of any commercial or financial relationships that could be construed as a potential conflict of interest.
Figures


References
-
- Organisation for Economic Co-operation and Development [OECD]. COVID-19 And Well-Being: Life In The Pandemic. Paris: Organisation for Economic Co-operation and Development; (2022).
-
- Hall VJ, Foulkes S, Charlett A, Atti A, Monk EJM, Simmons R, et al. SARS-CoV-2 infection rates of antibody-positive compared with antibody-negative health-care workers in England: a large, multicentre, prospective cohort study (SIREN). Lancet. (2021) 397:1459–69. 10.1016/S0140-6736(21)00675-9 - DOI - PMC - PubMed
LinkOut - more resources
Full Text Sources
Miscellaneous