

The ALLgorithMM: How to define the hemodilution of bone marrow samples in lymphoproliferative diseases
- PMID: 36276072
- PMCID: PMC9582597
- DOI: 10.3389/fonc.2022.1001048
The ALLgorithMM: How to define the hemodilution of bone marrow samples in lymphoproliferative diseases
Abstract
Introduction: Minimal residual disease (MRD) is commonly assessed in bone marrow (BM) aspirate. However, sample quality can impair the MRD measurement, leading to underestimated residual cells and to false negative results. To define a reliable and reproducible method for the assessment of BM hemodilution, several flow cytometry (FC) strategies for hemodilution evaluation have been compared.
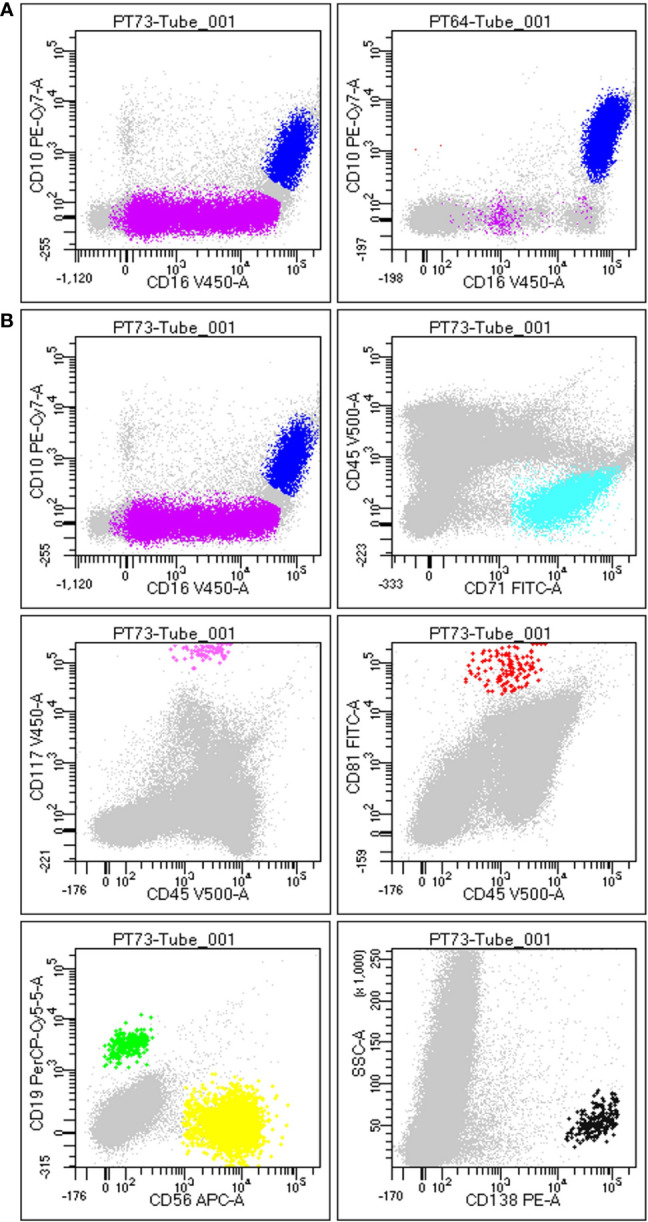
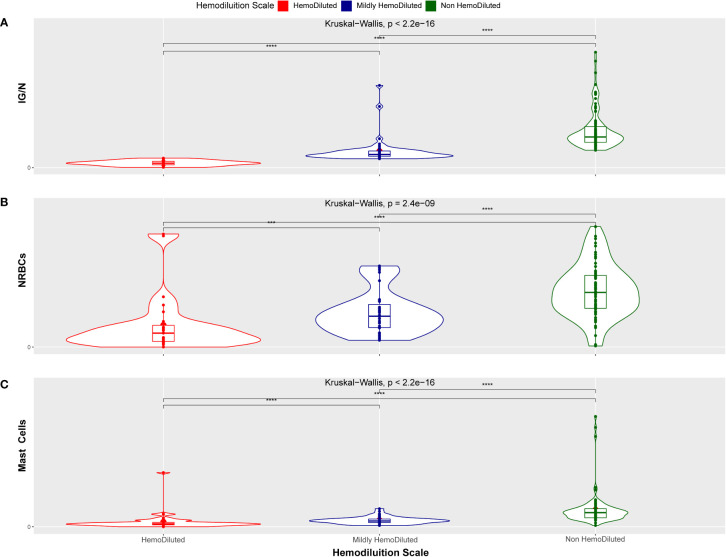
Methods: For each BM sample, cells populations with a well-known distribution in BM and peripheral blood - e.g., mast cells (MC), immature (IG) and mature granulocytes (N) - have been studied by FC and quantified alongside the BM differential count.
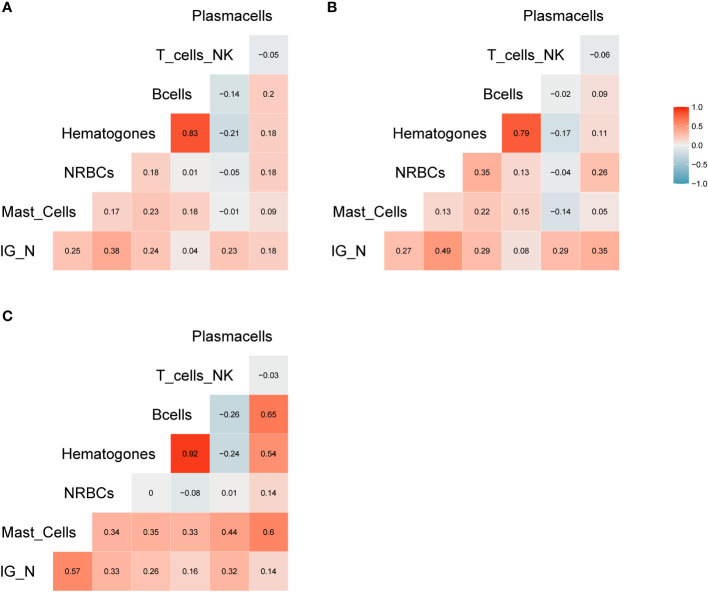
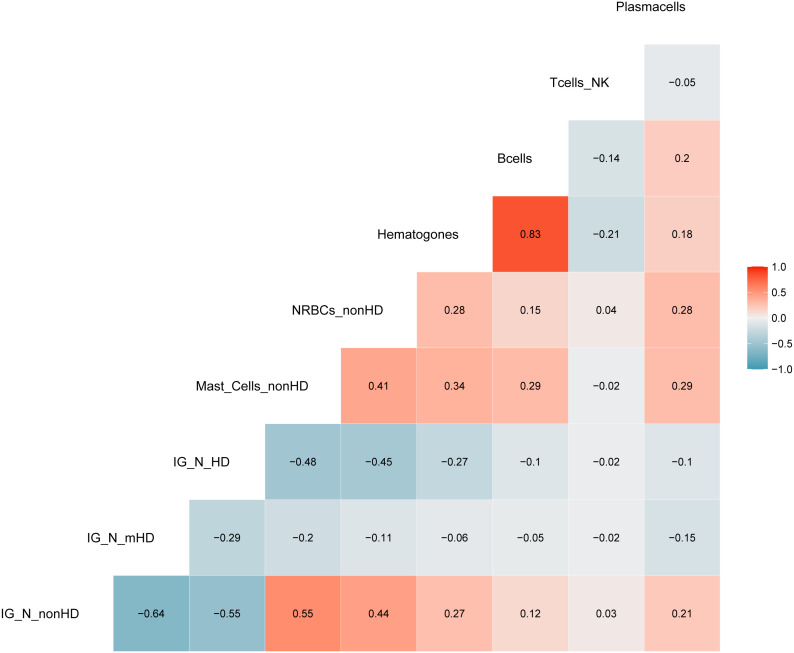
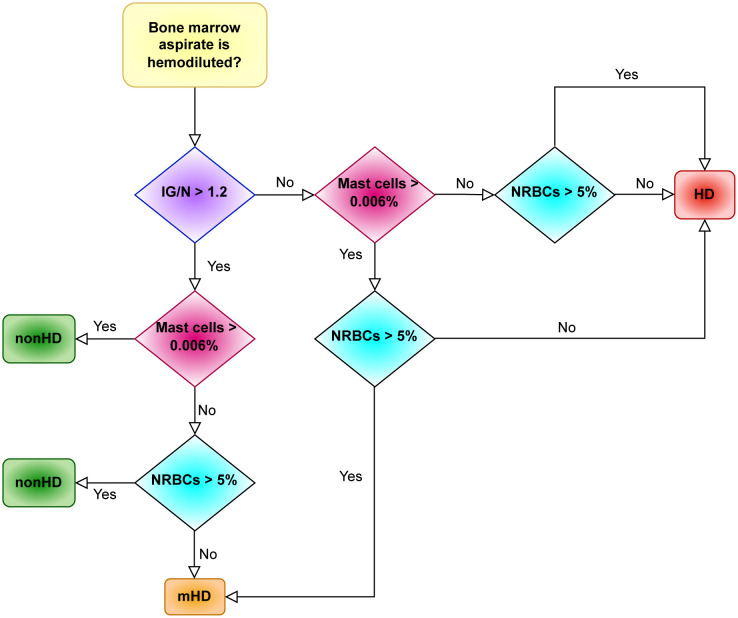
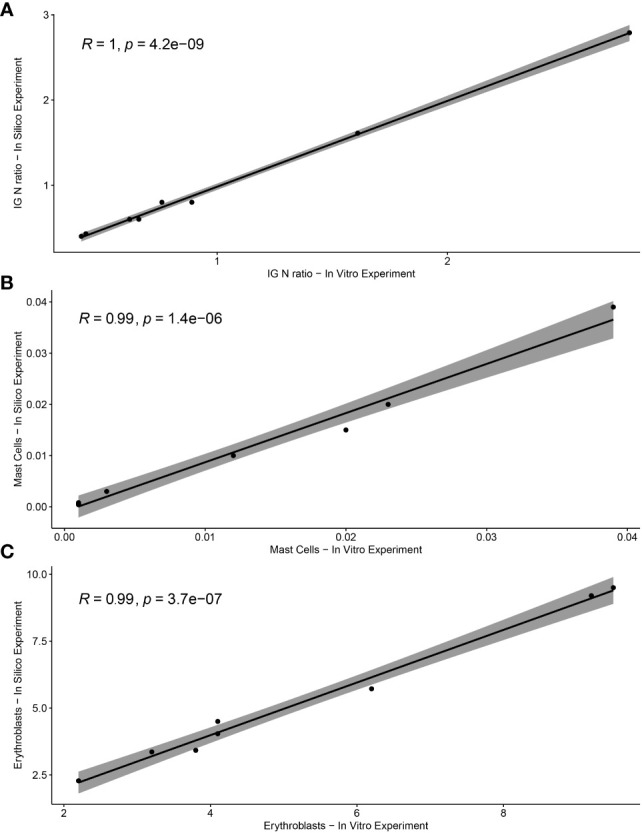
Results: The frequencies of cells' populations were correlated to the IG/N ratio, highlighting a mild correlation with MCs and erythroblasts (R=0.25 and R=0.38 respectively, with p-value=0.0006 and 0.0000052), whereas no significant correlation was found with B or T-cells. The mild correlation between IG/N, erythroblasts and MCs supported the combined use of these parameters to evaluate BM hemodilution, hence the optimization of the ALLgorithMM. Once validated, the ALLgorithMM was employed to evaluate the dilution status of BM samples in the context of MRD assessment. Overall, we found that 32% of FC and 52% of Next Generation Sequencing (NGS) analyses were MRD negative in samples resulted hemodiluted (HD) or at least mildly hemodiluted (mHD).
Conclusions: The high frequency of MRD-negative results in both HD and mHD samples implies the presence of possible false negative MRD measurements, impairing the correct assessment of patients' response to therapy and highlighs the importance to evaluate BM hemodilution.
Keywords: acute lymphoblastic leukemia; flow cytometry; hemodilution; hemodilution/methods; measurable (minimal) residual disease; minimal residual disease; multiple myeloma.
Copyright © 2022 Vigliotta, Armuzzi, Barone, Solli, Pistis, Borsi, Taurisano, Mazzocchetti, Martello, Poletti, Sartor, Rizzello, Pantani, Tacchetti, Papayannidis, Mancuso, Rocchi, Zamagni, Curti, Arpinati, Cavo and Terragna.
Conflict of interest statement
The authors declare that the research was conducted in the absence of any commercial or financial relationships that could be construed as a potential conflict of interest.
Figures
Similar articles
-
Identification of critical hemodilution by artificial intelligence in bone marrow assessed for minimal residual disease analysis in acute myeloid leukemia: The Cinderella method.Cytometry A. 2023 Apr;103(4):304-312. doi: 10.1002/cyto.a.24686. Epub 2022 Sep 12. Cytometry A. 2023. PMID: 36030398
-
Impact of hemodilution on flow cytometry based measurable residual disease assessment in acute myeloid leukemia.Leukemia. 2024 Mar;38(3):630-639. doi: 10.1038/s41375-024-02158-1. Epub 2024 Jan 25. Leukemia. 2024. PMID: 38272991 Free PMC article.
-
Flow Cytometric Analysis of Bone Marrow Particle Cells for Measuring Minimal Residual Disease in Multiple Myeloma.Cancers (Basel). 2022 Oct 8;14(19):4937. doi: 10.3390/cancers14194937. Cancers (Basel). 2022. PMID: 36230860 Free PMC article.
-
Comprehensive characterization of circulating and bone marrow-derived multiple myeloma cells at minimal residual disease.Semin Hematol. 2018 Jan;55(1):33-37. doi: 10.1053/j.seminhematol.2018.02.010. Epub 2018 Mar 1. Semin Hematol. 2018. PMID: 29759150 Free PMC article. Review.
-
Minimal Residual Disease Assessment Within the Bone Marrow of Multiple Myeloma: A Review of Caveats, Clinical Significance and Future Perspectives.Front Oncol. 2019 Aug 20;9:699. doi: 10.3389/fonc.2019.00699. eCollection 2019. Front Oncol. 2019. PMID: 31482061 Free PMC article. Review.
Cited by
-
Circulating Multiple Myeloma Cells (CMMCs) as Prognostic and Predictive Markers in Multiple Myeloma and Smouldering MM Patients.Cancers (Basel). 2024 Aug 23;16(17):2929. doi: 10.3390/cancers16172929. Cancers (Basel). 2024. PMID: 39272787 Free PMC article.
-
Determining hemodilution in diagnostic bone marrow aspirated samples in plasma cell disorders by next-generation flow cytometry: Proposal for a bone marrow quality index.Blood Cancer J. 2023 Dec 1;13(1):177. doi: 10.1038/s41408-023-00951-2. Blood Cancer J. 2023. PMID: 38040702 Free PMC article.
-
Next-generation sequencing and high DNA input identify previously missed measurable residual disease in peripheral blood of B-cell precursor acute lymphoblastic leukaemia.Br J Haematol. 2025 Jan;206(1):353-356. doi: 10.1111/bjh.19834. Epub 2024 Oct 24. Br J Haematol. 2025. PMID: 39449173 Free PMC article. No abstract available.
References
-
- Conter V, Bartram CR, Valsecchi MG, Schrauder A, Panzer-Grümayer R, Möricke A, et al. . Molecular response to treatment redefines all prognostic factors in children and adolescents with b-cell precursor acute lymphoblastic leukemia: results in 3184 patients of the AIEOP-BFM ALL 2000 study. Blood (2010) 115(16):3206–14. doi: 10.1182/blood-2009-10-248146 - DOI - PubMed
LinkOut - more resources
Full Text Sources