. 2022 Oct 6:12:1024362.
doi: 10.3389/fonc.2022.1024362. eCollection 2022.

Impact of cryopreservation on CAR T production and clinical response

Affiliations

Impact of cryopreservation on CAR T production and clinical response

Karin Brezinger-Dayan et al. Front Oncol. .

Abstract

Adoptive cell therapy with chimeric antigen receptor (CAR) T cells has become an efficient treatment option for patients with hematological malignancies. FDA approved CAR T products are manufactured in centralized facilities from fresh or frozen leukapheresis and the cryopreserved CAR T infusion product is shipped back to the patient. An increasing number of clinical centers produce CAR T cells on-site, which enables the use of fresh and cryopreserved PBMCs and CAR T cells. Here we determined the effect of cryopreservation on PBMCs and CD19 CAR T cells in a cohort of 118 patients treated with fresh CAR T cells and in several patients head-to-head. Cryopreserved PBMCs, obtained from leukapheresis products, contained less erythrocytes and T cells, but were sufficient to produce CAR T cells for therapy. There was no correlation between the recovery of PBMCs and the transduction efficacy, the number of CAR T cells obtained by the end of the manufacturing process, the in vitro reactivity, or the response rate to CAR T therapy. We could show that CAR T cells cryopreserved during the manufacturing process, stored and resumed expansion at a later time point, yielded sufficient cell numbers for treatment and led to complete remissions. Phenotype analysis including T cell subtypes, chemokine receptor and co-inhibitory/stimulatory molecules, revealed that fresh CAR T cells expressed significantly more TIM-3 and contained less effector T cells in comparison to their frozen counterparts. In addition, fresh CAR T infusion products demonstrated increased in vitro anti-tumor reactivity, however cryopreserved CAR T cells still showed high anti-tumor potency and specificity. The recovery of cryopreserved CAR T cells was similar in responding and non-responding patients. Although fresh CAR T infusion products exhibit higher anti-tumor reactivity, the use of frozen PBMCs as staring material and frozen CAR T infusion products seems a viable option, as frozen products still exhibit high in vitro potency and cryopreservation did not seem to affect the clinical outcome.

Keywords: CAR T cells; CAR T manufacturing; PBMC; clinical trial; cryopreservation.


Conflict of interest statement

The authors declare that the research was conducted in the absence of any commercial or financial relationships that could be construed as a potential conflict of interest.

Figures

Figure 1
Figure 1
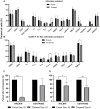
Comparison of fresh versus cryopreserved PBMCs. (A) Fresh PBMC and cryopreservation/thawed PBMCs subpopulation composition markers, were analyzed by flow cytometry (RBC; red blood cells) (n=6). (B) % CD3+ T cells in fresh PBMCs and thawed PBMCs after normalization (fresh PBMCs = 100%) (n=6). Each symbol represents a single patient’s product. (C) Spearman’s rho correlation between the recovery (%) after thawing and the fold expansion achieved by the end of the production process. (n=10). Each dot represents a single patient’s product. (D, E) Fold expansion on day 6 and day 10 after normalization (fresh PBMCs = 100%). Average fold expansion ± SD in comparison to the number of cells taken for transduction on day 2 (n=3). Each symbol represents a single patient’s product. (F) Phenotype analysis of CAR T cell products on day 10 (n=3). Each symbol represents a single patient’s product. (G) CAR T cell potency determined by IFNγ secretion after co-culture with CD19 expressing target cell lines (Toledo, NALM-6 and CD19-K562) and the CD19 negative cell line (CCRL-CEM) (n=3). *p≤.05, ***p≤.0001.
Figure 2
Figure 2
Comparison of cultures that were cryopreserved during the production process. (A) Phenotype analysis of fresh CAR T cells before cryopreserved and after thawing determined by flow cytometry (n=7). (B) Cell numbers (x106) from transduction to infusion. (–; day of cryopreservation). (C) Spearman’s rho correlation between the recovery after thawing and the fold expansion achieved by day 10 of the production process (n=7).
Figure 3
Figure 3
Phenotype analysis and anti-tumor reactivity of cryopreserved infusion products. (A) Fresh CAR T infusion products were characterized by flow cytometry before cryopreservation and after thawing (n=5). NK cells, CD3-CD56+; TN (naïve), CD3+ CD45RA+ CCR7+; TCM (central memory), CD3+CD45RA−CCR7+; TEM (effector memory), CD3+CD45RA−CCR7−; TEMRA (effector), CD3+ CD45RA+ CCR7. (B) Phenotype analysis of the CAR T infusion products gated on CD3+F(ab)2+ CAR T cells (n=5). (C+D) Cell potency determined as IFNγ secretion after co-culture with CD19 expressing target cell lines (NALM-6, CD19-K562). The IFNγ levels are shown after normalization (fresh CAR T, day 10 = 100%) (n=3). (C) Fresh and cryopreserved CAR T cells from day 10. (D) Fresh CAR T cells from day 10 and cryopreserved CAR T cells from day 6, which were thawed 4 days later. *p≤.05, **p≤.01, ***p≤.001.
Figure 4
Figure 4
Comparison of cryopreserved infusion products from day 6 and day 10 and correlation between cell recovery and clinical response. (A) Thawed CAR T cells from day 6 and day 10 were characterized by flow cytometry (n=3). (B) Cell potency of thawed CAR T cells from day 6 and from day 10, determined by IFNγ secretion after co-culture with CD19 expressing target cell lines (NALM-6, CD19-K562). The IFNγ levels are shown after normalization (thawed day 6 = 100%). (n=3); *p≤.01. (C) Spearman’s rho correlation between cell recovery (%) and clinical response (OR; objective responder; NR, non-responder). Each dot represents a single patient’s product. Bold lines represent median, with maximum and minimum range. P values were calculated for unpaired t tests.

References

    1. Maude SL, Laetsch TW, Buechner J, Rives S, Boyer M, Bittencourt H, et al. . Tisagenlecleucel in children and young adults with b-cell lymphoblastic leukemia. N Engl J Med (2018) 378(5):439–48. doi: 10.1056/NEJMoa1709866 - DOI - PMC - PubMed
    1. Neelapu SS, Locke FL, Bartlett NL, Lekakis LJ, Miklos DB, Jacobson CA, et al. . Axicabtagene ciloleucel CAR T-cell therapy in refractory Large b-cell lymphoma. N Engl J Med (2017) 377(26):2531–44. doi: 10.1056/NEJMoa1707447 - DOI - PMC - PubMed
    1. Raje N, Berdeja J, Lin Y, Siegel D, Jagannath S, Madduri D, et al. . Anti-BCMA CAR T-cell therapy bb2121 in relapsed or refractory multiple myeloma. N Engl J Med (2019) 380(18):1726–37. doi: 10.1056/NEJMoa1817226 - DOI - PMC - PubMed
    1. Majzner RG, Mackall CL. Clinical lessons learned from the first leg of the CAR T cell journey. Nat Med (2019) 25(9):1341–55. doi: 10.1038/s41591-019-0564-6 - DOI - PubMed
    1. Liu H, Pan C, Song W, Liu D, Li Z, Zheng L. Novel strategies for immuno-oncology breakthroughs with cell therapy. Biomark Res (2021) 9(1):62. doi: 10.1186/s40364-021-00316-6 - DOI - PMC - PubMed