

Molecular Subtypes Based on Cuproptosis-Related Genes and Tumor Microenvironment Infiltration Characterization in Colorectal Cancer
- PMID: 36276275
- PMCID: PMC9579866
- DOI: 10.1155/2022/5034092
Molecular Subtypes Based on Cuproptosis-Related Genes and Tumor Microenvironment Infiltration Characterization in Colorectal Cancer
Abstract
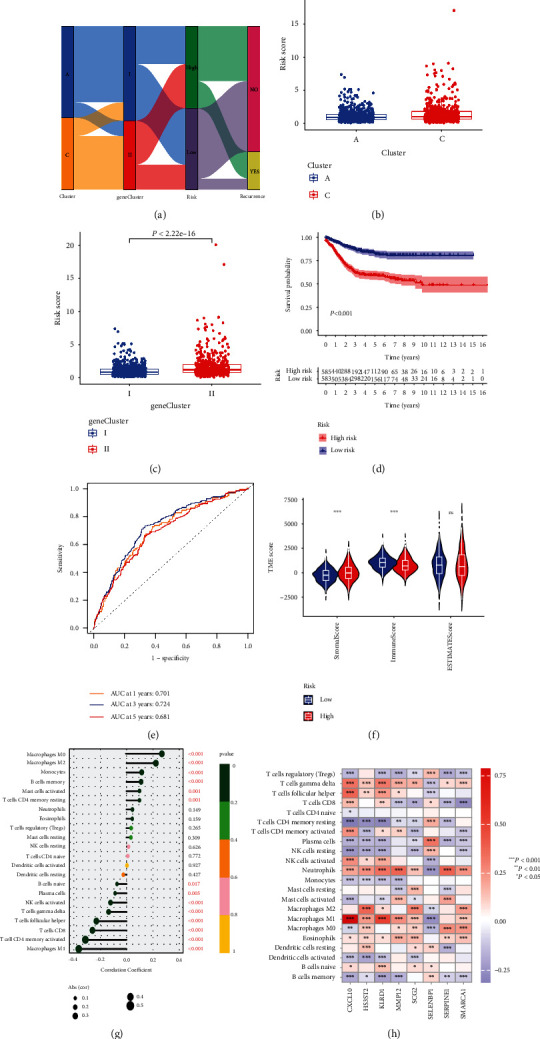
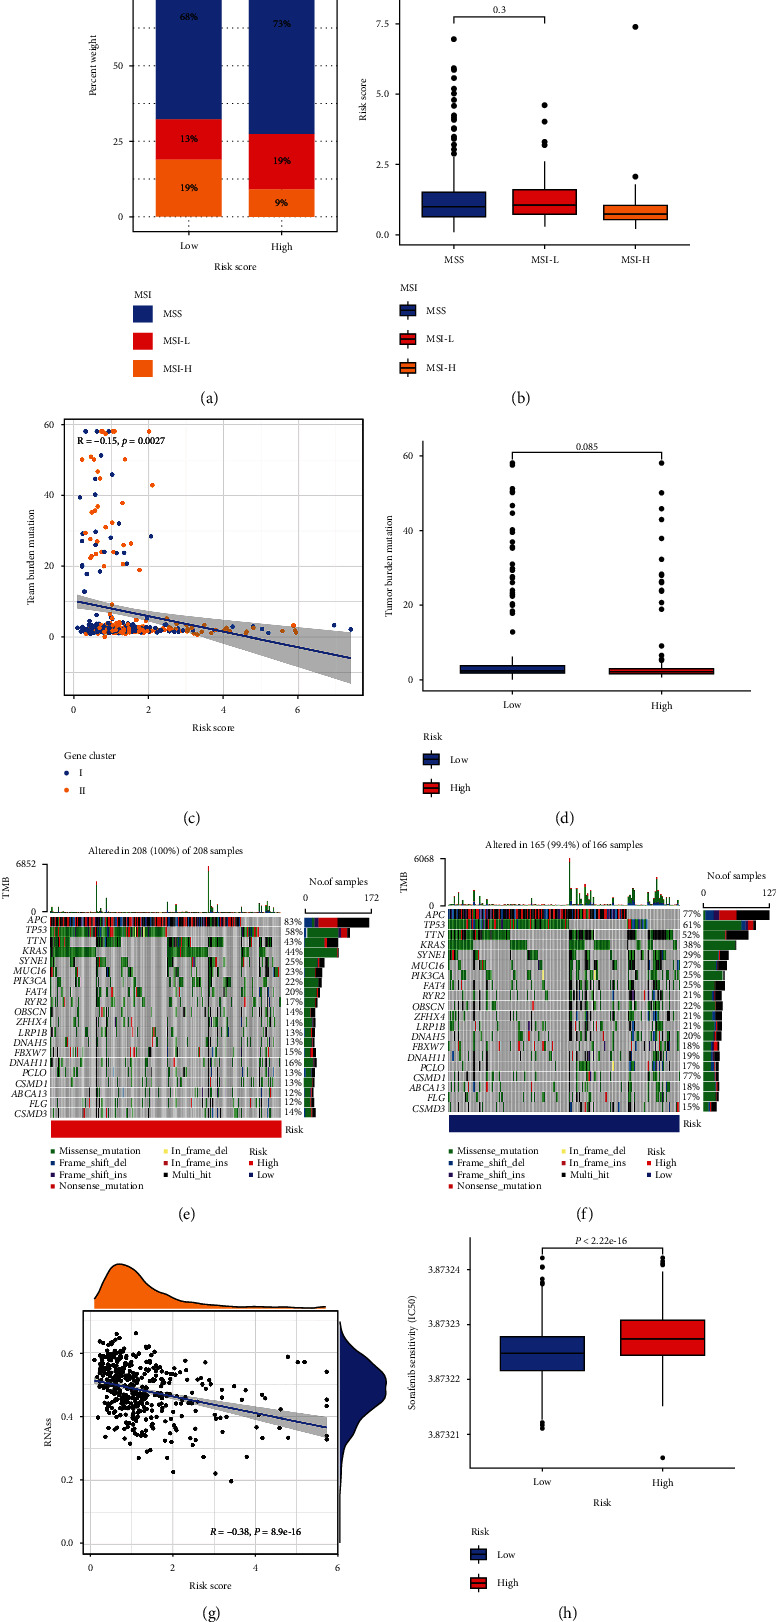
Recent studies have demonstrated the biological significance of cuproptosis modification, a newly discovered programmed cell death, in tumor progression. Nonetheless, the potential role of cuproptosis-related genes (CRGs) in the immune landscape and tumor microenvironment (TME) formation of colorectal cancer (CRC) remains unknown. We comprehensively assessed cuproptosis modification patterns of 1339 CRC samples based on 27 CRGs and systematically analyzed the correlation of these patterns with TME. The CRG-score was constructed to quantify cuproptosis characteristics by LASSO and multivariate Cox regression methods, and its predictive capability was validated in an independent cohort. We identified three distinct cuproptosis modification patterns in CRC. The TME immune cell infiltration demonstrated immune heterogeneity among these three subtypes. Enrichment for multiple metabolism signatures was pronounced in cluster A. Cluster C was significantly correlated with the signaling pathways of immune activation-related, resulting in poor prognoses. Cluster B with mixed features possibly represents a transition phenotype or intratumoral heterogeneity. Then, based on constructed eight-gene CRG-score, we found that the signature could predict the disease-free survival of CRC patients, and the low CRG-score was related to increased neoantigen load, immunity activation, and microsatellite instability-high (MSI-H). Additionally, we observed significant correlations of the CRG-score with the cancer stem cell index and chemotherapeutic drug susceptibility. This study demonstrated that cuproptosis was correlated with tumor progression, prognosis, and TME. Our findings may improve the understanding of CRGs in TME infiltration characterization of CRC patients and contribute to guiding more effective clinical therapeutic strategies.
Copyright © 2022 Hao Huang et al.
Conflict of interest statement
The authors declare that they have no conflicts of interest regarding the publication of this study.
Figures
Similar articles
-
Cuproptosis-related risk score predicts prognosis and characterizes the tumor microenvironment in colon adenocarcinoma.Front Oncol. 2023 Jun 2;13:1152681. doi: 10.3389/fonc.2023.1152681. eCollection 2023. Front Oncol. 2023. PMID: 37333810 Free PMC article.
-
Identification of cuproptosis-related subtypes, construction of a prognosis model, and tumor microenvironment landscape in gastric cancer.Front Immunol. 2022 Nov 21;13:1056932. doi: 10.3389/fimmu.2022.1056932. eCollection 2022. Front Immunol. 2022. PMID: 36479114 Free PMC article.
-
Identification of a novel cuproptosis-related gene signature and integrative analyses in patients with lower-grade gliomas.Front Immunol. 2022 Aug 15;13:933973. doi: 10.3389/fimmu.2022.933973. eCollection 2022. Front Immunol. 2022. PMID: 36045691 Free PMC article. Review.
-
Molecular subtypes based on cuproptosis-related genes and tumor microenvironment infiltration characteristics in pancreatic adenocarcinoma.Cancer Cell Int. 2023 Jan 16;23(1):7. doi: 10.1186/s12935-022-02836-z. Cancer Cell Int. 2023. PMID: 36647100 Free PMC article.
-
Targeting cuproptosis for cancer therapy: Focus on the anti-tumor immune system.Cancer Pathog Ther. 2024 Jul 27;3(3):226-243. doi: 10.1016/j.cpt.2024.07.005. eCollection 2025 May. Cancer Pathog Ther. 2024. PMID: 40458306 Free PMC article. Review.
Cited by
-
Cuproptosis-related risk score predicts prognosis and characterizes the tumor microenvironment in colon adenocarcinoma.Front Oncol. 2023 Jun 2;13:1152681. doi: 10.3389/fonc.2023.1152681. eCollection 2023. Front Oncol. 2023. PMID: 37333810 Free PMC article.
-
Single-cell RNA-Seq and bulk RNA-Seq reveal reliable diagnostic and prognostic biomarkers for CRC.J Cancer Res Clin Oncol. 2023 Sep;149(12):9805-9821. doi: 10.1007/s00432-023-04882-0. Epub 2023 May 29. J Cancer Res Clin Oncol. 2023. PMID: 37247080 Free PMC article.
-
Experimental prognostic model integrating N6-methyladenosine-related programmed cell death genes in colorectal cancer.iScience. 2023 Dec 13;27(1):108720. doi: 10.1016/j.isci.2023.108720. eCollection 2024 Jan 19. iScience. 2023. PMID: 38299031 Free PMC article.
-
Copper in colorectal cancer: From copper-related mechanisms to clinical cancer therapies.Clin Transl Med. 2024 Jun;14(6):e1724. doi: 10.1002/ctm2.1724. Clin Transl Med. 2024. PMID: 38804588 Free PMC article. Review.
-
Cuproptosis in cancer: biological implications and therapeutic opportunities.Cell Mol Biol Lett. 2024 Jun 25;29(1):91. doi: 10.1186/s11658-024-00608-3. Cell Mol Biol Lett. 2024. PMID: 38918694 Free PMC article. Review.
References
-
- Dienstmann R., Villacampa G., Sveen A., et al. Relative contribution of clinicopathological variables, genomic markers, transcriptomic subtyping and microenvironment features for outcome prediction in stage II/III colorectal cancer. Annals of Oncology . 2019;30(10):1622–1629. doi: 10.1093/annonc/mdz287. - DOI - PMC - PubMed
LinkOut - more resources
Full Text Sources
